• Información general
  • Comentarios (2)
  • Discusión
  • Novedades

Soldiers Crows

5

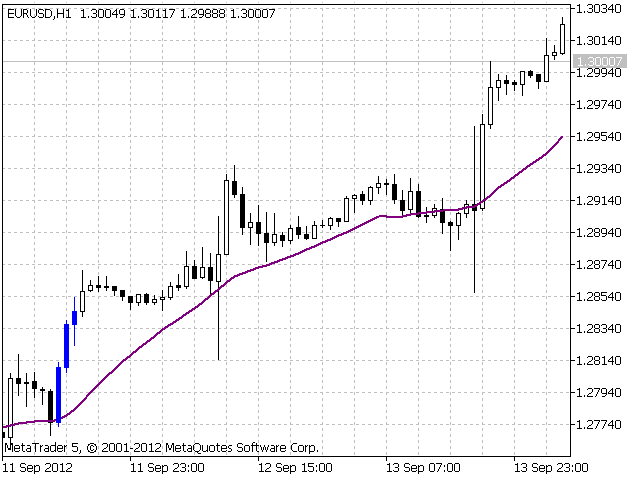
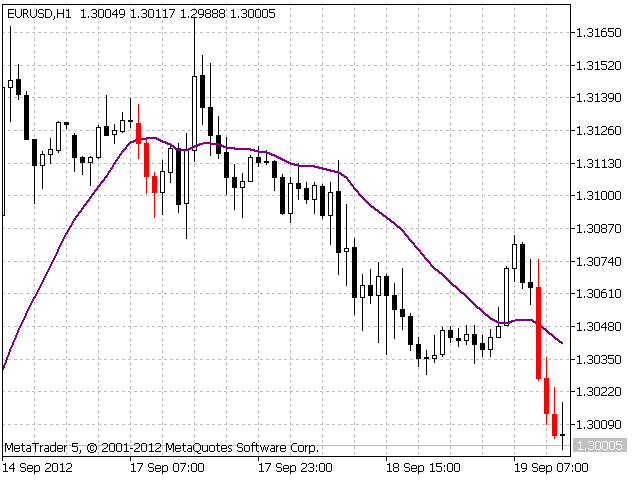
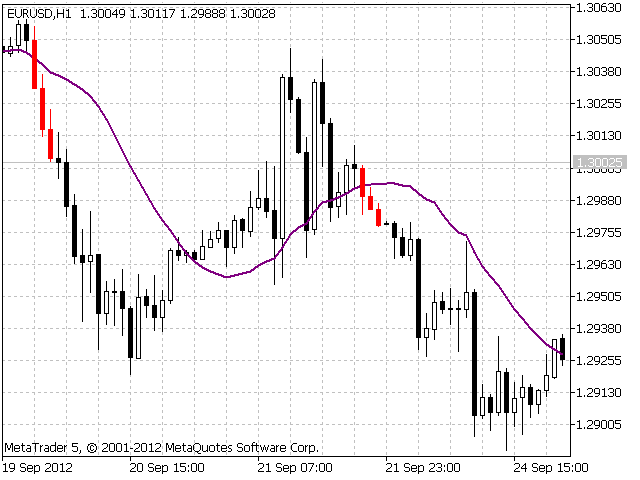
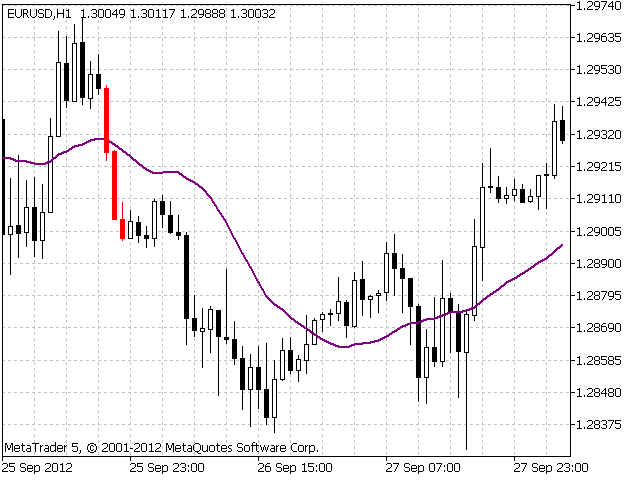
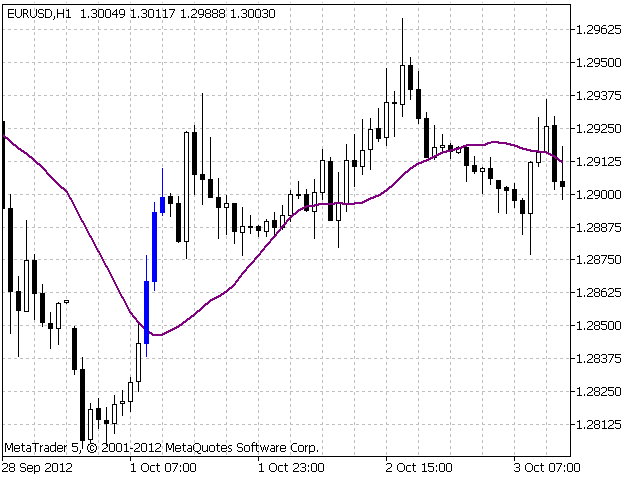
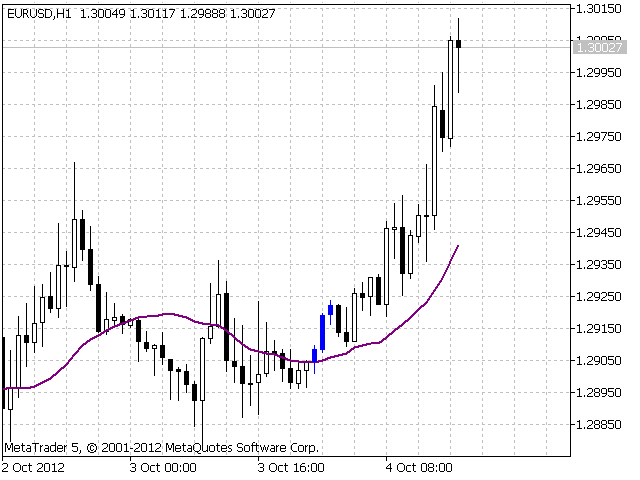
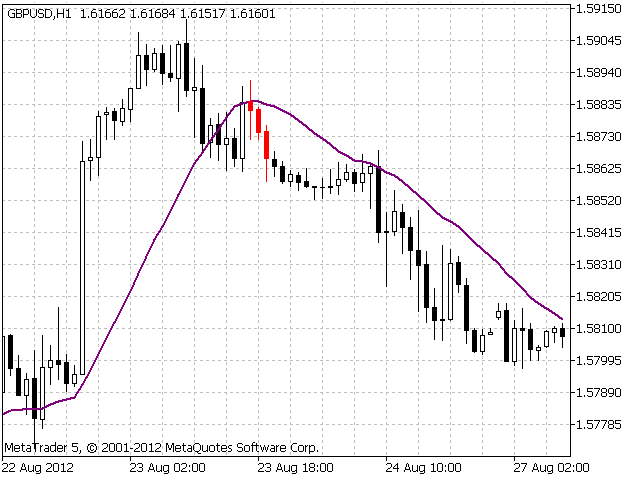
The indicator displays the "Three white soldiers and Three black crows" candlestick model on a chart.

Three white soldiers are color in blue. Three black crows are colored in red.

Input parameters:

  • Max Bars - maximum number of bars calculated on the chart.
  • Make Signal Alert - use alert.
  • Type of pattern rules - use a strict model of determining the pattern (short lower shadows for the three soldiers, short upper shadows for the three crows), or a simplified model.
  • Max Shadow Ratio - coefficient of the length of shadows relative to the main body of a bar (used when the strict model of determining the pattern is selected).
  • Only three in a row - only three consequent bars. Before soldiers - bearish bar. Before crows - bullish bar.
  • Set MA Filter - settings of the filter of crossing the 1-st bar (of 3) by MA.
  • MA Filter Enabled - use the filter of crossing the 1-st bar (of 3) by MA.
  • MA Method - method of averaging of MA.
  • MA Period - period of MA.
  • MA Price Type - type of prices used.
  • Set MACD Filter - settings of the MACD filter.
  • MACD Filter Enabled - use the MACD filter.
  • MACD Fast - fast MA of MACD.
  • MACD Slow - slow MA of MACD.
  • MACD Signal – signal line of MACD.
  • Set DG Filter - settings of the doji filter.
  • DG Filter Enabled - use the doji filter (if one of three bars is doji, the pattern will not be displayed on the chart).
  • Delta Open Close(Pips) - minimum difference between Open and Close prices of a bar in points to detect a doji.
  • Set Grow Filter - settings of the maximal growth filter.
  • Grow Filter Enabled - use the maximal growth filter.
  • Max Grow High-Low (Pips) - maximum difference between High and Low prices of the first and the third bar.

Recommendation on using in combination with the SMA filter:

SL is set on the 'high' level (for the crows) plus a few points, low (for the soldiers) minus a few points of the second bar.

In case the motion of price in the required direction slows down on next bars, or there is a reverse pattern (e.g. Pin Bar), close the position.

The position should also be closed if the price touches the SMA (20).

It is recommended to use the indicator on H1 and higher periods.

Comentarios 2
eugene.nz
411
eugene.nz 2024.06.30 21:21 
 

It is good indicator and very useful. Thank you

Productos recomendados
CandleStick Pattern Indicator MT5
Driller Capital Management UG
5 (1)
This is a simple Candle Stick Pattern Indicator, which shows in the current time period all standardisized Patterns in the chart. All Patterns will be calculatet automatically based on standard conditions. Following Candle Stick Patterns are included: Bullish Hammer | Bearish Hammer Bullish Inverted Hammer | Bearish Inverted Hammer Bullish Engulfing | Bearish Engulfing Piercing | Dark Cloud Cover Bullish 3 Inside | Bearish 3 Inside There are only a few settings at the begining to take. Every Pat
FREE
Candlestick Pattern Teller
Flavio Javier Jarabeck
5 (1)
Minions Labs' Candlestick Pattern Teller It shows on your chart the names of the famous Candlesticks Patterns formations as soon as they are created and confirmed. No repainting. That way beginners and also professional traders who have difficulties in visually identifying candlestick patterns will have their analysis in a much easier format. Did you know that in general there are 3 types of individuals: Visual, Auditory, and Kinesthetic? Don't be ashamed if you cannot easily recognize Candlesti
The   Three Inside Up   candlestick pattern is formed by three candles. Here’s how to identify the Three Inside Up candlestick pattern: The first candle must be bearish The second candle must be bullish The close of the second candle should ideally be above the 50% level of the body of the first one The third candle should close above the first one This 3-candle bullish candlestick pattern is a reversal pattern, meaning that it’s used to find bottoms. For this reason, we want to see this pattern
FREE
Breakthrough signal indicator for the MT5 platform: Your reliable assistant in the world of trading! We are pleased to present you with an innovative signal indicator, which was created in collaboration with an outstanding mathematician. This indicator combines advanced algorithms and the best of the world of mathematical analysis, providing traders with a unique tool for predicting market movements. Why is this indicator unique? 1 .Entry signals without redrawing If a signal appears, it sta
Supply Demand Ranger
Krzysztof Janusz Stankiewic
5 (4)
The indicator draws supply and demand zones. The zone timeframe can be set independently of the chart timeframe. For instance, it is possible to set M5 zones on an H4 chart. The importance of zones can be adjusted using the zone strength parameter. Demand zones are displayed if at least one candle in the range of the zone is entirely above the zone. Similarly, supply zones are displayed if at least one candle within the zone is entirely below the zone.
Next Price Bar
Makarii Gubaydullin
The indicator shows the currently forming candle of the selected time frame Multiple bars   may be   optionally   united   into a single candle: helps to see the bigger picture My   #1   Utility : 65+ features, including this indicator  |   Contact me  for any questions  |   MT4 version In the input settings, select the   timeframe  that will be used for the future bar: To the right of the current price, you will see a bar forming on the specified interval. If activated in the settings, the   Co
A machine translation from the English product description was used. We apologize for possible imprecisions. Se utilizó una traducción automática de la descripción del producto en inglés. Pedimos disculpas por posibles imprecisiones. Un sistema de visualización de patrones de acción de precios de velas japonesas favoritas. Una vez adjunto, el indicador marcará automáticamente los siguientes patrones en el gráfico: Barra de Pinocho (pinbar)  - una barra de cuerpo pequeño con una 'nariz' larga, un
Upper and Lower Reversal - Sistema de previsión temprana de momentos de inversión. Le permite encontrar puntos de inflexión de precios en los límites de los canales de movimiento de precios superior e inferior. El indicador nunca cambiará de color ni cambiará la posición de las flechas de señal. Las flechas rojas son una señal de compra, las flechas azules son una señal de venta. Se ajusta a cualquier marco de tiempo e instrumento comercial. El indicador no se vuelve a dibujar, sólo funciona c
Candle Pattern Scanner
Bruno Goncalves Mascarenhas
Candlestick patterns The candlestick Pattern Indicator and Scanner is designed to be a complete aid tool for discretionary traders to find and analyze charts from powerful candle patterns. Recognized Patterns: Hammer Shooting star Bearish Engulfing Bullish Engulfing Doji Marubozu Scanner Imagine if you could look at all the market assets in all timeframes looking for candlestick signals.
LevelPAttern MT5 is a technical indicator based on the daily levels and Price Action patterns. The indicator is based on the standard ZigZag indicator + reversal candlestick pattens, such as Star, Hammer (also knows as Pin bar), Engulfing and others. The indicator generates audio and text notifications when a pattern is formed and a level is touched. It also supports sending email and push notifications. Indicator operation features It is suitable for working with any CFD and FOREX trading inst
Owl Smart Levels MT5
Sergey Ermolov
4.07 (28)
Versión MT4  |  FAQ El Indicador Owl Smart Levels es un sistema comercial completo dentro de un indicador que incluye herramientas de análisis de mercado tan populares como los fractales avanzados de Bill Williams , Valable ZigZag que construye la estructura de onda correcta del mercado y los niveles de Fibonacci que marcan los niveles exactos de entrada. en el mercado y lugares para tomar ganancias. Descripción detallada de la estrategia Instrucciones para trabajar con el indicador Asesor de c
The Candlestick Patterns indicator for MT5 includes 12 types of candlestick signales in only one indicator. - DoubleTopsAndBottoms - SmallerGettingBars - BiggerGettingBars - ThreeBarsPlay - TwoBarsStrike - Hammers - InsideBars - OutsideBars - LongCandles - TwoGreenTwoRed Candles - ThreeGreenThreeRed Candles The indicator creats a arrow above or under the signal candle and a little character inside the candle to display the type of the signal. For long candles the indicator can display the exact
Indicator for research and finding candle bars patterns real time. Options: Alerts - Enabling alerts Push - Enable push notifications BarInd - On which bar to look for patterns for notifications (1 - formed, 0 - forming) ID - Identifier. Appended to the names of graphic objects and to the message Formula - Formula. In the bar price formula: open1, high1, low1, close1, etc. (open0, high25... any number, 0 is also possible - low0, open0...). Counting bars from right to left from zero. You can use
50+ Candlestick Patterns, Simulated Trading Results, Top Five Performers Candle Analysis extends Candlesticks Pattern Analysis by not only identifying Patterns but also recording the Past Performance of the Patterns. What it Does:- Identifies and plots results on chart Displays Top Patterns for both Bullish and Bearish type.  Log can be printed in experts tab to see Simulated Trading results Displays All or Selected Patterns Alerts on Pattern formation More detailed information in   Blog
Este indicador traza hasta 6 niveles que se pueden habilitar / deshabilitar para hacer que el gráfico sea más limpio según los requisitos del comerciante Estos 6 niveles están en 2 conjuntos: alto y bajo Para cada conjunto, se puede seleccionar un período de tiempo diferente Se basa en la estrategia de reversión del Máximo Mínimo Anterior, ya que se considera que el precio generalmente muestra rechazo en un período de tiempo más pequeño, como 5 minutos, cuando el precio alcanza el Máximo Mín
This indicator scans the 1-3 Trendline pattern . The indicator is a 100 % non repaint low risk breakout system . The patterns are formed around swing high and swing lows which make them a low risk pattern with high reward. PATTERN BACKGROUND The 1-3 Trendline Breakout pattern is formed by four(4) points which are composed of three (3) primary points and the pattern neck. A trendline is always formed by the point 1 and the neck of the pattern . When price breaks out of the trendline formed , it
El Patrón Dorado es una configuración de 3 velas basada en la proporción áurea de la secuencia de Fibonacci. La proporción áurea es 1.618. Sus variaciones incluyen 0,618, 2,618 y 3,618. En este indicador los mejores resultados son 2.618. El patrón Dorado se compone de una vela normal, seguida de una más grande, con un precio de cierre de al menos 2,618 veces el tamaño de la primera vela. El patrón dorado alcista está formado por velas alcistas, mientras que el patrón dorado bajista está fo
Golden Spike Premium
Kwaku Bondzie Ghartey
Golden Spikes Detector Acknowledgement and Dedications:  The name of this indicator was Inspired by an Original; Mr Grant Koopman; a Knowledgeable and experienced Synthetics trader. I dedicate this indicator to Mr Grant.  Overview:   The Golden Spikes Premium is a groundbreaking trading indicator meticulously crafted for the Boom and Crash indices on the Deriv market. Tailored to meet the needs of discerning traders, this powerful tool operates exclusively on the one-minute timeframe, providing
Trend reversal identification: The K-line countdown indicator helps traders capture trend reversal signals by identifying excessive buying and selling behavior in the market. This indicator is particularly effective when the market is in extreme states. Risk management: This indicator can help traders identify potential risks in the market before the trend reverses and adjust positions in time to avoid losses. For example, you might consider reducing your long position when a bullish countdown c
The indicator identifies two most important patterns of technical analysis - Pin Bar and Engulfing. MT4-version:    https://www.mql5.com/en/market/product/53591 Settings: Mincandle size for PinBar   - The minimum size of the Pin-Bar candlestick; Percentage of candle body on size   - The percentage of the candle body in relation to its length; PinBar Alert   - Alert when a Pin-Bar is detected; PinBar Mail   - Sends an email when a Pin Bar is found; PinBar Notification   - Sends a push notificati
The Extremum catcher MT5 indicator analyzes the price action after breaking the local Highs and Lows and generates price reversal signals with the ability to plot the Price Channel. If you need the version for MetaTrader 4, see Extremum catcher . The indicator takes the High and Low of the price over the specified period - 24 bars by default (can be changed). Then, if on the previous candle, the price broke the High or Low level and the new candle opened higher than the extremums, then a signal
The indicator detects divergence signals - the divergences between the price peaks and the MACD oscillator values. The signals are displayed as arrows in the additional window and are maintained by the messages in a pop-up window, e-mails and push-notifications. The conditions which formed the signal are displayed by lines on the chart and in the indicator window. The indicator parameters MacdFast - fast MACD line period MacdSlow - slow MACD line period MacdSignal - MACD signal line period Macd
Candlestick Pattern Detector
Adhemar Braganca Correa Travassos
This indicator can identify more than 60 candlestick patterns on the chart, including their bullish and bearish variants. Just choose the pattern you want in the settings. Available Patterns 2 Crows Gravestone Doji On Neck 3 Black Crows Hammer Piercing 3 Inside Hanging Man Rick Shawman 3 Line Strike Harami Rising and Falling Three Method 3 Outside Harami Cross Separating Lines 3 Stars in South High Wave Shooting Star 3 White Soldiers Hikkake Short Line Abandoned Baby Hikkake Modified Spinning T
Basing Candles
Abdelkhabir Yassine Alaoui
Basing Candles indicator is an automatic indicator that detects and marks basing candles on the chart. A basing candle is a candle with body length less than 50% of its high-low range. A basing candle or basing candlestick is a trading indicator whose body length is less than half of its range between the highs and lows. That's less than 50% of its range. The indicator highlights the basing candles using custom candles directly in the main chart of the platform. The percentage criterion can be
FREE
KT Inside Bar MT5
KEENBASE SOFTWARE SOLUTIONS
KT Inside Bar plots the famous inside bar pattern in which the bar carries a lower high and higher low compared to the previous bar. The last bar is also known as the mother bar. On smaller time-frames, the inside bar sometimes appears similar to a triangle pattern. Features Also plots entry, stop-loss, and take-profit levels with the inside bar pattern. No complex inputs and settings. Erase unwanted levels when the price reaches the entry line in either direction. All Metatrader alerts include
The indicator is designed to display candles (bars) of a higher timeframe on the current one. The indicator has many settings for the displayed candles, as well as a sound signal that will sound a few minutes (seconds) before the bar closes. Input parameters: BarsCount = 50 - the number of displayed bars of the higher timeframe Auto_Candle_UP_TF = false - Automatic selection of a higher timeframe Candle_UP_TF = PERIOD_H1 - Higher timeframe, if Auto_Candle_UP_TF = false Signal_Close_Candle_UP_TF
Oscillator trading signals - это динамический индикатор, определяющий состояние к продолжению тенденции роста или падению цены торгового инструмента и отсечению зон с нежелательной торговлей. Индикатор состоит из 2 линий осцилляторов. Медленная и быстрая сигнальная линия.  Шкала отображения перевернутая. Зоны вблизи 0 свидетельствуют о тенденции роста цены валютной пары. Зоны -100 свидетельствуют о падении цены валютной пары. На основном графике в виде стрелок отображается потенциально выгодные
Fractal 358 Plus
Renato Fridschtein
Fractal 358 Plus is a predictive indicator that provides the clearest sight of price movements. Identifying graphic patterns such as Caixote (Crate), Pivot and Inside Candle , it shows entries and exits spots, as well as threats to your trades in the markets. It comes ready to use with B3 Mini Index (WIN$ series) and can be adjusted to use with any asset and timeframe. Fractal 358 unravels price movement Based on the Fibonacci sequence, Fractal 358 is a new and different way of reading and und
Candlestick Patterns MT5  is a simple and convenient indicator able to define 29 candle patterns. Advantages Defines and highlights 29 candle patterns; Estimated trading direction is shown as an arrow; Each candlestick pattern can be disabled in the settings; The indicator can be used as an arrow indicator in EAs. Parameters TextSize  - chart text size; TextColor  - chart text color; Alert  - enable/disable alerts; ---------- Candlestick Patterns -------------  - settings separator; AdvanceBlo
Este indicador construye una proyección del período más alto en el período actual.   Visualización en forma de velas.   Ayuda a comprender mejor los procesos dentro del mercado y su escala.   Facilita la búsqueda de patrones de velas.   Es posible habilitar varios indicadores con diferentes parámetros y ver muchos marcos de tiempo al mismo tiempo.   En la configuración, puede cambiar el color de las velas en cada dirección y su grosor. ¡Importante! Si el indicador no dibuja nada, entonces o el p
Los compradores de este producto también adquieren
Trend Screener Pro MT5
STE S.S.COMPANY
4.89 (74)
Desbloquee el poder del comercio de tendencias con el indicador Trend Screener: ¡su solución definitiva para el comercio de tendencias impulsada por lógica difusa y un sistema multidivisa!Mejore su comercio de tendencias con Trend Screener, el revolucionario indicador de tendencias impulsado por lógica difusa. Es un poderoso indicador de seguimiento de tendencias que combina más de 13 herramientas y funciones premium y 3 estrategias comerciales, lo que lo convierte en una opción versátil para co
Golden Trend Indicator MT5
Noha Mohamed Fathy Younes Badr
4.88 (16)
Golden Trend indicator  is The best indicator for predicting trend movement this indicator never lags and never repaints and never back paints    and give  arrow buy and sell    before the candle appear  and it will help you and  will make your trading decisions clearer its work on all currencies and  gold and crypto and all time frame This unique  indicator uses very secret algorithms to catch the  trends, so you can trade using this indicator and see the trend clear on charts  manual guide and
FX Levels MT5
Daniel Stein
5 (3)
FX Levels: Zonas de Soporte y Resistencia con Precisión Excepcional para Todos los Mercados Resumen Rápido ¿Busca una manera confiable de identificar niveles de soporte y resistencia en cualquier mercado — ya sean divisas, índices, acciones o materias primas? FX Levels combina el método tradicional “Lighthouse” con un enfoque dinámico vanguardista, ofreciendo una precisión casi universal. Gracias a nuestra experiencia real con brokers y a las actualizaciones automáticas diarias más las de tiem
IX Power MT5
Daniel Stein
4.83 (6)
IX Power: Descubre perspectivas de mercado para índices, materias primas, criptomonedas y forex Descripción general IX Power es una herramienta versátil diseñada para analizar la fortaleza de índices, materias primas, criptomonedas y símbolos de forex. Mientras que FX Power ofrece la máxima precisión para pares de divisas mediante el uso de datos de todos los pares disponibles, IX Power se centra exclusivamente en los datos del mercado del símbolo subyacente. Esto convierte a IX Power en una e
FX Volume MT5
Daniel Stein
4.82 (17)
FX Volume: Experimente el Verdadero Sentimiento del Mercado desde la Perspectiva de un Bróker Resumen Rápido ¿Desea llevar su estrategia de trading a otro nivel? FX Volume ofrece información en tiempo real sobre cómo los traders minoristas y los brókers están posicionados, mucho antes de que aparezcan informes retrasados como el COT. Ya sea que busque beneficios consistentes o simplemente quiera una ventaja más profunda en los mercados, FX Volume le ayuda a identificar desequilibrios important
FX Power MT5 NG
Daniel Stein
5 (11)
FX Power: Analiza la Fuerza de las Divisas para Decisiones de Trading Más Inteligentes Descripción General FX Power es tu herramienta esencial para comprender la fuerza real de las principales divisas y el oro en cualquier condición de mercado. Al identificar divisas fuertes para comprar y débiles para vender, FX Power simplifica las decisiones de trading y descubre oportunidades de alta probabilidad. Ya sea que quieras seguir las tendencias o anticipar reversiones utilizando valores extremos
CBT Quantum Maverick Sistema de Comercio de Opciones Binarias de Alta Eficiencia CBT Quantum Maverick es un sistema de opciones binarias de alto rendimiento diseñado para traders que buscan precisión, simplicidad y un enfoque disciplinado. No requiere personalización: el sistema está optimizado para resultados efectivos desde el primer momento. Simplemente sigue las señales, que se pueden dominar con un poco de práctica. Características clave: Precisión de señales: Señales basadas en la próxim
TPSproTREND PrO MT5
Roman Podpora
4.69 (16)
TPSpro TREND PRO  - is a trend indicator that automatically analyzes the market and provides information about the trend and each of its changes, as well as giving signals for entering trades without redrawing! The indicator uses each candle, analyzing them separately. referring to different impulses - up or down impulse. Exact entry points into transactions for currencies, crypto, metals, stocks, indices!  ИНСТРУКЦИЯ RUS         INSTRUCTIONS  ENG       R ecommended to use with an indicator   -
FX Dynamic: Rastrea la volatilidad y las tendencias con un análisis ATR personalizable Descripción general FX Dynamic es una herramienta potente que emplea los cálculos de Average True Range (ATR) para brindar a los traders información incomparable sobre la volatilidad diaria e intradía. Al establecer umbrales de volatilidad claros —por ejemplo, 80%, 100% y 130%— puedes identificar rápidamente oportunidades de beneficio o recibir alertas cuando el mercado excede sus rangos habituales. FX Dynam
Este es un genial indicador para MT5 que ofrece señales precisas para entrar en una transacción sin redibujar. Se puede aplicar a cualquier activo financiero: fórex, criptomonedas, metales, acciones, índices. Nos dará valoraciones bastante precisas y nos dirá cuándo es mejor abrir y cerra una transacción. Eche un vistazo  al vídeo  (6:22), ¡contiene un ejemplo de procesamiento de una sola señal que ha amortizado el indicador! La mayoría de los tráders mejoran sus resultados comerciales durante l
Este tablero muestra los últimos   patrones armónicos   disponibles para los símbolos seleccionados, por lo que ahorrará tiempo y será más eficiente /   versión MT4 . Indicador gratuito:   Basic Harmonic Pattern Columnas del indicador Symbol:   aparecerán los símbolos seleccionados Trend :   alcista o bajista Pattern :   tipo de patrón (gartley, mariposa, murciélago, cangrejo, tiburón, cifrado o ABCD) Entry :   precio de entrada SL:   precio de stop loss TP1:   1er precio de toma de beneficios
Matrix Arrow Indicator MT5
Juvenille Emperor Limited
5 (13)
Matrix Arrow Indicator MT5   es una tendencia única 10 en 1 que sigue un indicador   100% sin repintado   de marcos temporales múltiples que se puede usar en todos los símbolos/instrumentos:   divisas ,   materias primas ,   criptomonedas ,   índices ,   acciones .  Matrix Arrow Indicator MT5  determinará la tendencia actual en sus primeras etapas, recopilando información y datos de hasta 10 indicadores estándar, que son: Índice de movimiento direccional promedio (ADX) Índice de canales de prod
Gartley Hunter Multi
Siarhei Vashchylka
5 (9)
Gartley Hunter Multi - An indicator for searching for harmonic patterns simultaneously on dozens of trading instruments and on all possible timeframes. Manual (Be sure to read before purchasing) | Version for MT4 Advantages 1. Patterns: Gartley, Butterfly, Shark, Crab. Bat, Alternate Bat, Deep Crab, Cypher 2. Simultaneous search for patterns on dozens of trading instruments and on all possible timeframes 3. Search for patterns of all possible sizes. From the smallest to the largest 4. All fou
Gold Stuff mt5
Vasiliy Strukov
4.92 (173)
Gold Stuff mt5: un indicador de tendencia diseñado específicamente para el oro, también se puede usar en cualquier instrumento financiero. El indicador no se vuelve a dibujar ni se retrasa. El marco de tiempo recomendado es H1. IMPORTANTE! Póngase en contacto conmigo inmediatamente después de la compra para obtener instrucciones y bonificación!   Puede obtener una copia gratuita de nuestro indicador Strong Support y Trend Scanner, por favor envíe un mensaje privado. ¡a mí! PARÁMETROS Draw Ar
TPSpro RFI Levels MT5
Roman Podpora
4.53 (19)
INSTRUCCIONES       RUSO   -   ING        Se   recomienda utilizar con un indicador.       -       TPSpro   TENDENCIA PRO -   Versión MT5 Un elemento clave en el trading son las zonas o niveles desde los que se toman las decisiones de compra o venta de un instrumento de trading. A pesar de los intentos de los principales actores de ocultar su presencia en el mercado, inevitablemente dejan rastros. Nuestra tarea era aprender a identificar estos rastros e interpretarlos correctamente. Funciones p
Ante todo, vale la pena enfatizar que esta Herramienta de Trading es un Indicador No Repintado, No Redibujado y No Retrasado, lo que la hace ideal para el trading profesional. Curso en línea, manual del usuario y demostración. El Indicador de Conceptos de Acción del Precio Inteligente es una herramienta muy potente tanto para traders nuevos como experimentados. Combina más de 20 indicadores útiles en uno solo, combinando ideas avanzadas de trading como el Análisis del Trader del Círculo Interi
Atomic Analyst MT5
Issam Kassas
4.32 (19)
En primer lugar, vale la pena enfatizar que este Indicador de Trading no repinta, no redibuja y no se retrasa, lo que lo hace ideal tanto para el trading manual como para el automatizado. Manual del usuario: configuraciones, entradas y estrategia. El Analista Atómico es un Indicador de Acción del Precio PA que utiliza la fuerza y el impulso del precio para encontrar una mejor ventaja en el mercado. Equipado con filtros avanzados que ayudan a eliminar ruidos y señales falsas, y aumentan el poten
Bill Williams Advanced
Siarhei Vashchylka
5 (9)
Bill Williams Advanced is designed for automatic chart analysis using Bill Williams' "Profitunity" system. The indicator analyzes four timeframes at once. Manual (Be sure to read before purchasing) Advantages 1. Automatically analyzes the chart using the "Profitunity" system of Bill Williams. The found signals are placed in a table in the corner of the screen. 2. Equipped with a trend filter based on the Alligator indicator. Most of the system signals are recommended to be used only according t
Support And Resistance Screener está en un indicador de nivel para MetaTrader que proporciona múltiples herramientas dentro de un indicador. Las herramientas disponibles son: 1. Cribador de estructura de mercado. 2. Zona de retroceso alcista. 3. Zona de retroceso bajista. 4. Puntos pivotes diarios 5. Puntos de pivote semanales 6. Puntos Pivotes mensuales 7. Fuerte soporte y resistencia basado en patrón armónico y volumen. 8. Zonas de nivel de banco. OFERTA POR TIEMPO LIMITADO: El indicador de so
Quantum Trend Sniper
Bogdan Ion Puscasu
4.73 (51)
Introduciendo       Indicador Quantum Trend Sniper   , el innovador indicador MQL5 que está transformando la forma en que identificas y negocias los cambios de tendencia. Desarrollado por un equipo de comerciantes experimentados con experiencia comercial de más de 13 años,       Indicador de francotirador de tendencia cuántica       está diseñado para impulsar su viaje comercial a nuevas alturas con su forma innovadora de identificar cambios de tendencia con una precisión extremadamente alta. *
RelicusRoad Pro MT5
Relicus LLC
4.78 (18)
Ahora $ 147 (aumentando a $ 499 después de algunas actualizaciones) - Cuentas ilimitadas (PC o Mac) Manual de usuario de RelicusRoad + Videos de capacitación + Acceso al grupo privado de Discord + Estado VIP UNA NUEVA MANERA DE VER EL MERCADO RelicusRoad es el indicador comercial más poderoso del mundo para divisas, futuros, criptomonedas, acciones e índices, y brinda a los comerciantes toda la información y las herramientas que necesitan para mantenerse rentables. Brindamos análisis técnico
Quantum TrendPulse
Bogdan Ion Puscasu
5 (13)
Presentamos   Quantum TrendPulse   , la herramienta de trading definitiva que combina el poder de   SuperTrend   ,   RSI   y   Stochastic   en un indicador integral para maximizar su potencial de trading. Diseñado para traders que buscan precisión y eficiencia, este indicador le ayuda a identificar tendencias del mercado, cambios de impulso y puntos de entrada y salida óptimos con confianza. Características principales: Integración con SuperTrend:   siga fácilmente la tendencia predominante del
TW Trend Scalper Indicator: TW Scalper Shoot te brinda una experiencia de trading única al utilizar las últimas estrategias de trading y tecnología de inteligencia artificial. Este producto satisface las diversas necesidades de los traders scalpers al proporcionar dos categorías distintas de señales: Prueba este excepcional producto hoy y comienza tu experiencia única hacia convertirte en un scalper de tendencias. Además, recibe un producto valorado en $37 como regalo. Categorías de señales
El Indicador de Cuadrados de Gann es una herramienta poderosa de análisis de mercado basada en el artículo "Fórmula Matemática para Predicciones de Mercado" escrito por W.D. Gann, que se basa en conceptos matemáticos para el análisis. Incorpora elementos de las técnicas de Gann relacionadas con los cuadrados de 144, 90 y 52, así como el cuadrado de 9. Además, incluye el método del  sobre cómo combinar el cuadrado de 9 con canales y patrones de estrellas. Manual del Usuario y Modo de Uso: Antes d
ICT, SMC, SMART MONEY CONCEPTS, SMART MONEY, Smart Money Concept, Support and Resistance, Trend Analysis, Price Action, Market Structure, Order Blocks, BOS/CHoCH,   Breaker Blocks ,  Momentum Shift,   Supply&Demand Zone/Order Blocks , Strong Imbalance,   HH/LL/HL/LH,    Fair Value Gap, FVG,  Premium  &   Discount   Zones, Fibonacci Retracement, OTE, Buy Side Liquidity, Sell Side Liquidity, BSL/SSL Taken, Equal Highs & Lows, MTF Dashboard, Multiple Time Frame, BigBar, HTF OB, HTF Market Structure
BookMap HeatMap
Roberto Spadim
1 (2)
This Indicator creates a heatmap based on depth of market of the current symbol or another symbol. Other symbol is useful when you trade futures market and a contract has 'mini' and 'full' split. For example, in Brazil (B3 - BMF&Bovespa), WDO and DOL are future Forex contract of BRL/USD (where 1 DOL = 5 WDO) and big banks work mostly with DOL (where liquidity is important). Please use with M1 timeframe , objects are too small to be displayed at higher timeframes (MT5 limit). The number of level
Berma Bands
Muhammad Elbermawi
5 (3)
El indicador de bandas de Berma (BB) es una herramienta valiosa para los operadores que buscan identificar y aprovechar las tendencias del mercado. Al analizar la relación entre el precio y las bandas de Berma, los operadores pueden discernir si un mercado se encuentra en una fase de tendencia o de rango. Visita el [ Blog de Berma Home ] para saber más. Las bandas de Berma se componen de tres líneas distintas: la banda de Berma superior, la banda de Berma media y la banda de Berma inferior. Esta
Gold Trend 5
Sergei Linskii
3.5 (2)
Tendencia del oro : se trata de un buen indicador técnico bursátil. El algoritmo del indicador analiza el movimiento del precio de un activo y refleja la volatilidad y las posibles zonas de entrada. Las mejores señales del indicador: - Para VENTA = histograma rojo + puntero rojo CORTO + flecha amarilla de señal en la misma dirección. - Para COMPRA = histograma azul + puntero azul LARGO + flecha de señal aqua en la misma dirección. Ventajas del indicador: 1. El indicador produce señales co
Introduciendo       Quantum Breakout PRO   , el innovador indicador MQL5 que está transformando la forma en que comercia con Breakout Zones. Desarrollado por un equipo de comerciantes experimentados con experiencia comercial de más de 13 años,       Desglose cuántico PRO       está diseñado para impulsar su viaje comercial a nuevas alturas con su innovadora y dinámica estrategia de zona de ruptura. El indicador de ruptura cuántica le dará flechas de señal en las zonas de ruptura con 5 zonas ob
Golden Spikes Detector
Batsirayi L Marango
3.25 (4)
Golden Spikes Detector Este indicador se basa en una estrategia avanzada principalmente para negociar picos en índices de auge y caída. Se implementaron algoritmos complejos para detectar únicamente entradas de alta probabilidad. Alerta sobre posibles entradas de Compra y Venta. Para negociar picos en el corredor Deriv o Binary, solo acepte las alertas Buy Boom y Sell Cash. Se optimizó para cargarse en un período de tiempo de 5 minutos, aunque se realiza un análisis de múltiples períodos de tiem
Otros productos de este autor
Reverse Bar
Alexey Topounov
The Reverse Bar indicator paints the reversal bars according to trade strategy, described by Bill Williams in "Trading Chaos. Maximize Profits with Proven Technical Techniques" book. The bearish reversal bar has red or pink color (red-stronger signal) The bullish reversal bar has blue or light blue color(blue - stronger signal) It is recommended to use it on hourly timeframe (H1) and higher.
Pin Bar
Alexey Topounov
5 (1)
This indicator shows Pin Bar candlestick pattern on the chart. The bearish pin bars have red color, the bullish pin bars have blue color. The indicator shows alert when Pin Bar candlestick pattern is formed. It's recommended to use it at timeframes H1 and higher. The best moment (strong signal) is when Pin Bar is formed close to the support/resistance level.
The indicator displays the "Morning star" and "Evening star" patterns on a chart. The Evening star is displayed in red or rose. The Morning star is displayed in blue or light blue. Input Parameters: Max Bars – number of bars calculated on the chart. Make Signal Alert – use alerts. Send Push Notification - send notification to a mobile terminal Type of rules pattern – type of the model of pattern determination (Hard – with the control of length of shadows of the second bar). If Soft is selected
HL D1 Move
Alexey Topounov
The indicator displays the dynamics of forming the daily range in the form of a histogram, and the average daily range for a specified period. The indicator is a useful auxiliary tool for intraday trades. Settings N Day - period for calculation of the daily range value. Level Indefinite - level of indefiniteness. Level Confidence - level of confidence. Level Alert - alert level. When it is crossed, the alert appears.
Angulation
Alexey Topounov
According to Bill Williams' trading strategy described in the book "Trading Chaos: Maximize Profits with Proven Technical Techniques" the indicator displays the following items in a price chart: 1.Bearish and bullish divergent bars: Bearish divergent bar is colored in red or pink (red is a stronger signal). Bullish divergent bar is colored in blue or light blue color (blue is a stronger signal). 2. "Angulation" formation with deviation speed evaluation. 3. The level for placing a pending order (
Synthetic Reverse Bar
Alexey Topounov
5 (1)
Synthetic Reverse Bar is an evolution of Reverse Bar indicator. It is well-known that candlestick patterns work best at higher timeframes (H1, H4). However, candlesticks at such timeframes may form differently at different brokers due to dissimilarities in the terminal time on the single symbol, while the history of quotes on M1 and M5 remains the same! As a result, successful patterns are often not formed at higher timeframes! Synthetic Reverse Bar solves that problem! The indicator works on M5
Bullish Bearish Volume is an indicator that divides the volume into the bearish and the bullish part according to VSA: Bullish volume is a volume growing during upward motion and a volume falling during downward motion. Bearish volume is a volume growing during downward motion and a volume falling during upward motion. For a higher obviousness it uses smoothing using MA of a small period. Settings: MaxBars – number of bars calculated on the chart; Method – smoothing mode (Simple is most preferab
Trading Sessions Pro is a trading session indicator with extended settings + the ability to install and display the custom period. Main Advantages: The indicator allows you to conveniently manage display of trading sessions on the chart. There is no need to enter the settings each time. Just click the necessary trading session in the lower window and it is highlighted by the rectangle on the chart! The indicator has two modes of defining the trading terminal's time offset relative to UTC (GMT).
VWAP es el precio promedio ponderado del volumen. Se calcula como suma de productos de volumen y precio dividido por el volumen total. Esta versión del indicador es universal ya que tiene tres modos de funcionamiento: Moving - en este modo el indicador es una media móvil. Pero a diferencia de la ordinaria SMA tiene intervalos más pequeños durante los movimientos de grandes! Pueden utilizarse bandas de desviación cuadrada de la misma manera que las Bandas de Bollinger. Período - en este modo los
Divergence MACD indicator shows price and MACD indicator divergence. The indicator is not redrawn! The algorithm for detection of price and MACD extremums has been balanced for the earliest entry allowing you to use the smallest SL order possible. The indicator displays all types of divergences including the hidden one, while having the minimum number of settings. Find out more about the divergence types in Comments tab. Launch settings: Max Bars - number of bars calculated on the chart. Indent
Вертикальная гистограмма объема -  отображает распределение объема по уровням. Гистограмма рассчитывается от объема ( реального или тикового), при этом объем соответствующий бару переносится на уровень H-L бара. Таким образом, при распределении объема за сутки по вертикали - формируются максимумы гистограммы показывающие области проторговки. Настройки индикатора: Timeframe Set -  период в пределах которого производится расчет. (рекомендуется D1) Step's - количество отображаемых периодов. Amplitu
Hurst Fractal Index Фрактальный Индекс Херста -  показатель персистентности временного ряда При значении индикатора >0.5 временной ряд считается персистентным (тенденция сохраняется) При значениях индикатора явно < 0.5 временной ряд считается антиперсистентным (возможна смена направления движения) Для наглядности значения индекса усредняются периодом 2-3. Настройки индикатора: Max Bars -  глубина истории расчета (кол-во баров на графике для которых произведён расчет) Data from Timeframe - исполь
Filtro:
eugene.nz
411
eugene.nz 2024.06.30 21:21 
 

It is good indicator and very useful. Thank you

Morteza Ghiasi
516
Morteza Ghiasi 2023.08.04 18:25 
 

El usuario no ha dejado ningún comentario para su valoración

Respuesta al comentario
Versión 1.31 2023.08.04
Передача сигналов Buy и Sell осуществляется через два буфера.
Через буфер №5 передается Buy
Через буфер №6 передается Sell
Versión 1.3 2023.08.02
Добавлен дополнительный буфер для возможности передачи сигналов в эксперт или другой индикатор через iCustom (буфер 5)
CopyBuffer(Custom_handl,5,1,Copy_Bars,InArray)
Значение 1 - соответствует сигналу Buy
Значение -1 - соответствует сигналу Sell
Значение 0 - отсутствие сигнала.
Versión 1.2 2021.11.30
Перекомпиляция в новой версии терминала