• Información general
  • Comentarios (8)
  • Discusión
  • Novedades

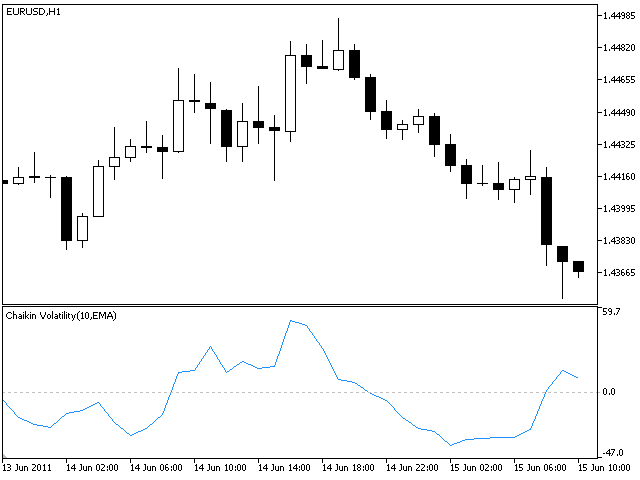
Chaikin Volatility Indicator

4.43

El indicador de volatilidad de Chaikin (Chaikin Volatility, CHV) calcula el cambio del spread entre el precio máximo y mínimo.

Calcula el valor de la volatilidad basándose en el ancho del rango entre el máximo y el mínimo. Pero a diferencia del Average True Range, el indicador de Chaikin no toma en cuenta las brechas (gaps).

Según la interpretación de Chaikin, el crecimiento del indicador de volatilidad en un plazo de tiempo relativamente corto indica en que los precios se acercan a la base (por ejemplo, cuando las acciones se venden con pánica), mientras que la caída de la volatilidad durante un plazo más largo significa que el pico está cerca (por ejemplo, en las condiciones del mercado alcista maduro).

Productos recomendados
Este innovador indicador de medición de la fuerza de la moneda de INFINITY es un ayudante indispensable para los revendedores y comerciantes que negocian en el largo plazo. El sistema de Análisis de fortaleza / debilidad de las monedas ha sido conocido y utilizado en el mercado por los principales operadores del mundo. Cualquier comercio de arbitraje no está completo sin este análisis. Nuestro indicador determina fácilmente la fuerza de las monedas subyacentes entre sí. Muestra gráficos de líne
FREE
BoxInside MT5
Evgeny Shevtsov
5 (4)
This indicator calculates the volume profile and places labels that correspond to the VAH, VAL and POC levels, for each candle individually. Indicator operation features The indicator works on the timeframes from M3 to MN, but it uses the history data of smaller periods: M1 - for periods from M3 to H1, M5 - for periods from H2 to H12, M30 - for the D1 period, H4 - for the W1 period, D1 - for the MN period. The color and location of the VAL, VAH and POC labels on the current candle are consider
FREE
Value Chart Candlesticks
Flavio Javier Jarabeck
4.7 (10)
The idea of a Value Chart indicator was presented in the very good book I read back in 2020 , " Dynamic Trading Indicators: Winning with Value Charts and Price Action Profile ", from the authors Mark Helweg and David Stendahl. The idea is simple and the result is pure genius: Present candlestick Price analysis in a detrended way! HOW TO READ THIS INDICATOR Look for Overbought and Oversold levels. Of course, you will need to test the settings a lot to find the "correct" one for your approach.
FREE
AvgVolumes
Marco Montemari
5 (2)
This indicator is based on Volumes standard indicator, calculates the average of Volumes based on the last N bars set by users, and if the value of the volume is bigger then a set % respect the average a different color will be used. The indicator is shown in a separate indicator window. This version has now a limitation in setting the % about the threshold. If you are interested to set threshold consider to buy the PRO version ( https://www.mql5.com/en/market/product/35925 ) If you want to use
FREE
Dual RSI
Paul Conrad Carlson
Indicator alerts for Dual Relative strength index rsi. Large rsi preset at 14 is below 30 small rsi preset at 4 is below 10 for buy bullish signals . Large rsi preset are 14 is above 70 small rsi preset at 4 is above 90 for sell bearish signals . Includes mobile and terminal alerts. draws lines when alerts. This indicator can help identify extremes and then the tops or bottoms of those extremes .
FREE
Indicators are professional data statistics, position orders, historical order analysis->>>>>> <This version is in Chinese -> English version please move> Necessary for traders: tools and indicators Waves automatically calculate indicators, channel trend trading Perfect trend-wave automatic calculation channel calculation , MT4 Perfect trend-wave automatic calculation channel calculation , MT5 Local Trading copying Easy And Fast Copy , MT4 Easy And Fast Copy , MT5 Local Trading copying For DE
FREE
Original MACD
Kirill Paskhin
5 (4)
Moving Average Convergence/Divergence — схождение/расхождение скользящих средних — технический индикатор, разработанный Джеральдом Аппелем (Gerald Appel), используемый в техническом анализе для проверки силы и направления тренда, а также определения разворотных точек. Встроенный в MetaTrader 5 индикатор MACD не соответствует задумке автора (Gerald Appel): -линия MACD графически изображена в виде гистограммы, однако гистограммой отражается разница между линией MACD и сигнальной линией;  -сигнал
FREE
Follow The Line MT5
Oliver Gideon Amofa Appiah
4.42 (31)
This indicator obeys the popular maxim that: "THE TREND IS YOUR FRIEND" It paints a GREEN line for BUY and also paints a RED line for SELL. (you can change the colors). It gives alarms and alerts of all kinds. IT DOES NOT REPAINT and can be used for all currency pairs and timeframes. Yes, as easy and simple as that. Even a newbie can use it to make great and reliable trades. NB: For best results, get my other premium indicators for more powerful and reliable signals. Get them here: https://www.m
FREE
Zona de Consolidacao
Edilson Domingos
5 (1)
It makes it easier to see where there have been consolidation zones for previous prices and allows you to highlight the histogram where there is the biggest consolidation zone. Input parameters Intervalo de preço Is the price between the histograms Periodo Number of candle sticks to be analyzed Porcentagem Highlights the histogram where there is minimal consolidation in relation to the analyzed period
FREE
Price Momentum
Flavio Javier Jarabeck
4.92 (13)
Value Chart indicator presents the Price evolution in a new form. This indicator, Price Momentum , was developed taking all the calculations presented in the book " Dynamic Trading Indicators " by Mark W. Helweg and David Stendahl (2002). The technique involves de-trended Prices from a user-defined Period of analysis and the addition of a Volatility index correction. The result is an Oscillator with 3 zones: Fair Price Value, Overbought/Oversold and Extremely Overbought/Oversold zones. Adding th
FREE
El Panel de Marco de Tiempo Múltiple de Indicador de Flecha de Matriz MT5 es un complemento gratuito y un gran activo para su Indicador de Flecha de Matriz MT5 . Muestra la señal MT5 del Indicador de Flecha de Matriz actual para 5 marcos de tiempo personalizados por el usuario y para 16 símbolos / instrumentos modificables en total. El usuario tiene la opción de habilitar / deshabilitar cualquiera de los 10 indicadores estándar de los que consta el Matrix Arrow Indicator MT5 . Los 10 atributos
FREE
LT Weis Waves
Thiago Duarte
5 (11)
The Weis Wave first takes the market volume and then organizes it with the price into Wave charts. It is the only software that will present the true picture of the market before you. If anyone of you, has watched an intraday price movement then you must know that it unfolds in a series of selling as well as buying waves-a procedures tearing down and building up. Wave analysis is an integral part of the trading method. The indicator helps to deal with today’s volatile market. Moreover, it works
FREE
PZ The Zone MT5
PZ TRADING SLU
5 (1)
This indicator displays buy or sell signals according to Bill Williams' definition of the Trading Zone. [ Installation Guide | Update Guide | Troubleshooting | FAQ | All Products ] Easy to use and understand Avoid trading flat markets Deterministic indicator with clear rules The indicator is non-repainting It implements alerts of all kinds It has straightforward trading implications. A blue arrow is a buy signal A red arrow is a sell signal According to Bill Williams trading in the zone helps t
FREE
Laguerre Filter
Fernando Lahude Ritter
5 (1)
Laguerre Indicator with Gamma Input Overview: The Laguerre Indicator is a sophisticated financial analysis tool designed to provide traders and investors with a dynamic and responsive method to track market trends. Its core functionality is centered around a unique algorithm that adapts to market volatility, offering clearer insights compared to traditional indicators. Key Feature - Gamma Input: Gamma: The sole input for the Laguerre Indicator, 'gamma,' plays a pivotal role in calibrating the i
FREE
Tick Bars
Henrique Helmuth Kreutz Pfeifer
Indicator that show candlestick bars with an different sampling method than time fixed. Real time data is sourced to the indicator and it may be used as substitute of the default graph. Each bar is formed when a predefined amount of ticks is received, showing in the graph the OHLC of this clusteri of ticks. The input variable is the amount of ticks of each bar. It's a different approach of sampling, the amount of bars is proportional to the amount of negotiations insted of a sample in a fixed am
FREE
FractalEfficiencyIndicator   A ratio between 0 and 1 with the higher values representing a more efficient or trending market,  It is used in the calculation of Perry J. Kaufman Adaptive Moving Average (KAMA), dividing the price change over a period by the absolute sum of the price movements that occurred to achieve that change. The Fractal Efficiency or also known as Efficiency Ratio was first published by Perry J. Kaufman in his book   ‘Smarter Trading‘. This is mostly considered a filter for v
FREE
Aggression Volume
Flavio Javier Jarabeck
3.91 (22)
Aggression Volume Indicator is the kind of indicator that is rarely found in the MQL5 community because it is not based on the standard Volume data provided by the Metatrader 5 platform. It requires the scrutiny of all traffic Ticks requested on the platform... That said, Aggression Volume indicator requests all Tick Data from your Broker and processes it to build a very special version of a Volume Indicator, where Buyers and Sellers aggressions are plotted in a form of Histogram. Additionally,
FREE
Cumulative Delta MT5
Evgeny Shevtsov
4.48 (61)
The indicator analyzes the volume scale and splits it into two components - seller volumes and buyer volumes, and also calculates the delta and cumulative delta. The indicator does not flicker or redraw, its calculation and plotting are performed fairly quickly, while using the data from the smaller (relative to the current) periods. The indicator operation modes can be switched using the Mode input variable: Buy - display only the buyer volumes. Sell - display only the seller volumes. BuySell -
FREE
Smart Depth Of Market
Evgeny Shevtsov
4.2 (20)
The indicator displays the orders book, as well as increases its depth, remembering the location of orders that have gone beyond the current "window" view. Indicator capability Display the levels of open positions. Simulation of placing/cancelling/editing pending orders directly in the displayed orders book. Indicator features The orders book display works only on those trading symbols for which it is broadcast by the broker. To reset the information about the rows that were recorded in the
FREE
SSACD - Singular Spectrum Average Convergence/Divergence This is an analogue of the MACD indicator based on the Caterpillar-SSA ( Singular Spectrum Analysis ) method. Limited version of the SSACD Forecast indicator. Limitations include the set of parameters and their range. Specificity of the method The Caterpillar-SSA is an effective method to handle non-stationary time series with unknown internal structure. The method allows to find the previously unknown periodicities of the series and mak
FREE
MACD Colored ZeroLag
Farzin Sadeghi Bonjar
4.14 (7)
It is the MQL5 version of zero lag MACD that was available for MT4 here: https://www.mql5.com/en/code/9993 Also there was a colored version of it here but it had some problems: https://www.mql5.com/en/code/8703 I fixed the MT4 version which has 95 lines of code. It took me 5 days to write the MT5 version.(reading the logs and testing multiple times and finding out the difference of MT5 and MT4!) My first MQL5 version of this indicator had 400 lines of code but I optimized my own code again and n
FREE
Mitimom
Danil Poletavkin
The indicator is based on Robert Miner's methodology described in his book "High probability trading strategies" and displays signals along with momentum of 2 timeframes. A Stochastic oscillator is used as a momentum indicator. The settings speak for themselves period_1 is the current timeframe, 'current' period_2 is indicated - the senior timeframe is 4 or 5 times larger than the current one. For example, if the current one is 5 minutes, then the older one will be 20 minutes The rest of the
FREE
The indicator looks for consolidation (flat) in the market at a certain time, builds a box-channel and marks levels indented from it for a breakdawn. After crossing one of the levels, the indicator marks the zone for take profit and calculates the corresponding profit or loss in the direction of this entry on the panel. Thus, the indicator, adjusting to the market, finds a flat area of the market, with the beginning of a trend movement to enter it. Version for MT4: https://www.mql5.com/en/market
FREE
OsMA DA
Vitaly Dodonov
Что такое OsMA DA?   Индикатор OsMA DA – это осциллятор, который построен на показаниях другого осциллятора – MACD. OsMA DA показывает расхождение между сигнальной линией MACD и его гистограммой. Момент пересечения гистограммы и линии – это нулевая отметка OsMA.   Если гистограмма MACD поднимается выше линии, то гистограмма самого OsMA DA поднимается выше нулевой отметки. В обратной ситуации OsMA DA демонстрирует отрицательные значения.   OsMA DA более узконаправленный индикатор, чем MACD. OsMA
FREE
MACD with Histogram Color Change
Tiago Azevedo Amorim Martins
This Indicator works as a momentum oscillator however it is most used to surf the trends. Despite of being an oscillator, MACD (Moving Average Convergence/Divergence) doesn't work with over limit conditions (such as OverBought or OverSold). Graphically it's shown as two lines and an histogram with the diference of them. Standard metatrader has this indicator, however with only the two lines and without the histogram. This way it is much easier to read and uderstand it.
FREE
El estrategia de trading Moving Average Convergence Divergence (MACD) es una herramienta popular de análisis técnico que se utiliza para identificar cambios en el impulso y la dirección de la tendencia. El MACD se calcula restando la media móvil exponencial (EMA) de 26 períodos de la EMA de 12 períodos. Luego se traza una EMA de 9 períodos, llamada "línea de señal", sobre el MACD para actuar como un disparador de señales de compra y venta. El MACD se considera en territorio alcista cuando la lín
FREE
Donchian Pro
Paulo Henrique Faquineli Garcia
5 (2)
The Donchian Channel Channels are among the most popular tools of technical analysis, as they visually convey to the analyst the limits within which most price movement tends to occur. Channel users know that valuable information can be obtained at any time, whether prices are in the central region of a band or close to one of the border lines. One of the best known techniques to explore these concepts is Bollinger Bands. However, John Bollinger was not the only one to research the applicatio
FREE
Curver Arrows
Francis Dube
4 (9)
Es un indicador muy bien conocido. Ha sido portado directamente desde la versión para MetaTrader 4 que está disponible libremente en Internet. No se redibuja en absoluto. El indicador implementa la estrategia de la ruptura. Las flechas indican la dirección del mercado. Utilice este indicador en los períodos de M15 y superiores.
FREE
This indicator sums up the difference between the sells aggression and the buys aggression that occurred in each Candle, graphically plotting the waves of accumulation of the aggression volumes.   Through these waves an exponential average is calculated that indicates the direction of the business flow. Note: This indicator DOES NOT WORK for Brokers and/or Markets WITHOUT the type of aggression (BUY or SELL).   Be sure to try our Professional version with configurable features and alerts:  Agr
FREE
FRB Support and Resistance
Fernando Baratieri
5 (2)
FRB Trader - Our mission is to provide the best support to customers through conted and tools so that they can achieve the expected results FRB Support and Resistance - Indicator places lines on the chart to show Support and Resistance regions. - You can choose the timeframe you want to calculate, as well as the colors of the lines. - Algorithm calculates the points where the strengths of the asset are considered and are extremely important for decision making.
FREE
Los compradores de este producto también adquieren
Atomic Analyst MT5
Issam Kassas
4.78 (18)
En primer lugar, vale la pena enfatizar que este Indicador de Trading no repinta, no redibuja y no se retrasa, lo que lo hace ideal tanto para el trading manual como para el automatizado. Manual del usuario: configuraciones, entradas y estrategia. El Analista Atómico es un Indicador de Acción del Precio PA que utiliza la fuerza y el impulso del precio para encontrar una mejor ventaja en el mercado. Equipado con filtros avanzados que ayudan a eliminar ruidos y señales falsas, y aumentan el poten
Gold Stuff mt5
Vasiliy Strukov
4.9 (182)
Gold Stuff mt5: un indicador de tendencia diseñado específicamente para el oro, también se puede usar en cualquier instrumento financiero. El indicador no se vuelve a dibujar ni se retrasa. El marco de tiempo recomendado es H1. IMPORTANTE! Póngase en contacto conmigo inmediatamente después de la compra para obtener instrucciones y bonificación!   Puede obtener una copia gratuita de nuestro indicador Strong Support y Trend Scanner, por favor envíe un mensaje privado. ¡a mí! PARÁMETROS Draw
Primero que todo, vale la pena enfatizar que este Sistema de Trading es un Indicador No Repintado, No Redibujado y No Retrasado, lo que lo hace ideal tanto para el trading manual como para el automatizado. Curso en línea, manual y descarga de ajustes preestablecidos. El "Sistema de Trading Inteligente MT5" es una solución completa de trading diseñada para traders nuevos y experimentados. Combina más de 10 indicadores premium y presenta más de 7 estrategias de trading robustas, lo que lo convie
Quantum Trend Sniper
Bogdan Ion Puscasu
4.92 (48)
Introduciendo       Indicador Quantum Trend Sniper   , el innovador indicador MQL5 que está transformando la forma en que identificas y negocias los cambios de tendencia. Desarrollado por un equipo de comerciantes experimentados con experiencia comercial de más de 13 años,       Indicador de francotirador de tendencia cuántica       está diseñado para impulsar su viaje comercial a nuevas alturas con su forma innovadora de identificar cambios de tendencia con una precisión extremadamente alta.
TPSproTREND PrO MT5
Roman Podpora
4.89 (9)
TPSpro TRENDPRO  - is a trend indicator that automatically analyzes the market and provides information about the trend and each of its changes, as well as giving signals for entering trades without redrawing! The indicator uses each candle, analyzing them separately. referring to different impulses - up or down impulse. Exact entry points into transactions for currencies, crypto, metals, stocks, indices!  -  Version MT4               DETAILED DESCRIPTION               R ecommended to use with
Trend Screener Pro MT5
STE S.S.COMPANY
4.88 (66)
Desbloquee el poder del comercio de tendencias con el indicador Trend Screener: ¡su solución definitiva para el comercio de tendencias impulsada por lógica difusa y un sistema multidivisa!Mejore su comercio de tendencias con Trend Screener, el revolucionario indicador de tendencias impulsado por lógica difusa. Es un poderoso indicador de seguimiento de tendencias que combina más de 13 herramientas y funciones premium y 3 estrategias comerciales, lo que lo convierte en una opción versátil para co
Este es un genial indicador para MT5 que ofrece señales precisas para entrar en una transacción sin redibujar. Se puede aplicar a cualquier activo financiero: fórex, criptomonedas, metales, acciones, índices. Nos dará valoraciones bastante precisas y nos dirá cuándo es mejor abrir y cerra una transacción. Eche un vistazo  al vídeo  (6:22), ¡contiene un ejemplo de procesamiento de una sola señal que ha amortizado el indicador! La mayoría de los tráders mejoran sus resultados comerciales durante l
Ante todo, vale la pena enfatizar que esta Herramienta de Trading es un Indicador No Repintado, No Redibujado y No Retrasado, lo que la hace ideal para el trading profesional. Curso en línea, manual del usuario y demostración. El Indicador de Conceptos de Acción del Precio Inteligente es una herramienta muy potente tanto para traders nuevos como experimentados. Combina más de 20 indicadores útiles en uno solo, combinando ideas avanzadas de trading como el Análisis del Trader del Círculo Inte
FX Volume MT5
Daniel Stein
4.94 (17)
Obtenga su actualización diaria del mercado con detalles y capturas de pantalla a través de nuestro Morning Briefing aquí en mql5 y en Telegram ! FX Volume es el PRIMER y ÚNICO indicador de volumen que proporciona una visión REAL del sentimiento del mercado desde el punto de vista de un bróker. Proporciona una visión impresionante de cómo los participantes institucionales del mercado, como los brokers, están posicionados en el mercado Forex, mucho más rápido que los informes COT. Ver esta info
FX Power MT5 NG
Daniel Stein
5 (6)
Obtenga su actualización diaria del mercado con detalles y capturas de pantalla a través de nuestro Morning Briefing aquí en mql5 y en Telegram ! FX Power MT5 NG es la nueva generación de nuestro popular medidor de fuerza de divisas, FX Power. ¿Y qué ofrece este medidor de fuerza de nueva generación? Todo lo que le encantaba del FX Power original PLUS Análisis de fuerza de ORO/XAU Resultados de cálculo aún más precisos Períodos de análisis configurables individualmente Límite de cálculo persona
Este tablero muestra los últimos   patrones armónicos   disponibles para los símbolos seleccionados, por lo que ahorrará tiempo y será más eficiente /   versión MT4 . Indicador gratuito:   Basic Harmonic Pattern Columnas del indicador Symbol:   aparecerán los símbolos seleccionados Trend :   alcista o bajista Pattern :   tipo de patrón (gartley, mariposa, murciélago, cangrejo, tiburón, cifrado o ABCD) Entry :   precio de entrada SL:   precio de stop loss TP1:   1er precio de toma de benefici
Reversal First Impulse levels (RFI)      INSTRUCTIONS        RUS       -       ENG              R ecommended to use with an indicator   -   TPSpro  TREND PRO -  Version MT4                 A key element in trading is zones or levels from which decisions to buy or sell a trading instrument are made. Despite attempts by major players to conceal their presence in the market, they inevitably leave traces. Our task was to learn how to identify these traces and interpret them correctly. Main functi
AT Forex Indicator MT5
Marzena Maria Szmit
5 (4)
The AT Forex Indicator MT5 is a sophisticated trading tool designed to provide traders with a comprehensive analysis of multiple currency pairs. This powerful indicator simplifies the complex nature of the forex market, making it accessible for both novice and experienced traders. AT Forex Indicator uses advanced algorithms to detect trends, patterns and is an essential tool for traders aiming to enhance their forex trading performance. With its robust features, ease of use, and reliable signal
Introduciendo       Quantum Breakout PRO   , el innovador indicador MQL5 que está transformando la forma en que comercia con Breakout Zones. Desarrollado por un equipo de comerciantes experimentados con experiencia comercial de más de 13 años,       Desglose cuántico PRO       está diseñado para impulsar su viaje comercial a nuevas alturas con su innovadora y dinámica estrategia de zona de ruptura. El indicador de ruptura cuántica le dará flechas de señal en las zonas de ruptura con 5 zonas
IX Power MT5
Daniel Stein
4.2 (5)
IX Power   lleva por fin la insuperable precisión de FX Power a los símbolos que no son de Forex. Determina con exactitud la intensidad de las tendencias a corto, medio y largo plazo de tus índices, acciones, materias primas, ETF e incluso criptodivisas favoritas. Puede   analizar todo lo   que su terminal le ofrece. Pruébalo y experimenta cómo   tu timing mejora significativamente   a la hora de operar. Características principales de IX Power Resultados de cálculo 100% precisos y sin rep
Matrix Arrow Indicator MT5
Juvenille Emperor Limited
5 (14)
Matrix Arrow Indicator MT5   es una tendencia única 10 en 1 que sigue un indicador   100% sin repintado   de marcos temporales múltiples que se puede usar en todos los símbolos/instrumentos:   divisas ,   materias primas ,   criptomonedas ,   índices ,   acciones .  Matrix Arrow Indicator MT5  determinará la tendencia actual en sus primeras etapas, recopilando información y datos de hasta 10 indicadores estándar, que son: Índice de movimiento direccional promedio (ADX) Índice de canales de prod
El indicador muestra los puntos de entrada y salida más adecuados. También muestra datos estadísticos sobre todas las señales para un mejor análisis de las operaciones. Con la ayuda de este indicador podrá comprender mejor el mercado. Tan pronto como la fuerza de la tendencia comience a debilitarse (esto se mostrará en el panel), la línea de tendencia gravitará hacia la posición horizontal - esta es la señal para salir de la operación. O puede salir cuando se alcance el nivel de beneficio me
PZ Day Trading MT5
PZ TRADING SLU
2.83 (6)
Este indicador detecta reversiones de precios en forma de zig-zag, utilizando solo análisis de acción de precios y un canal donchian. Ha sido diseñado específicamente para el comercio a corto plazo, sin repintar ni pintar en absoluto. Es una herramienta fantástica para comerciantes astutos con el objetivo de aumentar el tiempo de sus operaciones. [ Guía de instalación | Guía de actualización | Solución de problemas | FAQ | Todos los productos ] Increíblemente fácil de comerciar Proporciona
PZ Trend Trading MT5
PZ TRADING SLU
3.67 (3)
Trend Trading es un indicador diseñado para sacar el máximo provecho posible de las tendencias que tienen lugar en el mercado, mediante el cronometraje de retrocesos y rupturas. Encuentra oportunidades comerciales al analizar qué está haciendo el precio durante las tendencias establecidas. [ Guía de instalación | Guía de actualización | Solución de problemas | FAQ | Todos los productos ] Opere en los mercados financieros con confianza y eficiencia Aproveche las tendencias establecidas sin s
Este panel descubre y muestra las zonas de   Oferta   y   Demanda   en el gráfico, tanto en modo scalping como a largo plazo, dependiendo de su estrategia de trading para los símbolos seleccionados. Además, el modo de escáner del tablero le ayuda a comprobar todos los símbolos deseados de un vistazo y no perder ninguna posición adecuada /   Versión MT4 Indicador gratuito:   Basic Supply Demand Características Le permite ver las oportunidades de negociación en   múltiples pares de divisa
Blahtech Supply Demand MT5
Blahtech Limited
4.54 (13)
Was: $299  Now: $99   Supply Demand uses previous price action to identify potential imbalances between buyers and sellers. The key is to identify the better odds zones, not just the untouched ones. Blahtech Supply Demand indicator delivers functionality previously unavailable on any trading platform. This 4-in-1 indicator not only highlights the higher probability zones using a multi-criteria strength engine, but also combines it with multi-timeframe trend analysis, previously confirmed swings
Auto Order Block with break of structure based on ICT and Smart Money Concepts (SMC) Futures Break of Structure ( BoS )             Order block ( OB )            Higher time frame Order block / Point of Interest ( POI )    shown on current chart           Fair value Gap ( FVG ) / Imbalance   -  MTF      ( Multi Time Frame )    HH/LL/HL/LH  -  MTF      ( Multi Time Frame )  Choch  MTF      ( Multi Time Frame )  Volume Imbalance     ,  MTF          vIMB Gap’s Power of 3 Equal High
ICT, SMC, SMART MONEY CONCEPTS, SMART MONEY, Smart Money Concept, Support and Resistance, Trend Analysis, Price Action, Market Structure, Order Blocks, BOS/CHoCH,   Breaker Blocks ,  Momentum Shift,   Supply&Demand Zone/Order Blocks , Strong Imbalance,   HH/LL/HL/LH,    Fair Value Gap, FVG,  Premium  &   Discount   Zones, Fibonacci Retracement, OTE, Buy Side Liquidity, Sell Side Liquidity, BSL/SSL Taken, Equal Highs & Lows, MTF Dashboard, Multiple Time Frame, BigBar, HTF OB, HTF Market Structure
Easy By Sell is a market indicator for opening and closing positions. It becomes easy to track market entries with alerts. It indicates trend reversal points when a price reaches extreme values ​​and the most favorable time to enter the market. it is as effective as a Fibonacci to find a level but it uses different tools such as an algorithm based on ATR indicators and Stochastic Oscillator. You can modify these two parameters as you wish to adapt the settings to the desired period. My othe
Dark Absolute Trend   is an Indicator for intraday trading. This Indicator is based on   Trend Following  strategy but use also candlestick patterns and Volatility. We can enter in good price with this Indicator, in order to follow the main trend on the current instrument. It is advised to use low spread ECN brokers. This Indicator does   Not repaint   and   N ot lag . Recommended timeframes are M5, M15 and H1. Recommended working pairs: All. I nstallation and  Update Guide   -  Troubleshooting
Próxima generación de zonas de oferta y demanda automatizadas. Algoritmo nuevo e innovador que funciona en cualquier gráfico. Todas las zonas se crean dinámicamente de acuerdo con la acción del precio del mercado. DOS TIPOS DE ALERTAS --> 1)CUANDO EL PRECIO LLEGA A UNA ZONA 2)CUANDO SE FORMA UNA NUEVA ZONA No obtienes un indicador inútil más. Obtiene una estrategia comercial completa con resultados probados.     Nuevas características:     Alertas cuando el precio llega a la z
Was: $249  Now: $99   Market Profile defines a number of day types that can help the trader to determine market behaviour. A key feature is the Value Area, representing the range of price action where 70% of trading took place. Understanding the Value Area can give traders valuable insight into market direction and establish the higher odds trade. It is an excellent addition to any system you may be using. Inspired by Jim Dalton’s book “Mind Over Markets”, this indicator is designed to suit the
Conviértase en un Breaker Trader y obtenga beneficios de los cambios en la estructura del mercado a medida que se invierte el precio. El indicador de ruptura de bloque de órdenes identifica cuándo una tendencia o movimiento de precio se acerca al agotamiento y está listo para revertirse. Le alerta sobre cambios en la estructura del mercado que generalmente ocurren cuando una reversión o un retroceso importante están a punto de suceder. El indicador utiliza un cálculo patentado que identific
[ MT4 Version ] Only the next 10 units at current price! Final price: $299 Are you tired of spending months on demo or live accounts to test your trading strategies? The Backtesting Simulator is the ultimate tool designed to elevate your backtesting experience to new heights. Utilizing Metatrader historical symbol information, it offers an unparalleled simulation of real market conditions. Take control of your testing speed, test ideas quickly or at a slower pace, and witness remarkable improve
Volume by Price MT5
Brian Collard
3.6 (5)
The Volumebyprice.com Indicator for MetaTrader 5 features Volume Profile and Market Profile TPO (Time Price Opportunity). Volume and TPO histogram bar and line charts. Volume Footprint charts. TPO letter and block marker collapsed and split structure charts. Static, dynamic and flexible range segmentation and compositing methods with relative and absolute visualizations. Session hours filtering and segment concatenation with Market Watch and custom user specifications. Graphical layering, posit
Otros productos de este autor
Three Moving Averages
MetaQuotes Ltd.
3.37 (35)
El Asesor Experto tradea usando la estrategia de tendencia basada en la ubicación mutua de tres medias móviles. La determinación de la tendencia se realiza mediante el análisis de la ubicación mutua de la media móvil exponencial rápida (FastEMA), media (MediumEMA) y lenta (Slow EMA): Compra: FastEMA>MediumEMA>SlowEMA (tendencia arriba). Venta: FastEMA<MediumEMA<SlowEMA (tendencia abajo). Parámetros: Inp_Signal_ThreeEMA_FastPeriod = 8; Inp_Signal_ThreeEMA_MediumPeriod = 38; Inp_Signal_ThreeEMA_Sl
FREE
La esencia del sistema consiste en la identificación del momento de formación de la vela compuesta "de vuelta" con características determinadas (tamaño de la vela en puntos, estructura de sombras).En el análisis de las velas japonesas el análogo de estas velas de vuelta son "Martillo" (Hammer) y "Hombre colgado" (Hanging Man), pero en este sistema el cuerpo de la vela no tiene que ser obligatoriamente pequeño, y la vela resultante se construye de varias velas. Parámetros de entrada del sistema:
FREE
MA Crossover ADX
MetaQuotes Ltd.
3.72 (18)
El Asesor Experto tradea usando la estrategia de tendencia basada en el cruzamiento del precio con la media móvil con la confirmación a través del indicador ADX. Generalidades de la estrategia: Compra: el precio de cierre de la barra terminada es superior a la media móvil; además, la media móvil crece en la barra anterior y actual. Venta: el precio de cierre de la barra terminada es inferior a la media móvil; además, la media móvil decrece en la barra anterior y actual. Está implementada complem
FREE
Expert Alligator
MetaQuotes Ltd.
3.62 (13)
La estrategia está basada en la intersección de las líneas del indicador técnico Alligator descrito en el libro B. Williams titulado "Trading chaos". Este sistema representa la combinación de tres medias móviles desplazadas (líneas Lips, Teeth y Jaw) y osciladores construidos sobre su base. Las líneas del indicador Alligator generan la señal para abrir la posición cuando se cruzan en un punto y salen de él colocándose de acuerdo con sus períodos. Cuando el mercado se mueve hacia arriba, la media
FREE
ColorLine Indicator
MetaQuotes Ltd.
3.8 (5)
El indicador ColorLine representa una línea en el gráfico de precio (media móvil). La línea se colorea según 100 barras en tres colores diferentes, además, cada cinco tics cambia el esquema de colores (hay 3 esquemas de colores en total). Indicador para demostrar el estilo DRAW_COLOR_LINE. Dibuja una línea a precios de cierre en piezas de colores de 20 barras. El grosor, el estilo y el color de las secciones de línea se cambian aleatoriamente. El código del indicador se publica en la documentaci
FREE
ColorBars Indicator
MetaQuotes Ltd.
4.4 (5)
The ColorBars Indicator paints bars with different colors depending on the volume changes. If the volume has increased, the color is green, overwise the color is red.
FREE
TradeHistoryParsing
MetaQuotes Ltd.
3.5 (2)
The TradeHistoryParsing is a utility for working with the trade history obtained from the MetaTrader 5 terminal. The product is based on the " RegularExpressions in MQL5 " library. It allows to quickly get the required data on your trading history. The filtering results are displayed as a table, a summary of mathematical statistics is provided below the table. Working with the tool Export the trade report as an html file and place it into the "sandbox". After that, when launching the EA, speci
FREE
ColorCandlesDaily
MetaQuotes Ltd.
4.14 (7)
El indicador ColorCandlesDaily dibuja las velas de diferente color, dependiendo del día de la semana.
FREE
RegularExpressionsExamples — is an expert, which contains the graphical interface for running examples from the " RegularExpressions in MQL5 " library. The codes of these examples can be found in the library itself. These examples are for demonstration purposes only. They serve only to evaluate the library operation and its capabilities. They can also be found on the official Microsoft‎ website, in the descriptions of classes in the System.Text.RegularExpressions namespace. Each example can be
FREE
ObjChartSample
MetaQuotes Ltd.
4.33 (3)
The script ObjChartSample.mql5 illustrates control of chart properties using the classes from the Standard Library .
FREE
DemoBitmapOffset
MetaQuotes Ltd.
3.5 (2)
The script illustrates the usage of the OBJPROP_XOFFSET and OBJPROP_YOFFSET properties. It displays the specified fragment of the .BMP image.
FREE
SphereSample
MetaQuotes Ltd.
3.5 (2)
The script SphereSample.mq5 illustrates control of graphic objects using the classes from the Standard Library (Base class of objects array CArrayObj , CChartObjectText ).
FREE
Filtro:
Wan Ping Fei
1690
Wan Ping Fei 2020.09.21 12:36 
 

El usuario no ha dejado ningún comentario para su valoración

[Eliminado] 2019.01.14 07:27 
 

El usuario no ha dejado ningún comentario para su valoración

Gennadiy Voltornist
11909
Gennadiy Voltornist 2018.01.18 17:14 
 

El usuario no ha dejado ningún comentario para su valoración

Daniel Andrejczuk
5596
Daniel Andrejczuk 2017.11.09 14:03 
 

El usuario no ha dejado ningún comentario para su valoración

Ali irwan
5135
Ali irwan 2017.07.27 12:25 
 

El usuario no ha dejado ningún comentario para su valoración

Rodrigo da Silva Boa
7136
Rodrigo da Silva Boa 2016.03.12 22:19 
 

El usuario no ha dejado ningún comentario para su valoración

Vadim Strelkov
7710
Vadim Strelkov 2014.04.03 14:01 
 

El usuario no ha dejado ningún comentario para su valoración

Alexey Da
4209
Alexey Da 2012.04.26 10:52 
 

El usuario no ha dejado ningún comentario para su valoración

Respuesta al comentario
Versión 1.21 2020.03.31
Скомпилирован в MetaEditor build 2372