• Información general
  • Comentarios (2)
  • Discusión
  • Novedades

OneKey DeleteOrder

I see that many tools in the market deal with Position and Order in the form of operation panels. Which is loaded into a Chart in the form of an EA.

However, once the operator panel EA is loaded, no other EAs can be loaded. So, I wrote the one-click operation of Position and Order as a script, so you can load other EAs and easily complete one-click operation of Trade.

1. What is this:

This is a one-click script to delete the pending order.

Now you can delete pending tickets at high speed, for example 1000 pending tickets can be deleted instantaneously.

2. Function:

There are many ways to filter:
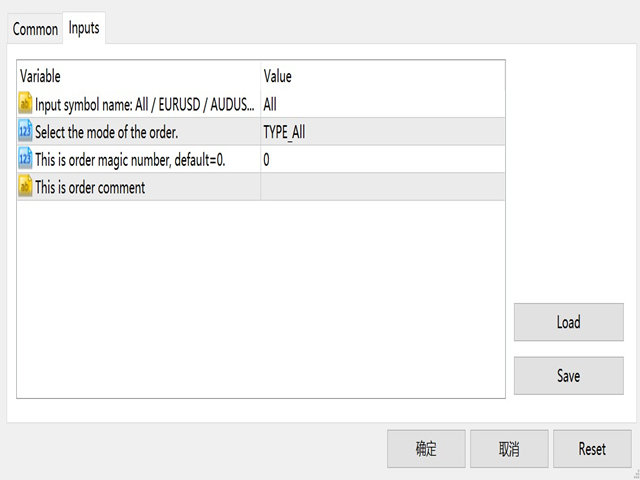
  • You can choose the symbol of the pending order.  Default is All.
  • You can choose the type of pending order, Default is All.
  • You can enter magci number, the default is 0.
  • You can enter comment, the default is "".
3. Parameters:
  • Input string ForexName="All";                            //Input symbol name: All / EURUSD / AUDUSD / ...
  • Input Enum_OrderType Type_Order=TYPE_All;    //Select the mode of the order.
  • Input int MAGICNUM=0;                                     //This is order magic number, default=0.
  • Input string COMMENT="";                                  //This is order comment
  • Input bool HighSpeed=true; //True represents high speed execution
Thanks for using!


Productos recomendados
Manual Assistant MT5
Igor Kotlyarov
4.67 (3)
Bonus when buying an indicator or an advisor from my list. Write to me in private messages to receive a bonus. Manual Assistant MT5 is a professional manual trading tool that will make your trading fast and comfortable. It is equipped with all the necessary functions that will allow you to open, maintain and close orders and positions with one click. It has a simple and intuitive interface and is suitable for both professionals and beginners. The panel allows you to place buy and sell orders
FREE
Bienvenido a HiperCube Renko Candles Este indicador le proporciona información real del mercado y lo transforma al estilo de vela Renko. Definición Los gráficos Renko son un tipo de gráfico financiero que mide y traza los cambios de precios, utilizando ladrillos (o barras) para representar los movimientos de precios. A diferencia de los gráficos de velas tradicionales, los gráficos Renko no muestran información basada en el tiempo, centrándose únicamente en las fluctuaciones de precios. Caracte
FREE
Are you tired of drawing trendlines every time you're analyzing charts? Or perhaps you would like more consistency in your technical analysis. Then this is for you. This indicator will draw trend lines automatically when dropped on a chart. How it works Works similar to standard deviation channel found on mt4 and mt5. It has 2 parameters: 1. Starting Bar 2. Number of bars for calculation The   starting bar   is the bar which drawing of the trend lines will begin, while the   number of bars for c
FREE
Renko Builder GLX1
Eranga Thilina Dhanushka Gallage
GLX1 Renko Builder   Expert Advisor (EA) can create the Renko bar charts on any symbol. The Renko charts are generated as real-time custom symbol charts which can be further used for technical analysis with any MT5 compatible indicator.  Find the free   GLX1 Renko Euro   Expert Advisor from here.  https://www.mql5.com/en/market/product/115074 Included Features: Truly responsive Renko Charting on a custom symbol chart Accurate automatic live chart update Ability to attach any MT5 indicator
Renko Chart
Marcin Konieczny
3.63 (8)
This indicator allows to display Renko charts in the indicator window. Renko charts show only price movements that are bigger than the specified box size. It helps to eliminate noise and allows to focus on main trends. Time is not a factor here. Only price movements are taken into account. That's why Renko chart is not synchronized with the main chart it is attached to. Indicator works in two modes: CLOSE - only close prices are taken into account while building the chart HIGH_LOW - only high/
FREE
Renko Plus
Eadvisors Software Inc.
With Renko Plus you can use the features in the Indicator functionality, just add it to the Metatrader5 chart.             The Renko chart is a type of chart, developed by the Japanese, that is constructed using price movement rather than standardized prices and time intervals like most charts. It is believed to be named after the Japanese word for bricks, "renga", as the graphic looks like a series of bricks.             A new brick is created when the price moves a specified p
FREE Prop Firm Navigator EA - Advanced Trend-Following & Protection Developed by the EA Trading Academy team using Expert Advisor Studio , this free trading robot combines powerful trend-following indicators with a robust set of account protection features to secure your trading capital. You can find a detailed documentation about the properties and inputs on our  knowledge base . Key Strategy Features: Uses ADX and Bulls Power indicators for precise entry signals Sophisticated exit strateg
FREE
El Capturador de Tendencias: La Estrategia del Capturador de Tendencias con Indicador de Alerta es una herramienta versátil de análisis técnico que ayuda a los traders a identificar las tendencias del mercado y los posibles puntos de entrada y salida. Presenta una Estrategia dinámica del Capturador de Tendencias, adaptándose a las condiciones del mercado para una clara representación visual de la dirección de la tendencia. Los traders pueden personalizar los parámetros para que se ajusten a s
FREE
Introducing   Order Blocks Breaker , a brand-new way to identify and leverage order blocks in your trading strategy. After developing multiple order block tools with unique concepts, I’m proud to present this tool that takes things to the next level. Unlike previous tools,   Order Blocks Breaker   not only identifies order blocks but also highlights   Breaker Order Blocks —key areas where the price is likely to retest after a breakout. MT4 -  https://www.mql5.com/en/market/product/124101/ This t
Order Book, known also as Market Book, market depth, Level 2, - is a dynamically updated table with current volumes of orders to buy and to sell specific financial instument at price levels near Bid and Ask. MetaTrader 5 provides the means for receiving market book from your broker, but in real time only, without access to its history. The indicator OrderBook Cumulative Indicator accumulates market book data online and visualizes them on the chart. In addition, the indicator can show the market
Account Info EA It is a tool that presents on the graph all the positions of the account, and specific information concerning the positions, but also the account. It enables the user to have an image of his account at a glance. Use like any expert advisor. You can't attach it in the same chart with other expert advisor. It does not have the ability to open or manage positions. You can attach it on any chart and any timeframe.
FREE
VR Color Levels es una herramienta útil para quienes aplican análisis técnico utilizando elementos como línea de tendencia, rectángulo y texto. Es posible agregar texto directamente al gráfico y tomar capturas de pantalla. Las configuraciones, archivos de configuración, versiones de demostración, instrucciones y resolución de problemas se pueden obtener en [Blog] Puedes leer o escribir reseñas en [enlace] Versión para [MetaTrader 4] El trabajo con el indicador se realiza con un clic . Para h
FREE
Basic Theme Builder MT5
Mehran Sepah Mansoor
5 (1)
Constructor de Temas Básico: Simplifica la Personalización de Tu Gráfico Transforma tu experiencia de trading con el Constructor de Temas Básico , un indicador versátil diseñado para simplificar la personalización de la apariencia de tu gráfico en MetaTrader 5. Este intuitivo indicador ofrece un panel fácil de usar que te permite cambiar entre varios temas y esquemas de color con facilidad, mejorando tanto el atractivo visual como la funcionalidad de tu entorno de trading. Free MT4 version El C
FREE
Gino Renko
Stephane, Andr Valette
1 (1)
Another renko-based indicator. It returns different usable values ​​for an EA, and is directly displayed on the main chart. Its setting is very simple: The size of the renko The number of bars taken into account The falling color The color on the rise Returned values: Buffer 0 : Value of the middle Buffer 1 : Value of the Top Buffer 2 : Value of the Bottom Buffer 3 : Direction of renko (0.0 for top ; 1.0 for bottom) Buffer 4 : Ratio of the renko, for example, if it is twice, 3 times, ro more of
Important Lines
Terence Gronowski
4.86 (21)
Indicador de líneas importantes (M1 - M15) Este indicador muestra Líneas pivote, Día anterior alta y baja, Cierre día anterior y el mínimo y máximo de la hora anterior. Simplemente tiene que arrastrar ese único indicador al diagrama para tener todas esas líneas importantes. Puede evitar cargar muchos indicadores individuales. ¿Por qué ciertas líneas son tan importantes cuando se comercia? El día a día, alto y bajo: estos son observados por los comerciantes que comercian en un gráfico dia
FREE
This indicator will mirror the assets in use in another metatrader, being able to choose the timeframe and a template. This is the Metatrader 5 Client, it needs the Metatrader 4 or 5 Server versions: Metatrader 4 Mirror Chart Server:   https://www.mql5.com/en/market/product/88644 Metatrader 5 Mirror Chart Server: https://www.mql5.com/en/market/product/88652 Details of how it works in the video.
FREE
Highly configurable Adx indicator. Features: Highly customizable alert functions (at levels, crosses, direction changes via email, push, sound, popup) Multi timeframe ability Color customization (at levels, crosses, direction changes) Linear interpolation and histogram mode options Works on strategy tester in multi timeframe mode (at weekend without ticks also) Adjustable Levels Parameters: ADX   Timeframe:  You can set the lower/higher timeframes for Adx. ADX   Bar Shift:   you can set the
FREE
I see that many tools in the market deal with Position and Order in the form of operation panels. Which is loaded into a Chart in the form of an EA. However, once the operator panel EA is loaded, no other EAs can be loaded. So, I wrote the one-click operation of Position and Order as a script, so you can load other EAs and easily complete one-click operation of Trade. 1. What is this: This is a one-click script to close position order. Now you can close position tickets at high speed, for examp
Market Profile 3 ForexArby com
Hussien Abdeltwab Hussien Ryad
3.83 (12)
Market Profile 3 MetaTrader 5 indicator  version 4.70— is a classic Market Profile implementation that can show the price density over time, outlining the most important price levels, value area, and control value of a given trading session. This indicator can be attached to timeframes between M1 and D1 and will show the Market Profile for daily, weekly, monthly, or even intraday sessions. Lower timeframes offer higher precision. Higher timeframes are recommended for better visibility. It is als
FREE
Gm Volumes
Antonio Augusto Barreto De Melo
4 (3)
¡Un simple indicador de volumen según el color de la vela! - ¡Fondo personalizado! - Soporta volumen por garrapatas o volumen real. El indicador de Volumen de Metatrader original no muestra los colores de la barra según el color de la Vela, solo cambia de color cuando el volumen de una vela es mayor que el anterior, esto a veces crea confusión para los principiantes y no conoce la real motivo del cambio de color. Indicador gratuito, ¡el soporte puede tardar un poco en responder!
FREE
ChartPan
Leandro Rodrigo Giron
Hey Trader! Boring with the Meta chart? Do you want to move it as you do in Profit? Your problems are over! Now available   Chart Panoramic   or   ChartPan   for closer friends, a utility that allows you to move the chart to better visualize the most relevant points for your trade. Recommend you to add a keyboard shortcut for quick access (Ctrl + Q - for example), because you will need to run   ChartPan   after symbol changing to "release" the chart again. To add a hotkey: after downloa
FREE
Data Extractor (DE) is designed to extract symbol price movement data and save it to file. It's a simple tool, designed to be used in combination with other software. SETTINGS (INPUTS) Period_in_days - How many days of data for Data Extractor to process (including non-work days).  File extension - Defines the type of file in which data will be saved. CSV is readable for a human, HST and BIN are binary data intended for machine reading. File name (without extension) - User defined part of file
FREE
The   Close script   is a simple tool that allows traders to close their trades by three methods. Just run the script and choose the close method. Closing methods Symbol  - Allows closing all open trades for a specific symbol. All_Trades  - Allows closing all open trades. Magic_Number  - Allows closing all open trades according to their magic number. Recommendation AutoTrading functions must be activated.  If the AutoTrading function is disabled, the script will not work. EA should be stopped
FREE
Size Bars
Viktor Loginov
Size Bars – индикатор отображает на графике максимальный, минимальный, текущий и средний размер баров (свечей) за выбранный период. Отображаемые параметры индикатора Size Bars: 1)       Текущий размер бара в писах (по максимум/минимум, тело бара). 2)       Максимальный, минимальный и средний размер свечей BUY . 3)       Максимальный, минимальный, средний размер свечей SELL . 4)       Количество свечей BUY и количество свечей SELL . 5)       Среднее количество свечей подряд BUY и SELL . 6)    
BoletaMiniPanel
PATRICK ANTONIO MORELO A.
5 (4)
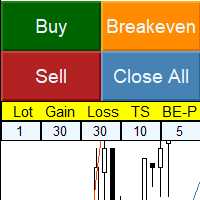
Simple panel with  Stop loss (Loss), Stop gain (Gain) , Trailing stop (TS) and Breakeven (BE-P). Lot is the number of contracts to be traded. Gain is the number, in points, that the stop gain will be positioned. If you don't want to put stop gain, just put 0 (zero) in place and when you open the order it won't have this stop. Loss is the number, in points, that the stop loss will be placed. If you don't want to put stop loss, just put 0 (zero) in place and when you open the order it won't
FREE
FX Info Spread MT5
Pedro Fernandez
3 (1)
FX Info Spread - MetaTrader 5 Panel de información minimalista y personalizable Funciona en cualquier instrumento y tramo horario, con brokers de 2 - 4 dígitos y con 3 - 5 dígitos. Muestra: Horquilla actual ( Spread ) en pips (1 decimal si estás en un broker de 3 - 5 dígitos) ATR (Average True Range / Rango medio) en pips Hora del servidor Hora GMT Información importante sobre la cuenta seleccionada: Apalancamiento (Leverage) y Stopout Level (%) Tiempo para que se cierre la barra o vela a
FREE
The Rayol Code Hour Interval Lines indicator was  designed to assist your trading experience.  It  draws the range of hours chosen by the user directly on the chart, so that it enables traders to visualize price movements during their preferred trading hours, providing  traders a more comprehensive view of price movements and market dynamics. This indicator allows the user to choose not only the Broker's time, but also the Local time. This way, the user no longer needs to calculate local time in
FREE
RenkoChart EA
Paulo Henrique Da Silva
4.33 (3)
The RenkoChart tool presents an innovative and highly flexible approach to visualizing market data in MetaTrader 5. This expert creates a custom symbol with Renko bricks directly on the chart, displaying accurate prices at the respective opening date/time for each brick. This feature makes it possible to apply any indicator to the Renko chart. Furthermore, this tool also allows access to historical brick data through native methods in the MQL5 programming language, such as iOpen, iHigh, iLow and
FREE
Follow The Line MT5
Oliver Gideon Amofa Appiah
4.52 (29)
This indicator obeys the popular maxim that: "THE TREND IS YOUR FRIEND" It paints a GREEN line for BUY and also paints a RED line for SELL. (you can change the colors). It gives alarms and alerts of all kinds. IT DOES NOT REPAINT and can be used for all currency pairs and timeframes. Yes, as easy and simple as that. Even a newbie can use it to make great and reliable trades. NB: For best results, get my other premium indicators for more powerful and reliable signals. Get them here: https://www.m
FREE
LT Rainbow Trend
Thiago Duarte
5 (1)
Do you, like me, like to trade with the trend? Then this indicator will help you! Rainbow Trend is a trend indicator, which uses several Moving Averages on the chart. It measures different trend strenght zones for different periods: very long term, long term, mid term, short term and very short term. Each zone has its color, and it is possible to have sound alert when the prices leaves a zone and enters another. Its configuration is very simple. If you find any bug or have any suggestions, co
Los compradores de este producto también adquieren
Trade Assistant MT5
Evgeniy Kravchenko
4.37 (166)
Ayuda a calcular el riesgo por operación, la fácil instalación de una nueva orden, gestión de órdenes con funciones de cierre parcial, trailing stop de 7 tipos y otras funciones útiles. Atención, la aplicación no funciona en el probador de estrategias. Puede descargar la versión Demo en la página de descripción  Manual, Description, Download demo Función de línea -   Muestra en el gráfico la línea de apertura, Stop Loss, Take Profit. Con esta función es fácil establecer una nueva orden y ver
Bienvenido a Trade Manager EA: la herramienta definitiva de gestión de riesgos diseñada para hacer que el trading sea más intuitivo, preciso y eficiente. No es solo una herramienta para realizar órdenes; es una solución integral para la planificación de operaciones, gestión de posiciones y control del riesgo. Ya seas un principiante, un trader avanzado o un scalper que necesita ejecuciones rápidas, Trade Manager EA se adapta a tus necesidades, ofreciendo flexibilidad en todos los mercados, desde
Local Trade Copier EA MT5
Juvenille Emperor Limited
4.99 (71)
Experimente una copia de operaciones excepcionalmente rápida con Local Trade Copier EA MT5 . Con su fácil configuración de 1 minuto, este copiador de operaciones le permite copiar operaciones entre múltiples terminales de MetaTrader en la misma computadora con Windows o en Windows VPS con velocidades de copiado ultra rápidas de menos de 0.5 segundos. Ya seas un trader principiante o profesional, el   Local Trade Copier EA MT5   ofrece una amplia gama de opciones para personalizarlo según tus ne
TradePanel MT5
Alfiya Fazylova
4.84 (117)
Trade Panel es un asistente comercial multifuncional. La aplicación contiene más de 50 funciones para el comercio manual y le permite automatizar la mayoría de las acciones comerciales. Antes de comprar, puede probar la versión demo en una cuenta de demostración. Demostración aquí . Instrucciones completas aquí . Comercio. Le permite realizar operaciones comerciales básicas con un solo clic: Apertura de órdenes y posiciones. Abrir una cuadrícula de órdenes. Cierre de órdenes y posiciones. Revers
The product will copy all telegram signal to MT5 ( which you are member) , also it can work as remote copier.  Easy to set up, copy order instant, can work with almost signal formats, image signal,  s upport to translate other language to English Work with all type of channel or group, even channel have "Restrict Saving Content", work with  multi channel, multi MT5 Work as remote copier: with signal have ticket number, it will copy exactly via ticket number. Support to backtest signal. How to s
Telegram To MT5 Receiver
Levi Dane Benjamin
4.86 (7)
Copie las señales de cualquier canal del que sea miembro (incluidos los privados y restringidos) directamente a su MT5.  Esta herramienta ha sido diseñada pensando en el usuario al ofrecer muchas características que necesita para gestionar y monitorear las operaciones. Este producto se presenta en una interfaz gráfica fácil de usar y visualmente atractiva. ¡Personalice su configuración y comience a usar el producto en minutos! Guía del usuario + Demo  | Versión MT4 | Versión Discord Si desea
Trade Dashboard MT5
Fatemeh Ameri
4.96 (52)
Tired of complex order placement and manual calculations? Trade Dashboard is your solution. With its user-friendly interface, placing orders becomes effortless, by a single click, you can open trades, set stop loss and take profit levels, manage trade lot size, and calculate risk to reward ratios, allowing you to only focus on your strategy. Say goodbye to manual calculations and streamline your trading experience with Trade Dashboard. Download  Demo Version  right now. You can find  Details of
Exp COPYLOT CLIENT for MT5
Vladislav Andruschenko
4.08 (24)
La copiadora comercial para MT5 es un comercio   copiadora para la plataforma МetaТrader 5 . Copia operaciones de forex entre   cualquier cuenta  MT5  - MT5, MT4  - MT5 para la versión COPYLOT MT5 (o MT4 - MT4 MT5  - MT4 para la versión COPYLOT MT4) Copiadora confiable! Versión MT 4 Descripción completa +DEMO +PDF Cómo comprar Cómo instalar    Cómo obtener archivos de registro    Cómo probar y optimizar    Todos los productos de Expforex También puede copiar operaciones en el terminal МТ4
Trade Manager DaneTrades
Levi Dane Benjamin
4.73 (22)
Trade Manager para ayudarle a entrar y salir rápidamente de operaciones mientras calcula automáticamente su riesgo. Incluye funciones que le ayudarán a evitar el exceso de operaciones, las operaciones de venganza y las operaciones emocionales. Las operaciones se pueden gestionar automáticamente y las métricas de rendimiento de la cuenta se pueden visualizar en un gráfico. Estas características hacen que este panel sea ideal para todos los operadores manuales y ayuda a mejorar la plataforma Meta
Custom Alerts MT5
Daniel Stein
5 (2)
Custom Alerts es una herramienta versátil de monitorización multimercado que identifica configuraciones prometedoras en las ocho divisas principales (USD, CAD, GBP, EUR, CHF, JPY, AUD y NZD), así como en el ORO (XAU), en los 28 pares de Divisas y ORO basados en estas divisas, y hasta en siete índices como US30, UK100, WTI, Bitcoin, etc. Es totalmente personalizable. La herramienta recopila datos de nuestros indicadores FX Power, FX Volume e IX Power y le notifica los eventos significativos.  
$450 (-20%) instead of $565 until 11/29 B e sure to watch this video before using A community for users, product discussion, update news, and first line of support  Use Webmoney For payments in cryptocurrencies. How I use this algo tool   Lazy Trader is NOT SUITABLE FOR SCALPING EVERY MINUTE MOVEMENT, ESPECIALLY IN CRYPTO. WITHOUT UNDERSTANDING WHAT IS HAPPENING ON THE CHART, THERE IS NO POINT IN BLINDLY HOPING FOR PROFITS! Lazy Trader does NOT USE openAI chat-gpt-4 technologies, which are ad
MT5 to Telegram Signal Provider es una utilidad fácil de usar y completamente personalizable que permite enviar señales especificadas al chat, canal o grupo de Telegram, convirtiendo tu cuenta en un proveedor de señales . A diferencia de la mayoría de los productos competidores, no utiliza importaciones DLL. [ Demo ] [ Manual ] [ Versión MT4 ] [ Versión Discord ] [ Canal de Telegram ] Configuración Está disponible una guía del usuario paso a paso. No se requiere conocimiento de la API de Tele
YuClusters
Yury Kulikov
4.93 (42)
Atención: la versión de demo para revisión y prueba está aquí . YuClusters es un sistema de análisis de mercado profesional. El comerciante tiene oportunidades únicas para analizar el flujo de órdenes, volúmenes comerciales, movimientos de precios utilizando varios gráficos, perfiles, indicadores y objetos gráficos. YuClusters opera con datos basados ​​en Time & Sales o información de ticks, dependiendo de lo que esté disponible en las cotizaciones de un instrumento financiero. YuClusters le pe
News Filter Tool
Apex Software Ltd
5 (1)
Mejora tu trading con análisis de eventos noticiosos En el vertiginoso mundo del trading, las noticias pueden afectar significativamente los precios del mercado. Comprender cómo influyen estos eventos en los movimientos de precios es fundamental para gestionar sus operaciones durante períodos volátiles. News Tool EA está diseñado para proporcionar información sobre noticias históricas y futuras, lo que le ayudará a tomar decisiones comerciales informadas. Este EA no puede ejecutarse en el prob
Mentfx Mmanage mt5
Anton Jere Calmes
4.25 (8)
The added video will showcase all functionality, effectiveness, and uses of the trade manager. Drag and Drop Trade Manager. Draw your entry and have the tool calculate the rest. Advanced targeting and close portions of a trade directly available in tool (manage trades while you sleep). Market order or limit order on either side with factored spread. Just draw the entry, the tool does the rest. Hotkey setup to make it simple. Draw where you want to enter, and the stop loss, the tool calculates al
Trade Assistant 38 in 1
Makarii Gubaydullin
4.89 (18)
Herramienta multifuncional con más de 65 funciones, incluidas: Calculadora de lotaje, Acción del precio, Calculo RR, Gestor de posiciones, Zonas de Oferta y Demanda Versión demo   |   Manual de usuario   |   MT4 La utilidad no funciona en el probador de estrategias: puede descargar la   Versión Demo AQUÍ   para probar el producto. Pongase en contacto   conmigo para cualquier pregunta / ideas para mejorar / en caso de encontrar un problema Simplifica, acelera y automatiza su operativa de tradi
The  Easy Strategy Builder (ESB)  is a " Do It Yourself " solution that allows you to create a wide range of the automated trading strategies without any line of codes. This is the world’s easiest method to automate your strategies that can be used in STP, ECN and FIFO brokers. No drag and drop is needed. Just by set conditions of your trading strategy and change settings on desired values and let it work in your account. ESB has hundreds of modules to define unlimited possibilities of strategi
Auto Trade Copier for MT5
Vu Trung Kien
4.24 (21)
Auto Trade Copier está diseñado para copiar los oficios entre múltiples cuentas MT5 / terminales con una precisión absoluta. Con esta herramienta, puede actuar como proveedor (fuente ) o receptor (destino ) . Cada acciones comerciales podrán ser clonados del proveedor al receptor sin demora. Las siguientes son las funciones destacadas :     Cambie entre proveedores o función del receptor en una sola herramienta.     Un proveedor puede copiar los oficios a las cuentas de múltiples receptor
Bots Builder Pro MT5
Andrey Barinov
4 (5)
This is exactly what the name says. Visual strategy builder . One of a kind. Turn your trading strategies and ideas into Expert Advisors without writing single line of code. Generate mql source code files with a few clicks and get your fully functional Expert Advisors, which are ready for live execution, strategy tester and cloud optimization. There are very few options for those who have no programming skills and can not create their trading solutions in the MQL language. Now, with Bots Build
Risk Manager for MT5
Sergey Batudayev
4.5 (14)
Expert Advisor Risk Manager para MT5 es un programa muy importante y, en mi opinión, necesario para todos los comerciantes. Con este Asesor Experto podrá controlar el riesgo en su cuenta de operaciones. El control de riesgos y beneficios puede realizarse tanto en términos monetarios como porcentuales. Para que el Asesor Experto funcione, simplemente adjúntelo al gráfico de pares de divisas y establezca los valores de riesgo aceptables en la divisa de depósito o en % del saldo actual. PROMO
Trade copier MT5
Alfiya Fazylova
4.48 (27)
Trade Copier es una utilidad profesional diseñada para copiar y sincronizar operaciones entre cuentas comerciales. La copia ocurre desde la cuenta / terminal del proveedor a la cuenta / terminal del destinatario, instalada en la misma computadora o vps. Antes de comprar, puede probar la versión de demostración en una cuenta de demostración. Versión de demostración aquí . Instrucciones completas aquí . Principales funcionalidades y beneficios: Admite la copia de MT5> MT5, MT4> MT5, MT5> MT4, incl
-25% discount ($149 -> $111) Everything for chart Technical Analysis indicator mt5 in one tool Draw your supply demand zone with rectangle and support resistance with trendline and get alerts to mobile phone or email alert -  Risk reward indicator mt5 Video tutorials, manuals, DEMO download   here .   Find contacts on my   profile . 1.   Extended rectangles and trendlines Object will be extended to the right edge of the chart when price will draw new candles on chart. This is rectangle extend
Cerberus Equity Watcher
Samuel Bandi Roccatello
5 (2)
Cerberus the Equity Watcher es una herramienta de gestión de riesgos que monitorea constantemente   el valor de tu cuenta y evita drawdowns importantes, que sean ellos causados por EA defectuosos o por las emociones si eres un trader discrecional. Es extremadamente útil para los traders sistemáticos que confían en EA que pueden contener errores o que pueden no funcionar bien en condiciones de mercado inesperadas. Cerberus   permite establecer un valor mínimo de tu cuenta y (opcionalmente) un va
HYT utility
Sergey Batudayev
5 (1)
HYT (Help Your Trading) is a tool designed to help you average down your losing positions using two main techniques: Standard averaging . Hedging with subsequent opening of positions in the direction of the trend . Buy 1 and 1 get FREE This tool allows you to manage multiple positions opened in different directions, both for buying and selling. HYT automatically calculates the size of the next position , order price, direction for averaging, and closing the position with a specified take-profit
Ultimate Trailing Stop EA MT5
BLAKE STEVEN RODGER
4.5 (6)
This EA Utility allows you to manage (with advanced filtering) unlimited open orders (manual or EA) with 16 trailing stop methods: fixed, percent, ATR Exit, Chandelier Exit, Moving Average, Candle High Low Exit, Bollinger Bands, Parabolic, Envelope, Fractal, Ichimoku Kijun-Sen, Alligator, Exit After X Minutes or Bars, RSI and Stochastic. The trailing stop can be either real or virtual, and you can exit fully or with a partial close percent on touch or bar close.  Moreover, you can add (overri
El MT5 to Discord Signal Provider es una herramienta fácil de usar y completamente personalizable diseñada para enviar señales de trading directamente a Discord. Esta herramienta transforma tu cuenta de trading en un proveedor de señales eficiente. ¡Personaliza los formatos de los mensajes para adaptarlos a tu estilo! Para facilitar su uso, selecciona entre plantillas pre-diseñadas y elige qué elementos del mensaje incluir o excluir. [ Demo ] [ Manual ] [ Versión MT4 ] [ Versión Telegram ] Con
-25% discount ($199 -> $149) Advanced trading tool: One click smart orders that execute under your conditions Developed by trader for trading community:  position size calculator (lot size), open position after price action, strategy builder, set and forget trading, mobile notifications... Risk Management -  Risk percentage position size calculator, gain percentage, target risk reward ratio, spread and commissions are included in calculations 7 Advanced order types  - Set and forget trading w
VirtualTradePad One Click Trading Panel
Vladislav Andruschenko
4.56 (64)
Panel de comercio para operar en 1 clic. ¡Trabajando con posiciones y pedidos! Operar desde el gráfico o desde el teclado. Con nuestro panel de operaciones, puede ejecutar operaciones con un solo clic directamente desde el gráfico y realizar operaciones comerciales 30 veces más rápido que con el control estándar de MetaTrader. Los cálculos automáticos de parámetros y funciones hacen que las operaciones sean más rápidas y cómodas para los operadores. Consejos gráficos, etiquetas informativas e in
DrawDown Limiter
Haidar, Lionel Haj Ali
5 (18)
Drawdown Limiter EA You are in the right place if you were searching for Drawdown control, Drawdown limiter, Balance protection, Equity Protection or Daily Drawdown Limit related to Prop Firm, FTMO, or Funded account trading, or if you want to protect your trading account. Have you suffered from controlling your drawdown when trading funded accounts? This EA is meant for you. Prop firms usually set a rule called “Trader Daily Drawdown”, and if it is not respected, you are disqualified.  I am an
Grid Manual MT5
Alfiya Fazylova
4.88 (16)
Grid Manual es un panel de negociación para trabajar con una cuadrícula de órdenes. La utilidad es universal, tiene configuraciones flexibles y una interfaz intuitiva. Funciona con una cuadrícula de pedidos no solo en la dirección de promediar pérdidas, sino también en la dirección de aumentar las ganancias. El usuario no necesita crear y mantener una cuadrícula de pedidos, la utilidad lo hará. Basta con abrir un pedido y el "Grid manual" creará automáticamente una grilla de pedidos para el mism
Otros productos de este autor
This product can be used to synchronize multiple Charts, and each Chart can be set to a different sync mode. With this product you can better view and manipulate charts: different time frames for a single Symbol, the same time frame for multiple Symbols... and more. PS: The link below is the FreeDemo product, you can use it on EURUSD/XUAUSD/USDCNH symbol: https://www.mql5.com/en/market/product/38557 Feature: Chart settings  can be synchronized, including : background, indentation, size, etc.
Do you think it's a bit cumbersome when you need to switch symbols or timeframes with mouse click? 1. What is this? This is a program that can switch symbols and timeframes with direction keys. Fast switching, very convenient, no mouse click required. For traders, one symbol with multi-timeframe charts are usually added,  you can change symbol on those charts easily. For multi-currency traders, different symbol charts are usually added, you can also change those timeframes easily. I wrote this p
1. What is this         Rising volatility and falling volatility are not the same, whether it is academic research or actual testing has shown this point.         The original ATR indicator is calculated by putting up and down fluctuations together. This indicator is to calculate separately the upward volatility and the downward volatility, which can better help you study the market. 2. Indicator description          There are two modes for the calculation of this indicator, as shown in the f
Have you ever take a long time to watch a Symbol when the network link is not good ? Have you ever wait for a long time when you switch chart between different Symbols or different TimeFrames ? If you do long-term backtesting , Have you ever to be downloaded datas for a long time ? Yes, If there is no data in the system, those will happen.  1. What is this: Download all the Symbol data in Market Watch to the system. PS: This is not outputting data to Files. This Link go to Demo version: https:
This product can be used to synchronize multiple Charts, and each Chart can be set to a different sync mode. With this product you can better view and manipulate charts: different time frames for a single Symbol, the same time frame for multiple Symbols, system indicators for single/multiple Symbols... and more. Feature: Chart settings can be synchronized, including : background, indentation, size, etc. Multiple Chart window start times  or end times can be synchronized. Multiple Chart time f
I see that many tools in the market deal with Position and Order in the form of operation panels. Which is loaded into a Chart in the form of an EA. However, once the operator panel EA is loaded, no other EAs can be loaded. So, I wrote the one-click operation of Position and Order as a script, so you can load other EAs and easily complete one-click operation of Trade. 1. What is this: This is a one-click script to close position order. Now you can close position tickets at high speed, for examp
Do you think it's a bit cumbersome when you need to switch symbols or timeframes with mouse click? 1. What is this? This is a program that can switch symbols and timeframes with direction keys. Fast switching, very convenient, no mouse click required. For traders, one symbol with multi-timeframe charts are usually added,  you can change symbol on those charts  easily . For multi-currency traders, different symbol charts are usually added, you can also change those timeframes easily. I wrote thi
According to trading experience: Some symbols are easy to reverse on certain days, such as Monday, or afternoon, and so on. So comparing the current price with the corresponding historical moment price is valuable. If the price coordinate system uses a logarithmic price, you will get a lot of valuable information. 1. What is this? This program can convert the symbol price and add it to your Chart. You can compare it with your major chart. The DEMO version Link: https://www.mql5.com/en/market/p
What is this: Violent trading: means sending a large number of orders to your brokerage server,  it can conduct a stress test of the trading. In this program you can run a variety of trading tests.  Now you can trade at high speed, For example 1000 orders in an instant. The Demo version's link:  https://www.mql5.com/en/market/product/38431/ Why to use: Whether manual trading or EA trading,  the status of the broker server is very important. So it is beneficial to conduct a trading stress test on
1. Why did I develop this series of indicators I found that most traders need to use multiple time frame indicators. They usually switch time frame to see indicators. However, once the timeframe is switched, you cannot see the  corresponding relationship  between  the price in the smaller timeframe  and  the indicator in the larger timeframe . For example: if your price chart is in H1 timeframe, you can see H4, D1 and W1 indicators in H1 timeframe Chart. This is more helpful for you to find t
Filtro:
[Eliminado] 2019.02.14 14:59 
 

El usuario no ha dejado ningún comentario para su valoración

[Eliminado] 2019.02.14 14:08 
 

El usuario no ha dejado ningún comentario para su valoración

Respuesta al comentario
Versión 1.11 2021.10.23
magic number: default 0 means all.
comment: default "" means all.
Versión 1.10 2020.12.01
Now you can delete pending tickets at high speed, for example 1000 pending tickets can be deleted instantaneously.

Versión 1.7 2020.06.06
recompiled for MT5 update.
Versión 1.6 2019.05.07
Add to print the total time of deleting all pending orders.
Versión 1.2 2019.02.14
1.01 Fix some bug.

1.02 Add alert when you have the wrong operation.