KT Auto Fibo MT5
- Indicadores
- KEENBASE SOFTWARE SOLUTIONS
- Versión: 1.1
- Actualizado: 25 marzo 2022
- Activaciones: 5
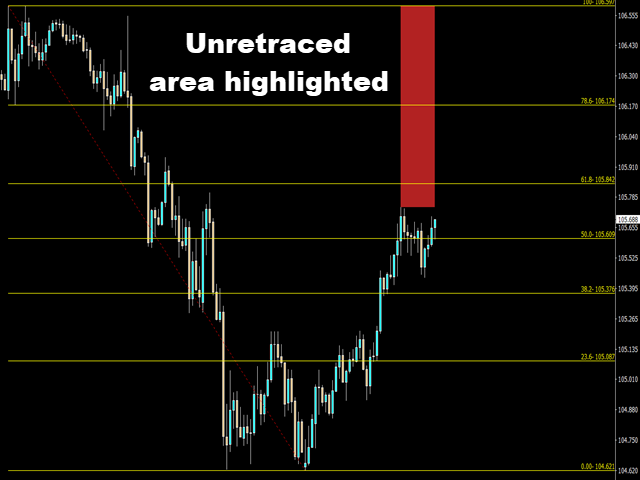
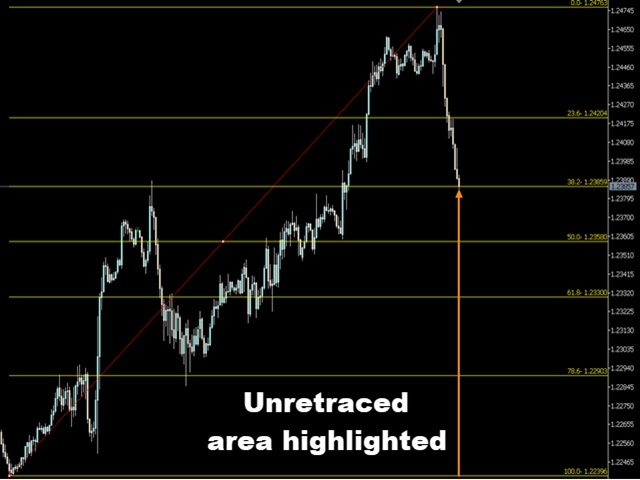
KT Auto Fibo draws Fibonacci retracement levels based on the ongoing trend direction. The Highs and Lows are automatically selected using the Maximum and Minimum points available on the chart. You can zoom in/out and scroll to adjust the Fibonacci levels accordingly.
Modes
- Auto: It draws the Fibonacci levels automatically based on the chart area.
- Manual: It draws the Fibonacci levels only one time. After that, you can change the anchor points manually.
Usage:
- Helps to predict the future profit targets logically.
- Strong reversal possibility when combined with support/resistance or trend lines.
- Provides a low-risk entry in the trending market.
Input Parameters
- Auto: It draws the Fibonacci retracement levels without any human intervention.
- Manual: It draws the Fibonacci retracement levels only one time. After that, you can stretch the anchor points manually.
- Show Unretraced area: Show/Hide the area on chart that is still untouched by the price retracement.
- Rest of the inputs are self-explanatory.

Very good.