KT Trend Magic
- Indicadores
- KEENBASE SOFTWARE SOLUTIONS
- Versión: 2.0
- Actualizado: 22 marzo 2022
- Activaciones: 5
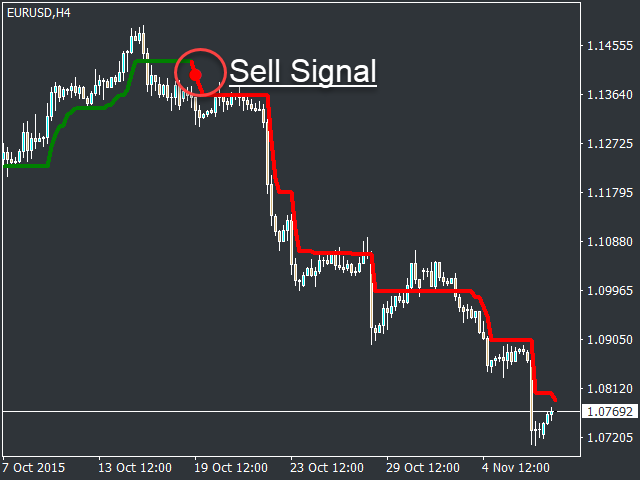
KT Trend Magic shows the trend depiction on chart using the combination of market momentum and volatility. A smoothing coefficient is used to smooth out the noise from the signal.It can be used to find out the new entries or confirm the trades produced by other EA/Indicators.
Usage
- Drag n drop MTF scanner which scans for the new signals across multiple time-frames.
- Find new entries in the trend direction.
- Improve the accuracy of other indicators when used in conjunction.
- Can be used as a dynamic support n resistance level.
- All Metatrader alerts implemented.
Input Parameters
- History Bars: Numbers of bars to consider for calculation. Lesser History Bars = Low memory consumption.
- Trend Period: Period used for trend and momentum calculation.
- Smoothing Coefficient: Smoothing coefficient to smooth out the noise from data.
- Rest of the inputs are self-explanatory.