• Información general
  • Comentarios
  • Discusión

Force Price Power

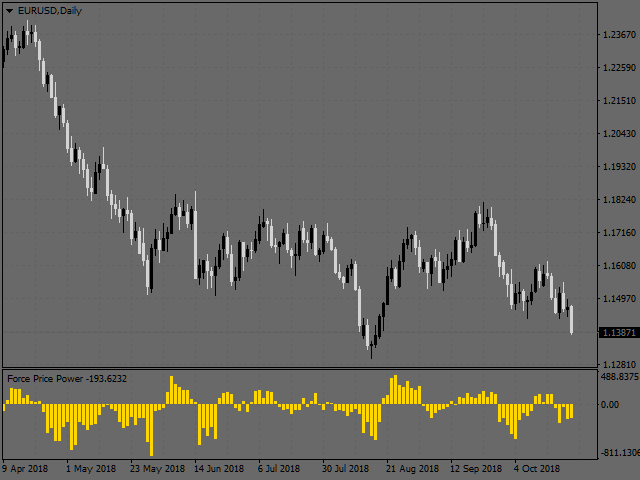
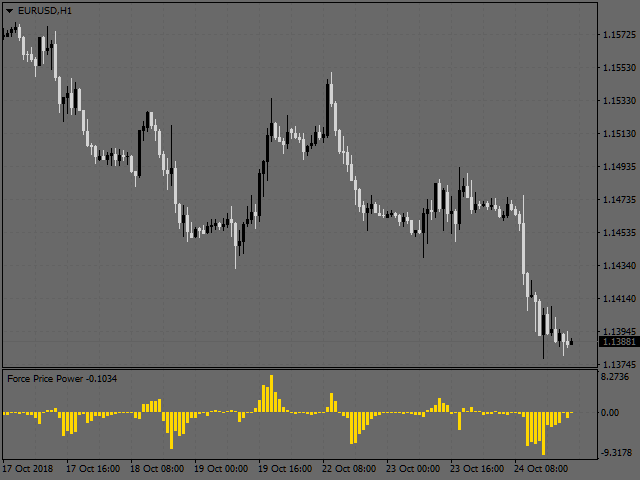
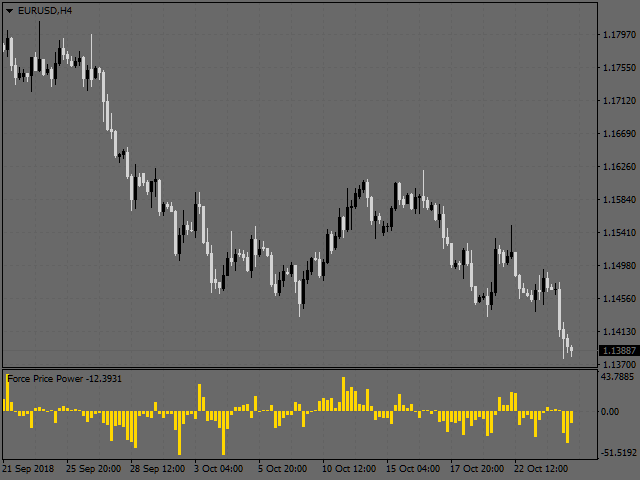
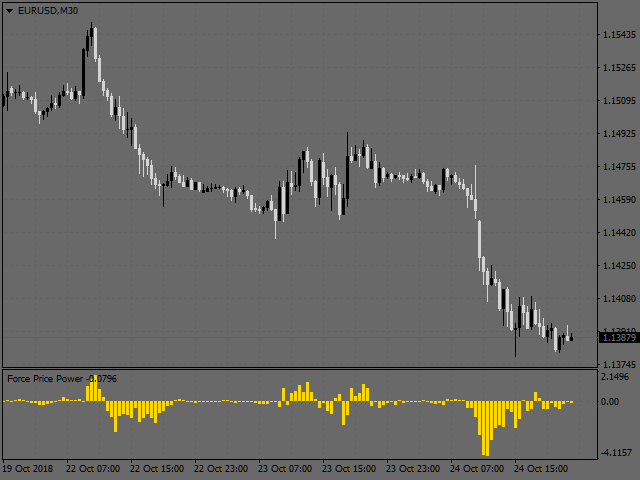
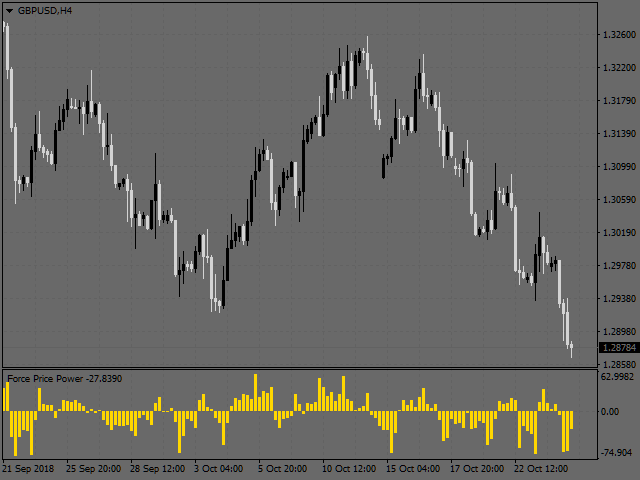
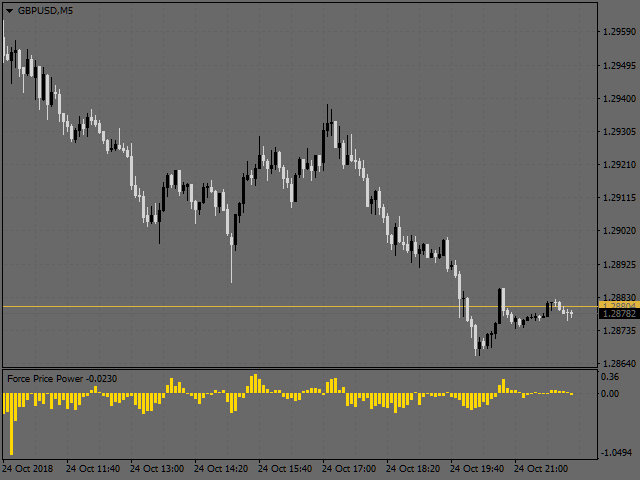
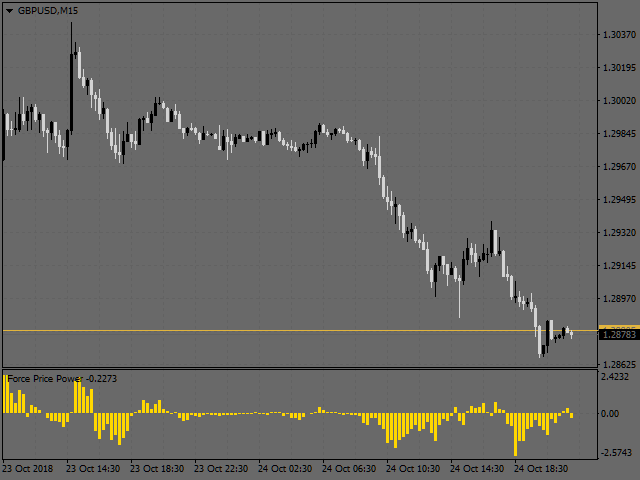
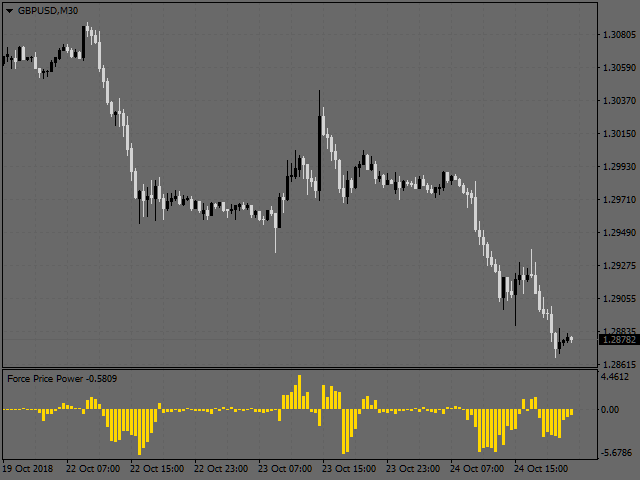
Force Price Power es un indicador muy potente que proporciona informacion valiosa y util sobre la fuerza real del precio promediando dinamicamente ademas sobre el volumen de las operaciones que se estan produciendo en el Mercado.

Este indicador es especial para identificar la fuerza dinamica del precio. La distancia de cero (sea hacia arriba de cero o hacia abajo de cero) indicaria el grado de fuerza y potencia, sea bajista o alcista.


Productos recomendados
Blahtech Market Profile
Blahtech Limited
4.56 (16)
Was: $249  Now: $99   Market Profile defines a number of day types that can help the trader to determine market behaviour. A key feature is the Value Area, representing the range of price action where 70% of trading took place. Understanding the Value Area can give traders valuable insight into market direction and establish the higher odds trade. It is an excellent addition to any system you may be using. Blahtech Limited presents their Market Profile indicator for the MetaTrader community. Ins
BoxChart MT4
Evgeny Shevtsov
4.5 (6)
The market is unfair if only because 10% of participants manage 90% of funds. An ordinary trader has slim changes to stand against these "vultures". This problem can be solved. You just need to be among these 10%, learn to predict their intentions and move with them. Volume is the only preemptive factor that faultlessly works on any timeframe and symbol. First, the volume appears and is accumulated, and only then the price moves. The price moves from one volume to another. Areas of volume accumu
El indicador construye cotizaciones actuales, que se pueden comparar con las históricas y, sobre esta base, hacer un pronóstico de movimiento de precios. El indicador tiene un campo de texto para una navegación rápida a la fecha deseada. Opciones: Símbolo - selección del símbolo que mostrará el indicador; SymbolPeriod - selección del período del cual el indicador tomará datos; IndicatorColor - color del indicador; HorisontalShift: cambio de cotizaciones dibujadas por el indicador
Indicador Perfil de Volumen para MT4 Obtén una ventaja en el trading con el indicador "Perfil de Volumen" para MetaTrader 4 (MT4). Esta herramienta avanzada de análisis técnico te permite identificar con precisión niveles clave de soporte y resistencia basados en el volumen de transacciones. Visualiza fácilmente las áreas de mayor interés del mercado, donde los volúmenes de negociación son más altos, y utiliza esta información para tomar decisiones de trading más informadas. Características prin
This indicator is a conventional analytical tool for tick volumes changes. It calculates tick volumes for buys and sells separately, and their delta on every bar, and displays volumes by price clusters (cells) within a specified bar (usually the latest one). The algorithm used internally is the same as in the indicator VolumeDelta , but results are shown as cumulative volume delta bars (candlesticks). Analogous indicator for MetaTrader 5 exists - VolumeDeltaBars . This is a limited substitution
An indicator of patterns #24, #25, #26 and #27 ("Head and Shoulders", "Complex Head and Shoulders") from Encyclopedia of Chart Patterns by Thomas N. Bulkowski. Parameters: Alerts - show alert when an arrow appears   Push - send a push notification when an arrow appears (requires configuration in the terminal) PeriodBars - indicator period K - an additional parameter that influences the accuracy of pattern shape recognition. The smaller the value is, the smoother the row of peaks/valleys shou
Daily Candle Predictor es un indicador que predice el precio de cierre de una vela. El indicador está destinado principalmente para su uso en gráficos D1. Este indicador es adecuado tanto para el comercio de divisas tradicional como para el comercio de opciones binarias. El indicador se puede utilizar como un sistema de negociación independiente o puede actuar como una adición a su sistema de negociación existente. Este indicador analiza la vela actual, calculando ciertos factores de fuerza dent
Master Scalping M1 es un indicador innovador que utiliza un algoritmo para determinar la tendencia de forma rápida y precisa. El indicador calcula el tiempo de apertura y cierre de posiciones, los algoritmos del indicador le permiten encontrar los momentos ideales para ingresar a una operación (comprar o vender un activo), lo que aumenta el éxito de las transacciones para la mayoría de los comerciantes. Beneficios del indicador: Fácil de usar, no sobrecarga el gráfico con información innecesari
UPD1 Profile Levels
Vitaliy Kuznetsov
5 (5)
El indicador encuentra los niveles de volumen de precio máximo y mínimo (perfil de mercado) en el gráfico de barras de trabajo para el número especificado de barras.   Perfil compuesto. La altura del histograma es completamente automática y se adapta a cualquier instrumento y marco de tiempo. Se utiliza un algoritmo de autor y no repite análogos conocidos. La altura de los dos histogramas es aproximadamente igual a la altura promedio de la vela. La alerta inteligente le ayudará a informar sobre
Le presentamos el indicador "Candle closing counter", que se convertirá en su asistente indispensable en el mundo del trading. Es por eso que saber cuándo se cerrará la vela puede ayudar: Si usted tiene gusto de negociar usando patrones de la vela, usted sabrá cuando la vela será cerrada. Este indicador le permitirá comprobar si se ha formado un patrón conocido y si hay una posibilidad de negociación. El indicador le ayudará a prepararse para la apertura del mercado y el cierre del mercado.
Zig Zag 123
Stephen Reynolds
Zig Zag 123 tells us when a reversal or continuation is more likely by looking at the shift in supply and demand. When this happens a signature pattern appears known as 123 (also known ABC) will often break out in direction of higher low or lower high. Stop loss and take profit levels have been added. There is a panel that shows the overall performance of your trades for if you was to use these stop loss and take profit levels.  We get alerted if a pattern 123 appears and also if the price
TWO PAIRS SQUARE HEDGE METER INDICATOR Try this brilliant 2 pairs square indicator It draws a square wave of the relation between your two inputs symbols when square wave indicates -1 then it is very great opportunity to SELL pair1 and BUY Pair2 when square wave indicates +1 then it is very great opportunity to BUY pair1 and SELL Pair2 the inputs are : 2 pairs of symbols         then index value : i use 20 for M30 charts ( you can try other values : 40/50 for M15 , : 30 for M30 , : 10 for H1 ,
Order Book
Thomas Bradley Butler
Combine con Delta Footprint Chart para obtener una imagen completa del perfil de volumen del mercado:   https://www.mql5.com/en/market/product/9415 3 El indicador "Libro de pedidos" muestra un histograma en el gráfico de precios que representa los grupos de volumen de oferta y demanda.   El indicador analiza los datos de precios históricos y calcula los grupos de volumen de oferta y demanda para cada nivel de precio dentro de un número específico de barras. Los grupos de volumen de oferta s
Un indicador técnico que calcula sus lecturas sobre los volúmenes de negociación. En forma de histograma, muestra la acumulación de la fuerza del movimiento del instrumento comercial. Dispone de sistemas de cálculo independientes para direcciones alcistas y bajistas. Funciona en cualquier instrumento comercial y marco de tiempo. Puede complementar cualquier sistema comercial. El indicador no vuelve a dibujar sus valores, las señales aparecen en la vela actual. Es fácil de usar y no carga el gr
Title : Market Bias Indicator - Oscillator-Based Trading Tool Introduction : Discover the potential of the "Market Bias Indicator," a revolutionary oscillator-based trading tool designed for precise market analysis. If you're in search of a robust alternative to traditional bias indicators, your quest ends here. Market Bias Indicator offers unparalleled accuracy in identifying market sentiment and is your gateway to confident trading decisions. Recommended Trading Pairs : Market Bias Indicator i
Cosmic Diviner X Planet
Olena Kondratenko
4 (2)
This unique multi-currency strategy simultaneously determines the strength of trends and market entry points, visualizing this using histograms on the chart. The indicator is optimally adapted for trading on the timeframes М5, М15, М30, Н1. For the convenience of users, the indicator renders the entry point (in the form of an arrow), recommended take profit levels (TP1, TP2 with text labels) and the recommended Stop Loss level. The take profit levels (TP1, TP2) are automatically calculated for
Simply The Best Pro
Szymon Palczynski
5 (1)
This indicator displays the histogram and arrows on chart. When Simple The Best Pro are placed on a chart, they identify the trend.  The color of may be blue or red. The blue color stands for upside moves and the red color stands for downside trends. The indicator offers to set Stop Loss (SL) and  Take Profit (TP)  setting. The default value is ATR. Indicator has automatic optimization. The STB is a unique indicator that shows the tendency (button Bars) of a particular signals. The STB tells us
Market Dynamics
Thomas Bradley Butler
Market Dynamics es para el scalping de tendencias. El azul es comprar y el rojo es vender. Las líneas son áreas de consolidación de precios y las velas de barra regulares no están decididas. El precio se consolidará entre las líneas de soporte y resistencia y luego habrá una ruptura de la acción del precio fuera de las áreas. Pica las áreas por encima o por debajo del cuero cabelludo y sigue las tendencias principales o el comercio diario de cueros cabelludos.
GND Tail Candle
Nguyen Dang Giang
A tall upper shadow occurs when the price moves during the period, but goes back down, which is a bearish signal. A tall lower shadow forms when bears push the price down, but bulls pull it back up, which leaves a long line or shadow. This is considered a bullish signal. Some technical analysts believe a tall or long shadow means the stock will turn or reverse. Some believe a short or lower shadow means a price rise is coming. In other words, a tall upper shadow means a downturn is coming, whil
EZT Trade History This is a great tool to analyze past trades or follow current ongoing trades, especially when you using an EA to manage your transactions. You will see the exact candle where the trade was opened and closed. Collapsible floating panel on the chart, free to move anywhere with your mouse. When you using multiple EA’s with different magic numbers, you have 5 options to separate those trades, so you will know which EA opened specific transactions. You can set the day limits how fa
Owl smart levels
Sergey Ermolov
4.34 (35)
Versión MT5  |   FAQ El   Indicador Owl Smart Levels   es un sistema comercial completo dentro de un indicador que incluye herramientas de análisis de mercado tan populares como   los fractales avanzados de Bill Williams , Valable ZigZag que construye   la estructura de onda correcta   del mercado y   los niveles de Fibonacci   que marcan los niveles exactos de entrada. en el mercado y lugares para tomar ganancias. Descripción detallada de la estrategia Instrucciones para trabajar con el indi
VN Trade Panel II
Vyacheslav Nekipelov
4 (1)
The new version of the trading panel, which now has the ability to separately close Buy and Sell orders, display targets for all orders on the chart, as well as the ability to use the panel to trade with brokers working on the FIFO rule. Also, the new version adds option buttons for separate management of open orders. It has a convenient visualized interface and intuitive control without a lot of additional tabs to which traders have to be distracted and switch their attention. Thanks to this
Retroceso de Fibonacci & Herramientas de Dibujo de Líneas Extendidas Retroceso de Fibonacci & Herramientas de Dibujo de Líneas Extendidas son aptos para la plataforma MT4 y para operadores que emplean el método de negociación de puntos y la negociación de sección áurea. Ventajas: Sin líneas excusadas ni las excesivamente largas, y es fácil de observar y descubrir oportunidades de negociación. Versión de prueba: https://www.mql5.com/zh/market/product/35884 Funciones principales: 1.
VPO Profile MT4
Kyra Nickaline Watson-gordon
5 (2)
Definition : VPO is a Volume Price Opportunity. Instead of using bars or candles with an Open, High, Low, and Close price, each "bar" in a Market Profile is represented by horizontal bars against the price It is called Market Profile terminology. In other words volume-price-opportunity (VPO) profiles are histograms of how many volumes were traded at each price within the span of the profile. By using a VPO chart, you are able to analyze the amount of trading activity, based on volume, for eac
The Chaikin Oscillator is a technical indicator developed by Marc Chaikin that combines price and volume data to measure the accumulation and distribution of a financial instrument. It aims to identify potential buying and selling opportunities in the market. The Chaikin Oscillator is calculated by subtracting a 10-day exponential moving average of the Accumulation Distribution Line (ADL) from a 3-day exponential moving average of the ADL. Here's how to use the Chaikin Oscillator indicator in tr
Trend Deviation
VLADISLAV AKINDINOV
Trend indicator with calculation of dynamic levels and signaling their intersection. Description of input parameters: StepTF = true; - Calculation of the indicator by closing the bar (true) or by each tick (false) BarsCount = 300; - Number of settlement bars Price = PRICE_CLOSE; - Type of price used TimeFrame = PERIOD_CURRENT; - Estimated timeframe TrendPeriod = 9; - Trend calculation period TrendDeviations = 4.9; - coefficient of deviation PeriodTrendSmooth = 1; - Trend smoothi
Trade with Gann on your side!! MASTER CIRCLE 360 CIRCLE CHART, originally created by Gann admitted that this is “The Mother of all charts”. It is one of the last studies that this great trader left for us. The numeric tab le is apparently quite simple like all the tables and is based on square numbers, the SQUARE OF 12 and is by evolution, one of the most important square numbers. Here we can find CYCLE, PRICE AND TIME thanks to angles and grades, to show past and future support and resistance.
Point61 Indicator
Evgeniy Machok
5 (1)
The Point61 indicator is the result of many years of monitoring of price behavior of currency pairs and metals. It is not a secret, that in times of uncertainty, traders are looking for possible levels of support and resistance - the point, where price should stop its movement. There are 2 possible scenarios at these points: 1. Reverse (correction) to the opposite direction; 2. Breakthrough to continue movement. Very often these points are used to set stop orders - TakeProfit or
Blahtech Supply Demand
Blahtech Limited
4.61 (33)
Was: $299  Now: $99   Supply Demand uses previous price action to identify potential imbalances between buyers and sellers. The key is to identify the better odds zones, not just the untouched ones. Blahtech Supply Demand indicator delivers functionality previously unavailable on any trading platform. This 4-in-1 indicator not only highlights the higher probability zones using a multi-criteria strength engine, but also combines it with multi-timeframe trend analysis, previously confirmed swings
Displays the local time with the time difference you set. (It does not correspond to the time difference in 30-minute increments.) It also displays a price line with a good price, such as 100.000 .100 or .200. The standard gridlines are displayed with the time and price by MT4, but they are very confusing as they become the broker's time and are displayed at the halfway point along with the price. It hides them and displays gridlines at user-defined time differences and prices in easy-to-und
Los compradores de este producto también adquieren
Gann Made Easy
Oleg Rodin
4.86 (83)
Gann Made Easy es un sistema de comercio de Forex profesional y fácil de usar que se basa en los mejores principios de comercio utilizando la teoría del Sr. W. D. Gann. El indicador proporciona señales precisas de COMPRA y VENTA, incluidos los niveles de Stop Loss y Take Profit. Puede comerciar incluso sobre la marcha utilizando notificaciones PUSH. ¡Por favor, póngase en contacto conmigo después de la compra! ¡Compartiré mis consejos comerciales con usted y excelentes indicadores de bonificació
FX Volume
Daniel Stein
4.58 (33)
Obtenga su actualización diaria del mercado con detalles y capturas de pantalla a través de nuestro Morning Briefing aquí en mql5 y en Telegram ! FX Volume es el PRIMER y ÚNICO indicador de volumen que proporciona una visión REAL del sentimiento del mercado desde el punto de vista de un bróker. Proporciona una visión impresionante de cómo los participantes institucionales del mercado, como los brokers, están posicionados en el mercado Forex, mucho más rápido que los informes COT. Ver esta info
Enigmera
Ivan Stefanov
5 (3)
ENIGMERA: El núcleo del mercado https://www.enigmera.com Introducción Este indicador y sistema de negociación es un enfoque extraordinario de los mercados financieros. ENIGMERA utiliza los ciclos fractales para calcular con precisión los niveles de soporte y resistencia. Muestra la auténtica fase de acumulación y proporciona dirección y objetivos.  Un sistema que funciona tanto si estamos en una tendencia como en una corrección.  ¿Cómo funciona? ENIGMERA consta de tres líneas: la línea de s
Atomic Analyst
Issam Kassas
5 (2)
En primer lugar, vale la pena enfatizar que este Indicador de Trading no repinta, no redibuja y no se retrasa, lo que lo hace ideal tanto para el trading manual como para el automatizado. Manual del usuario: configuraciones, entradas y estrategia. El Analista Atómico es un Indicador de Acción del Precio PA que utiliza la fuerza y el impulso del precio para encontrar una mejor ventaja en el mercado. Equipado con filtros avanzados que ayudan a eliminar ruidos y señales falsas, y aumentan el poten
FX Power MT4 NG
Daniel Stein
5 (13)
Obtenga su actualización diaria del mercado con detalles y capturas de pantalla a través de nuestro Morning Briefing aquí en mql5 y en Telegram ! FX Power MT4 NG es la nueva generación de nuestro popular medidor de fuerza de divisas, FX Power. ¿Y qué ofrece este medidor de fuerza de nueva generación? Todo lo que le encantaba del FX Power original PLUS Análisis de fuerza de ORO/XAU Resultados de cálculo aún más precisos Períodos de análisis configurables individualmente Límite de cálculo persona
Trend Punch
Mohamed Hassan
4.95 (19)
This indicator is unstoppable when combined with our other indicator called  Support & Resistance . After purchase, send us a message and you will get it   for  FREE as a BONUS! Introducing Trend Punch , the revolutionary forex trend indicator that will transform the way you trade! Trend Punch is uniquely designed to provide precise buy and sell arrows during strong market trends, making your trading decisions clearer and more confident. Whether you're trading major currency pairs or exotic sym
Gann Swing Structure
Kirill Borovskii
5 (1)
This indicator is based on the mathematics of the great trader W.D. Ganna. With its help, you can easily find strong levels by analyzing swings to find the optimal entry point. The indicator works on all instruments and all timeframes. The indicator is fully manual and has control buttons. All you need to do is press the NEW button, a segment will appear, which you can place on any movement, swing or even 1 candle that you want to analyze. By placing the segment, press the OK button. A grid (th
Scalper Inside PRO
Alexey Minkov
4.73 (56)
An exclusive indicator that utilizes an innovative algorithm to swiftly and accurately determine the market trend. The indicator automatically calculates opening, closing, and profit levels, providing detailed trading statistics. With these features, you can choose the most appropriate trading instrument for the current market conditions. Additionally, you can easily integrate your own arrow indicators into Scalper Inside Pro to quickly evaluate their statistics and profitability. Scalper Inside
Dynamic Forex28 Navigator
Bernhard Schweigert
5 (1)
Dynamic Forex28 Navigator: la herramienta de trading de Forex de última generación. ACTUALMENTE CON UN 49 % DE DESCUENTO. Dynamic Forex28 Navigator es la evolución de nuestros indicadores populares de larga data, que combina el poder de tres en uno: Indicador avanzado Currency Strength28 (695 reseñas) + Indicador avanzado Currency IMPULSE con ALERT (520 reseñas) + Señales combinadas CS28 (bonificación). Detalles sobre el indicador https://www.mql5.com/en/blogs/post/758844 ¿Qué ofrece el i
¡Actualmente 20% OFF ! ¡La mejor solución para cualquier novato o trader experto! Este software funciona con 28 pares de divisas. Se basa en 2 de nuestros principales indicadores (Advanced Currency Strength 28 y Advanced Currency Impulse). Proporciona una gran visión general de todo el mercado de divisas. Muestra los valores de Advanced Currency Strength, la velocidad de movimiento de las divisas y las señales para 28 pares de divisas en todos los (9) marcos temporales. Imagine cómo mejorar
TPSproTREND PrO
Roman Podpora
4.79 (19)
TPSpro TREND PRO   es un indicador de tendencia que analiza automáticamente el mercado y proporciona información sobre la tendencia y cada uno de sus cambios, además de dar señales para ingresar operaciones sin volver a dibujar. El indicador utiliza cada vela, analizándolas por separado. refiriéndose a diferentes impulsos: impulso hacia arriba o hacia abajo. ¡Puntos de entrada exactos a transacciones de divisas, criptomonedas, metales, acciones e índices! Versión MT5                   DESCRIPCI
Presentamos ON Trade Waves Patterns Harmonic Elliot Wolfe, un indicador avanzado diseñado para detectar diversas formas de patrones en el mercado mediante métodos tanto manuales como automáticos. A continuación, te explicamos cómo funciona: Patrones Armónicos: Este indicador puede identificar patrones armónicos que aparecen en tu gráfico. Estos patrones son esenciales para los traders que practican la teoría del trading armónico, tal como se popularizó en el libro de Scott Carney "Harmonic Tradi
Scalper Vault
Oleg Rodin
5 (27)
Scalper Vault es un sistema profesional de reventa que le brinda todo lo que necesita para una reventa exitosa. Este indicador es un sistema comercial completo que puede ser utilizado por operadores de divisas y opciones binarias. El marco de tiempo recomendado es M5. El sistema le proporciona señales de flecha precisas en la dirección de la tendencia. También le proporciona señales superiores e inferiores y niveles de mercado de Gann. Los indicadores proporcionan todo tipo de alertas, incluidas
TPA True Price Action indicator reveals the true price action of the market makers through 100% non-repainting signals (except early signals mode) strictly at the close of a candle! TPA shows entries and re-entries, every time the bulls are definitely stronger than the bears and vice versa. Not to confuse with red/green candles. The shift of power gets confirmed at the earliest stage and is ONE exit strategy of several. There are available now two free parts of the TPA User Guide for our custo
Currency Strength Wizard es un indicador muy poderoso que le proporciona una solución todo en uno para operar con éxito. El indicador calcula el poder de este o aquel par de divisas utilizando los datos de todas las monedas en múltiples marcos de tiempo. Estos datos se representan en forma de índice de moneda fácil de usar y líneas eléctricas de moneda que puede usar para ver el poder de esta o aquella moneda. Todo lo que necesita es adjuntar el indicador al gráfico que desea operar y el indicad
El sistema PRO Renko es un sistema de trading de alta precisión especialmente diseñado para operar gráficos RENKO. Se trata de un sistema universal que se puede aplicar a diversos instrumentos de negociación. El sistema neutraliza eficazmente el llamado ruido de mercado, lo que le brinda acceso a señales de reversión precisas. El indicador es muy fácil de usar y solo tiene un parámetro responsable de la generación de señales. Puede adaptar fácilmente la herramienta a cualquier instrumento com
TPSpro RFI Levels
Roman Podpora
4.82 (22)
INSTRUCCIONES      RUSO  -  ING     Se recomienda utilizar con un indicador.   -    TPSpro   TENDENCIA PRO -   Versión MT5 Un elemento clave en el trading son las zonas o niveles desde los que se toman las decisiones de compra o venta de un instrumento de trading. A pesar de los intentos de los principales actores de ocultar su presencia en el mercado, inevitablemente dejan rastros. Nuestra tarea era aprender a identificar estos rastros e interpretarlos correctamente. Funciones principales: ¡Mo
Currency Strength Exotics
Bernhard Schweigert
4.87 (30)
¡ACTUALMENTE 20% DE DESCUENTO ! ¡La mejor solución para cualquier operador novato o experto! Este indicador está especializado en mostrar la fuerza de la divisa para cualquier símbolo como Pares Exóticos, Materias Primas, Índices o Futuros. Es el primero de su clase, cualquier símbolo se puede añadir a la 9 ª línea para mostrar la verdadera fuerza de la moneda de Oro, Plata, Petróleo, DAX, US30, MXN, TRY, CNH etc. Se trata de una herramienta de trading única, de alta calidad y asequible por
Trend Pulse
Mohamed Hassan
5 (4)
Please contact me after purchase to immediately get your PDF strategy + documentation for Trend Pulse !  Introducing Trend Pulse , a unique and robust indicator capable of detecting bullish, bearish, and even ranging trends! Trend Pulse uses a special algorithm to filter out market noise with real precision. If the current symbol is moving sideways, Trend Pulse will send you a ranging signal, letting you know that it's not a good time to enter a trade. This excellent system makes Trend Pulse
MetaBands M4
Vahidreza Heidar Gholami
5 (2)
MetaBands utiliza algoritmos potentes y únicos para dibujar canales y detectar tendencias para que pueda proporcionar a los traders puntos potenciales para entrar y salir de operaciones. Es un indicador de canal junto con un potente indicador de tendencia. Incluye diferentes tipos de canales que se pueden fusionar para crear nuevos canales simplemente utilizando los parámetros de entrada. MetaBands utiliza todos los tipos de alertas para notificar a los usuarios sobre eventos del mercado. Caract
Gold Channel is a volatility-based indicator, developed with a specific timing algorithm for the XAUUSD pair, which consists of finding possible corrections in the market. This indicator shows two outer lines, an inner line (retracement line) and an arrow sign, where the theory of the channel is to help identify overbought and oversold conditions in the market. The market price will generally fall between the boundaries of the channel. If prices touch or move outside the channel it is a tra
Automated Trendlines
Georgios Kalomoiropoulos
5 (16)
Las líneas de tendencia son la herramienta más esencial del análisis técnico en el comercio de divisas. Desafortunadamente, la mayoría de los comerciantes no los dibujan correctamente. El indicador de líneas de tendencia automatizadas es una herramienta profesional para comerciantes serios que lo ayuda a visualizar el movimiento de tendencia de los mercados. Hay dos tipos de Trendlines Bullish Trendlines y Bearish Trendlines. En la tendencia alcista, la línea de tendencia de Forex se dib
Reversal Sniper is designed to find the extreme reversals of the price. Indicator collects data of Cycle Sniper Indicator. NOTE: REVERSAL SNIPER Indicator is made for Cycle Sniper Users as an additional tool.  However, it can be used by the traders who look for finding out strong reversal levels. Indicator works on all timeframes and all instruments. Reversal  Sniper  Checks: Harmonic Patterns RSI Zig Zag and Harmonic Swings Cycle Sniper Indicator's Buy / Sell Signals The complex algo i
¡LEA LA INFORMACIÓN A CONTINUACIÓN ANTES DE COMPRAR EL PRODUCTO! ¡Apollo Pips PLUS SP es un producto único! ¡ES PARA AQUELLOS QUE QUIEREN OBTENER MI NUEVO INDICADOR "APOLLO PIPS" MÁS BONO "SUPER PACK" CON ACCESO A TODOS MIS INDICADORES COMERCIALES! Al comprar el producto Apollo Pips PLUS SP, en realidad está comprando una versión absolutamente nueva de mi indicador Apollo Pips. Esta versión del indicador tiene un algoritmo mejorado y un parámetro fácil de usar que le brinda la oportunidad de uti
Introducing the South African Sniper indicator created by a small group of traders with a few years trading trading the financial market profitably . This is a plug and play indicator that provides you with  BUY and SELL (SNIPER ENTRY) signals with TARGET and trail stops. The indicator Works with all MT4 trading instruments. The indicator uses previous  chart data as receipt to speculate on future market moves.
Este tablero muestra los últimos patrones armónicos disponibles para los símbolos seleccionados, por lo que ahorrará tiempo y será más eficiente / versión MT5 . Indicador gratuito: Basic Harmonic Pattern Columnas del indicador Symbol: aparecerán los símbolos seleccionados Trend : alcista o bajista Pattern : tipo de patrón (gartley, mariposa, murciélago, cangrejo, tiburón, cifrado o ABCD) Entry : precio de entrada SL: precio de stop loss TP1: 1er precio de toma de beneficios TP2: 2º precio de
IX Power MT4
Daniel Stein
5 (5)
IX Power lleva por fin la insuperable precisión de FX Power a los símbolos que no son de Forex. Determina con exactitud la intensidad de las tendencias a corto, medio y largo plazo de tus índices, acciones, materias primas, ETF e incluso criptodivisas favoritas. Puede analizar todo lo que su terminal le ofrece. Pruébalo y experimenta cómo tu timing mejora significativamente a la hora de operar. Características principales de IX Power Resultados de cálculo 100% precisos y sin repintado -
Ultimate Gold Advisor para MetaTrader 4 El Ultimate Gold Advisor es una herramienta tecnológica avanzada diseñada para optimizar la experiencia de trading en MetaTrader 4. Creada para satisfacer las necesidades de los traders más experimentados, este indicador combina precisión, análisis sofisticado y funcionalidad versátil, ofreciendo soporte para tomar decisiones de trading informadas. Ideal para el trading de oro, pero también aplicable a una amplia gama de activos, el Ultimate Gold Advisor p
Order Block Hunter
Noha Mohamed Fathy Younes Badr
5 (6)
Order block hunter indicator is the best indicator for  hunt the order blocks that area where there has been a large concentration of limit orders waiting to be executed Order blocks are identified on a chart by observing previous price action and looking for areas where the price experienced significant movement or sudden changes in direction .This indicator does that for you by using very complicated codes and helps you to take the best areas To buy and sell because it make marks at the best a
Sneaky Busters 4
Mushfiq Faysal
5 (2)
Previous Price : $323.00 Current Price: $359.00 Future Price: Will increase soon NOTICE Please DO NOT buy this indicator if you are just learning about smart money movement . You need to have some experience with accumulation and distribution to fully grasp the gravity of this indicator. Since smart money does not play by the book , so this indicator was only developed to find their trail that they did not bother to hide . If the signals do not correspond to your trading style, this is not the
Otros productos de este autor
Numbers Ticks
Jesus Daniel Quiroga
Este indicador cuenta en tiempo real la cantidad de ticks por segundo y los muestra al lado de cada ultima barra. Ademas, indica con dos señales distintas las determinadas cantidades de ticks que le hayamos asignado a cada señal. Este indicador es especial para detectar si determinados movimientos del precio corresponden con la cantidad de ticks que esperamos del Mercado.
Master IA Power es un EA de alta complejidad matematica que se adapta a los cambios del precio y velocidad, calculando si es conveniente colocar ordenes al mercado. Cuando envia las ordenes, va testeando los lotes convenientes para recoger beneficios estables y consistentes. Y no duda en salir rapidamente del mercado si calcula que no es rentable seguir permaneciendo en el mercado. Master IA Power busca continuamente establecer un equilibrio entre el Balance y la Equidad, sin desviarse de aport
Future Price Markets
Jesus Daniel Quiroga
Future Price Markets es un indicador que a traves del analisis dinamico del precio y el tiempo, proyecta a futuro los precios de toma de beneficios. Para mostrar las proyecciones a futuro del precio utiliza determinadas lineas horizontales, de distinto color y estilo, sea para señal indicar señal de compra o señal de venta o señal futura de toma de beneficios de compra o venta.
Filtro:
No hay comentarios
Respuesta al comentario