FJ William Percent Range Crosses Signal
- Indicadores
- Francisco Jesus Cortes Hidalgo
- Versión: 1.1
- Activaciones: 5
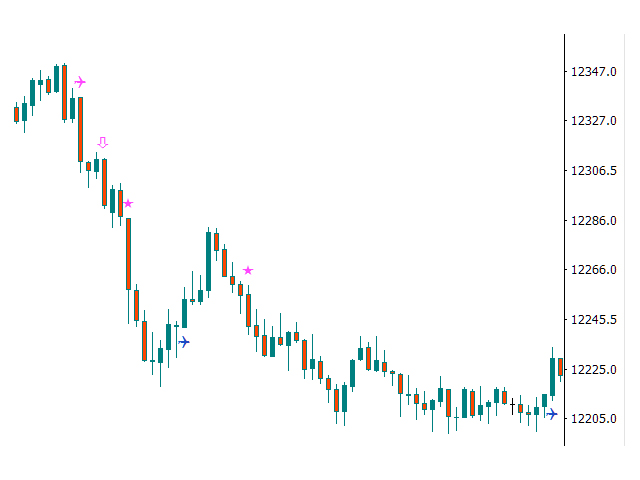
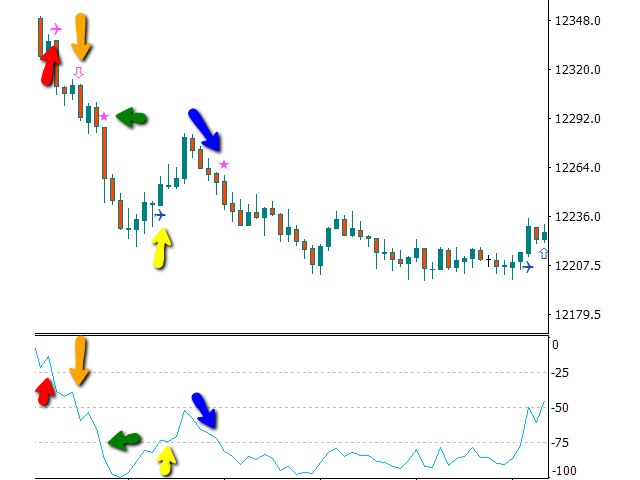
Pinta sobre el gráfico de precio iconos indicando con claridad y sencillez los diferentes cruces que produce la señal del oscilador William %R a su paso por las líneas de sobrecompra, sobreventa, e intermedia.
Permite personalizar:
- Posición de las líneas de sobrecompra, sobreventa
- Todos los iconos
- El color de cada icono
- Periodos a usar en William %R
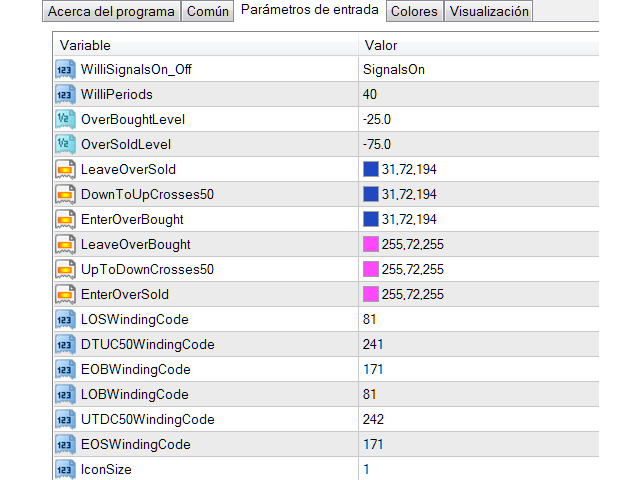
Parámetros:
- WilliSignalsOn_Off: Permite ocultar/mostrar el indicador sin necesidad de tener que suprimir/volver a añadir y configurar este indicador
- WilliPeriods: Periodos con los que configurar el comportamiento base de William %R Oscillator
- OverBoughtLevel: Nivel de sobrecompra, típicamente a -20.
- OverSoldLevel: Nivel de sobreventa, típicamente a -80
- LeaveOverSold: Color del icono que se muestra cuando la señal del indicador abandona SobreCompra
- DownToUpCrosses50: Color del icono que se muestra cuando la señal del indicador cruza desde abajo hacia arriba la línea de -50
- EnterOverBought: Color del icono que se muestra cuando la señal del indicador cruza a SobreCompra
- LeaveOverBought: Color del icono que se muestra cuando la señal del indicador cruza desde SobreCompra y sale de ella
- UpToDownCrosses50: Color del icono que se muestra cuando la señal del indicador cruza desde arriba hacia abajo la línea de -50
- EnterOverSold: Color del icono que se muestra cuando la señal del indicador cruza a SobreVenta
- LOSWindingCode: (Leave OverSold) icono que se muestra cuando la señal del indicador abandona SobreCompra
- DTUWindingCode: (Down To Up) icono que se muestra cuando la señal del indicador cruza desde abajo hacia arriba la línea de -50
- EOBWindingCode: (Enter OverBought) icono que se muestra cuando la señal del indicador cruza a SobreCompra
- LOBWindingCode: (LeaveOverBought) icono que se muestra cuando la señal del indicador cruza desde SobreCompra y sale de ella
- UTDWindingCode: (UpToDownCrosses50) icono que se muestra cuando la señal del indicador cruza desde arriba hacia abajo la línea de -50
- EOSWindingCode: (EnterOverSold) icono que se muestra cuando la señal del indicador cruza a SobreVenta
- IconSize: Tamaño del icono a usar en la ventana de gráfico
Dónde elegir los códigos windings: https://docs.mql4.com/constants/objectconstants/wingdings
En las imágenes de ejemplo:
- El avión representa las salidas de zona de sobrecompra y sobreventa
- Las flechas el paso por la línea de -50
- Las estrellas, la entrada del indicador en las zonas de sobrecompra y sobreventa