EZT Stochastic
- Indicadores
- Tibor Rituper
- Versión: 1.0
- Activaciones: 10
EZT_Stochastic
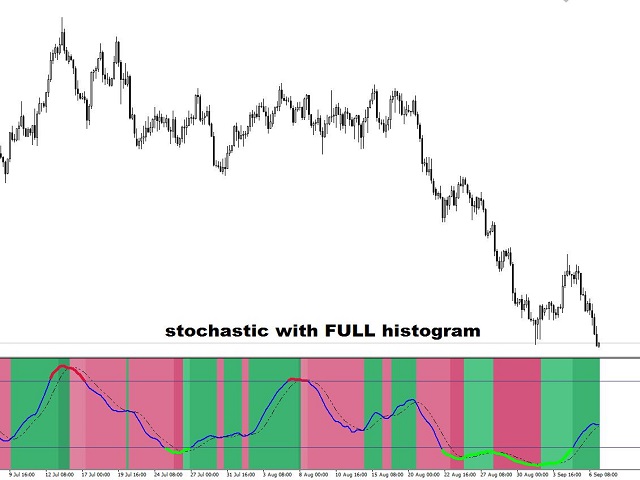
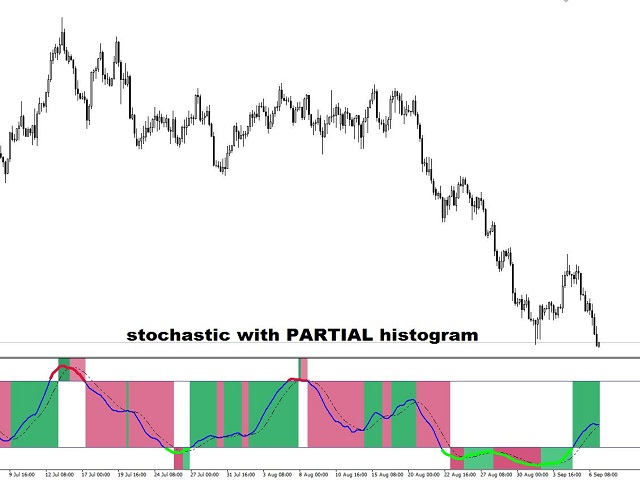
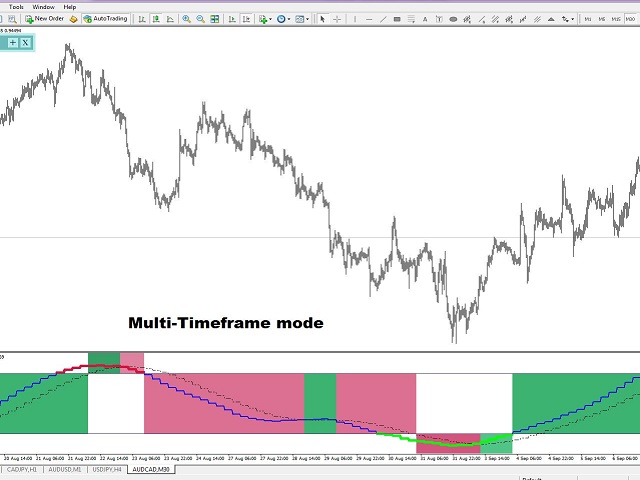
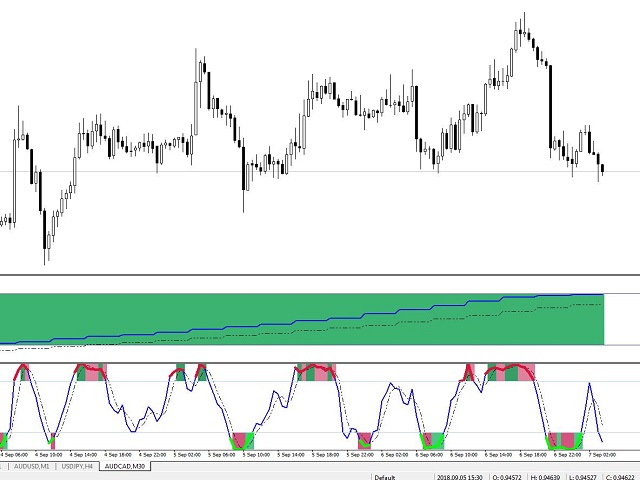
This is a Multi Timeframe stochastic indicator, with colored background. The colored background can be set to different colors based on the K and D line, (moving up, or down), and also about the position of the lines.
In the oversold or overbought zones you can choose different colors.
Settings:
You can choose the time-frame you want to see the stochastic.
Set the regular parameters in a same way like in the original stochastic.
- Histogram style: The style.
- Histogram width: The width.
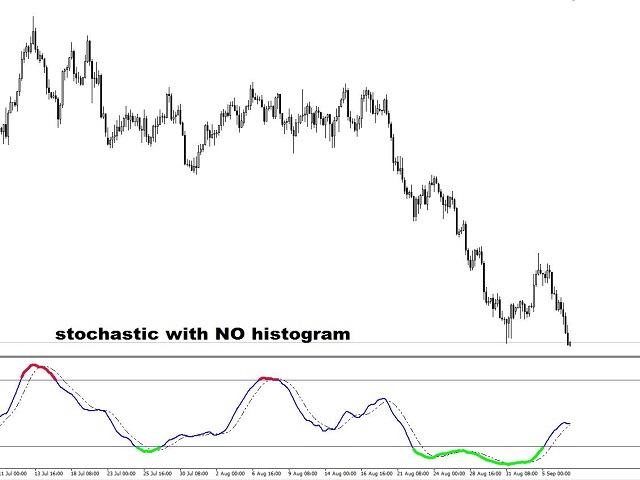
- Histogram Drawing: Choose from 3 options: “No Histogram”, “Full Histogram”, or “Partial Histogram” (See picture examples.)
You can set the oversold and overbought levels. (The default are: 20-80)
The background colors:
- Oversold UP color: The stochastic are below the 20 level and K line crossed D line up.
- Up color: The stochastic K line crossed up the 20 levels and goes until the D line crossed up the 80 level, or the K line cross D line down.
- Overbought up color: The stochastic D line crossed up 80 level, and goes until K line cross down the D line.
- Overbought down: The stochastic are above the 80 level and K line crossed D line down.
- Down color: The stochastic K line crossed down the 80 levels and goes until the D line crossed down the 20 level, or the K line cross D line up.
- Oversold down: The stochastic D line crossed down 20 level, and goes until K line cross up the D line.
You can chose the levels color and style.
You can chose the stochastic K and D line style, width and color, and for the K line you can set separate colors for oversold and overbought zones.
















I really love this indicator so much!! Best on this forum. The histogram makes it so easy to read. 10 star!