Moving Average Angle
- Indicadores
- Bacha Rehman
- Versión: 1.3
- Actualizado: 6 diciembre 2019
- Activaciones: 20
This indicator shows you the angle of the moving average according to your settings in a separate window. It also shows the angle written on the chart, which can also be adjusted. The main features and input variables provided include:
- MAPeriod: This is the period for your moving average. The default MAPeriod is 5.
- LookBack: This is a very important variable. It allows you to set the look back bar, from which the angle will be measured. For example, if your LookBack is 5, then indicator will calculate the angle from the last 5th bar. Default value is 5.
- MAMode: It allows you to select the type of the moving average (SMA=0, EMA=1, SMMA=2, LWMA=3 etc). Default value is 0 (Simple Moving Average).
The following input variables are for the angle displaying settings on the chart:
- Corner: 0 = Top Left Corner, 1 = Top Right, 2 = Bottom Left, 3 = Bottom Right Corner. Default is 0.
- FontSize: Select the font size for the chart angle display text. Default is 8.
- Color: Text color.
Please note that all the above variables can be adjusted according to your settings.
Also, this indicator can be used in any Expert Advisor, once you have developed your strategy through moving average angle.
The main benefit of this indicator is to avoid ranging markets.
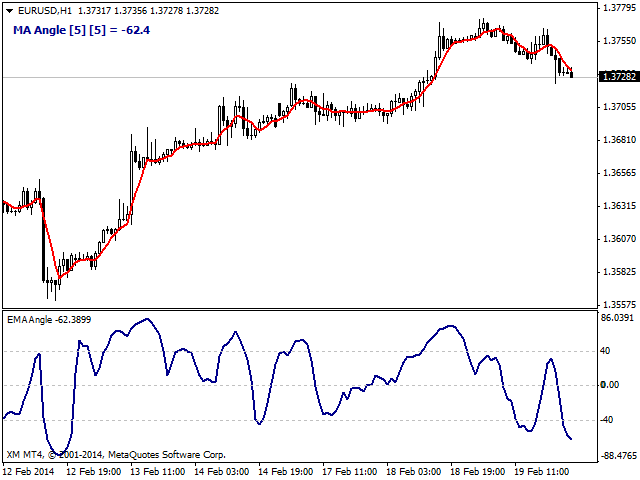
The displaying text of MA angle is in format of "MA Angle [MAPeriod] [LookBack] = Angle". For example, if your angle is 45 with the default settings, then it will display "MA Angle [5][5] = 45" on the chart. Also, it will be indicated with the line in a separate window. Please have a look at the screenshots.
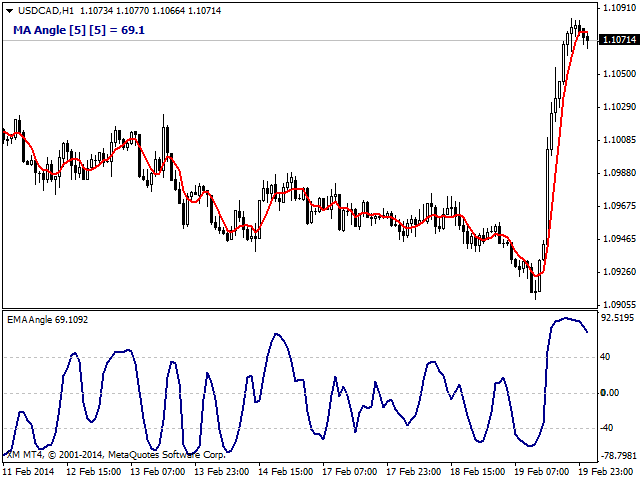
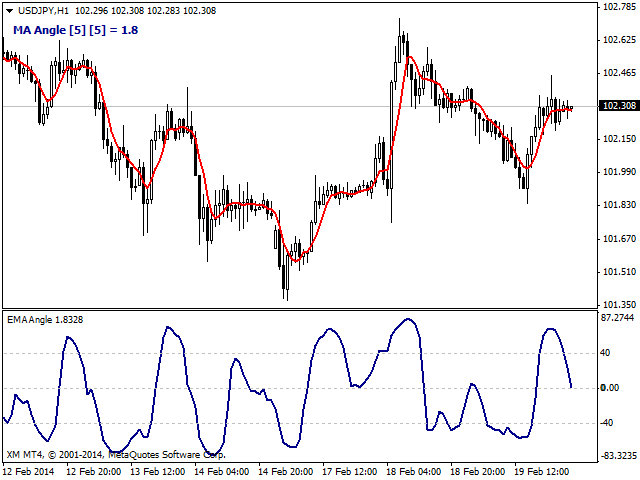
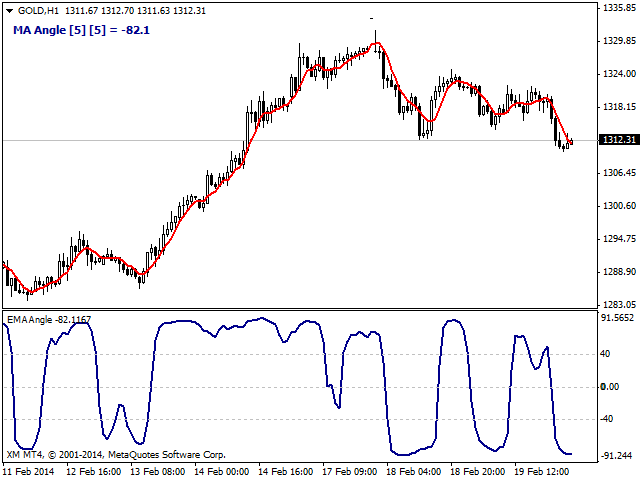


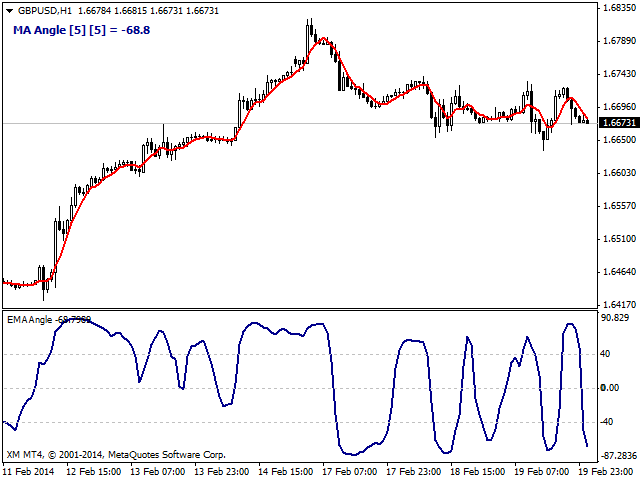
This indicator is very useful with identifying strong trends and avoiding ranging markets. Great tool