SDX Chart
- Indicadores
- Tsvetan Tsvetanov
- Versión: 1.0
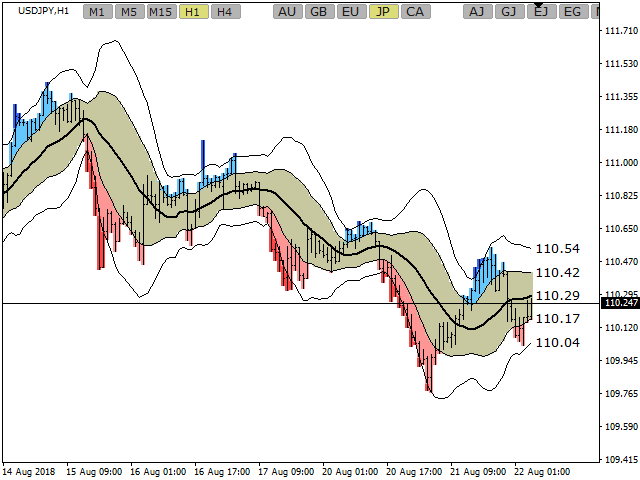
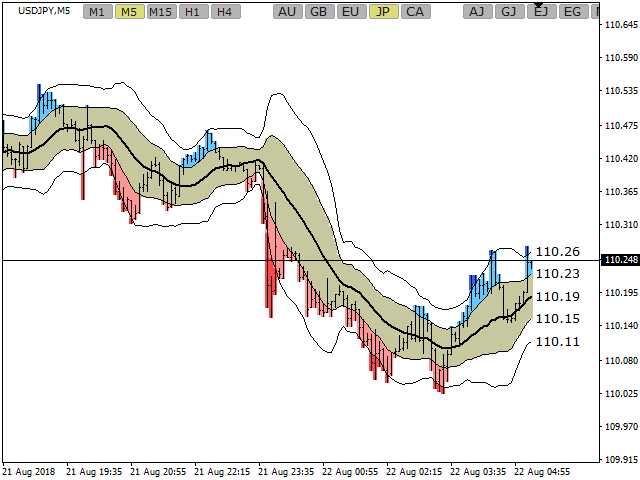
The SDX Chart is a free additional indicator which can be used in combination with SDX Dashboard.
Features
- Ability to review the history of each symbol and time frame.
- Ability to change symbols and time frames with one click.
- Works perfectly in combination with SDX Dashboard and helps you to understand the system better.
Settings
- MA Period - number of periods for the calculation of the moving average and the standard deviation.
- Number of Bars - how far back to draw the indicator.
- Buttons Size Multiplier - increase or decrease the size of the buttons.
- Font Size Multiplier - increase or decrease the size of the font.
- Horizontal Distance - horizontal position of the buttons.
- Vertical Distance - vertical position of the buttons.
- Chart Auto Set - enable or disable the automatic chart configuration.
- Inputs for the 10 symbols and their short names.
- Select the 5 time frames.
Note! You can test SDX Dashboard by downloading the free limited version from here.
If you have some questions, or if you need help, contact me via PM.













BEST YET