AST personov
- Indicadores
- Dariusz Grywaczewski
- Versión: 112.0
- Actualizado: 22 agosto 2018
- Activaciones: 5
AST_personov is an indicator, which presented of the arithmetic average of the ticks.
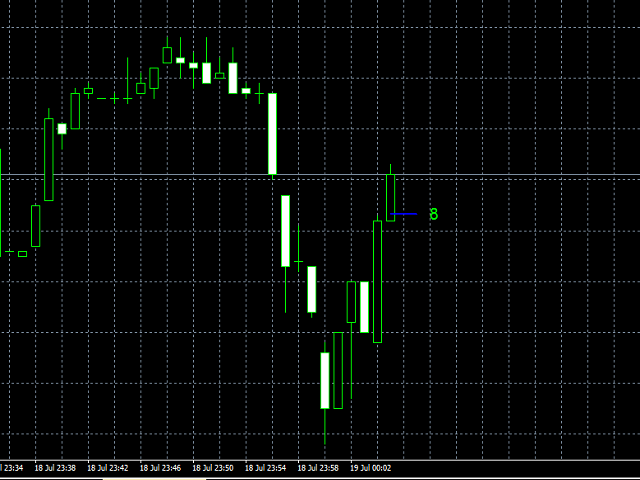
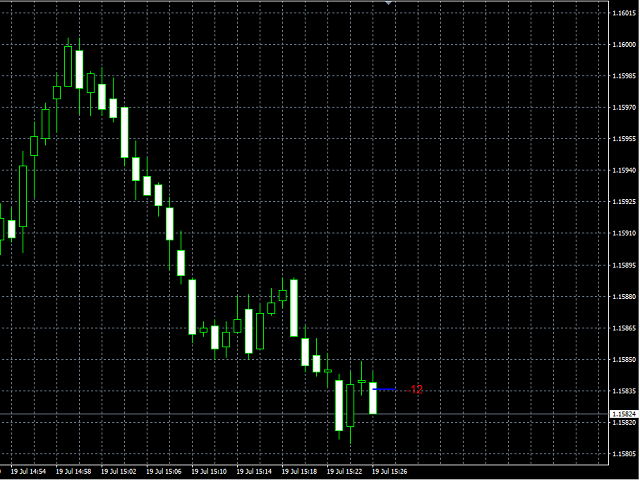
Next to the current price, a line appears with the value of the AST deviation from the current price (in points).
If the value is positive, it is green and if it is negative, it is red.
What is the arithmetic average of the ticks ?
This is the average of the last ticks that the price move.
It has nothing to do with bars ( prices Open, Close, High and Low ).
Calculations are carried out using ticks.
The values change, of course, with each tick because then the calculated average changes.
As a result, we get an indication of whether the price is escaping up or down.
This can be used to open the position ( if the price is far from AST, it means that the price has break out ).
You can also use this to close positions instead of TrailingStop.
In the attached movie, I present how AST works at an accelerated pace ( backtester ).
This way you can see how it works.
In the settings, choose :
- periodAST - how many ticks should be counted AST.
- Color - AST line color.
AST_personov can be used on any chart, on any TF and on any instrument.








Better if indicator plots previous bars values as well