Monalisa Bollinger Bands
- Indicadores
- Valter Pegoraro
- Versión: 1.0
- Activaciones: 5
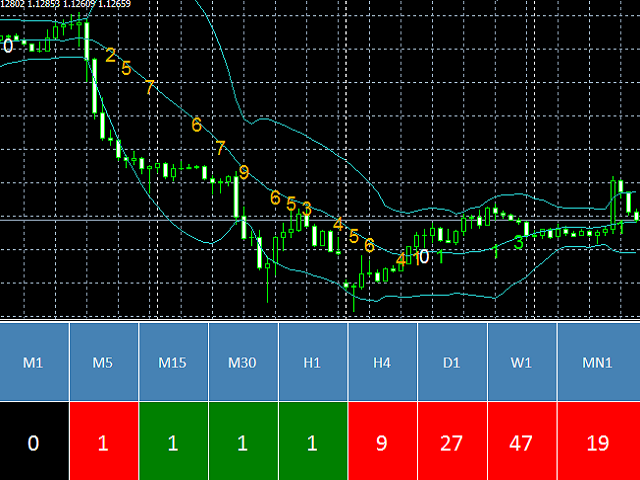
"MONALISA (acronym of MONitor And LISt All) Bollinger Bands" is an indicator based on the Bollinger Bands indicator on all timeframes of any Currency Cross Pair.
The indicator shows all Timeframes (from M1 to MN1) and colors in GREEN or RED that Timeframe that results in BUY or SELL based on the Bollinger Bands indicator.
In addition, this indicator measures the "POWER" of the Trend that is highlighted on the middle line of the Bollinger Bands (SMA line) and in the table of Timeframes with a number (1, 2, 3,...).
The higher the number, the stronger the Trend.
This is useful for detecting when the trend is becoming strong (so it may be suitable to open an order) and when it is becoming weak (so it may be suitable to close an order).
This indicator is useful because it allows you to have a complete view of all Timeframes at the same time.
Features
Easy flexible settings:
- Detection of the Bollinger Bands trend for all timeframes
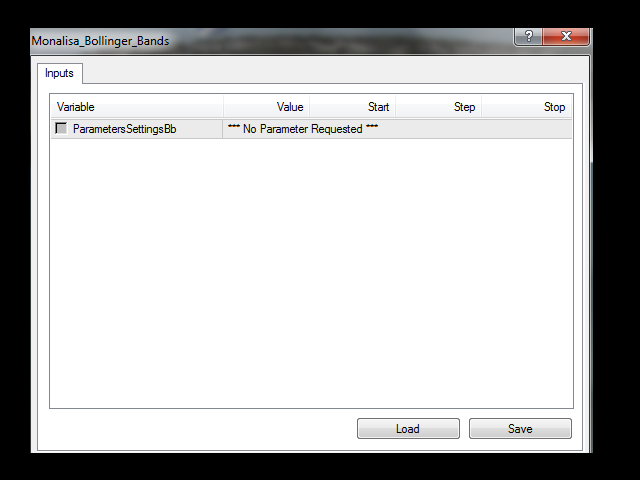
- No setting levels. The indicator uses the Bollinger Bands standard parameters:
- Bands Period = 20
- Bands Shift = 0
- Bands Deviations = 2.0
