DYJ T3ModeMA
- Indicadores
- Daying Cao
- Versión: 1.46
- Actualizado: 20 enero 2024
- Activaciones: 5
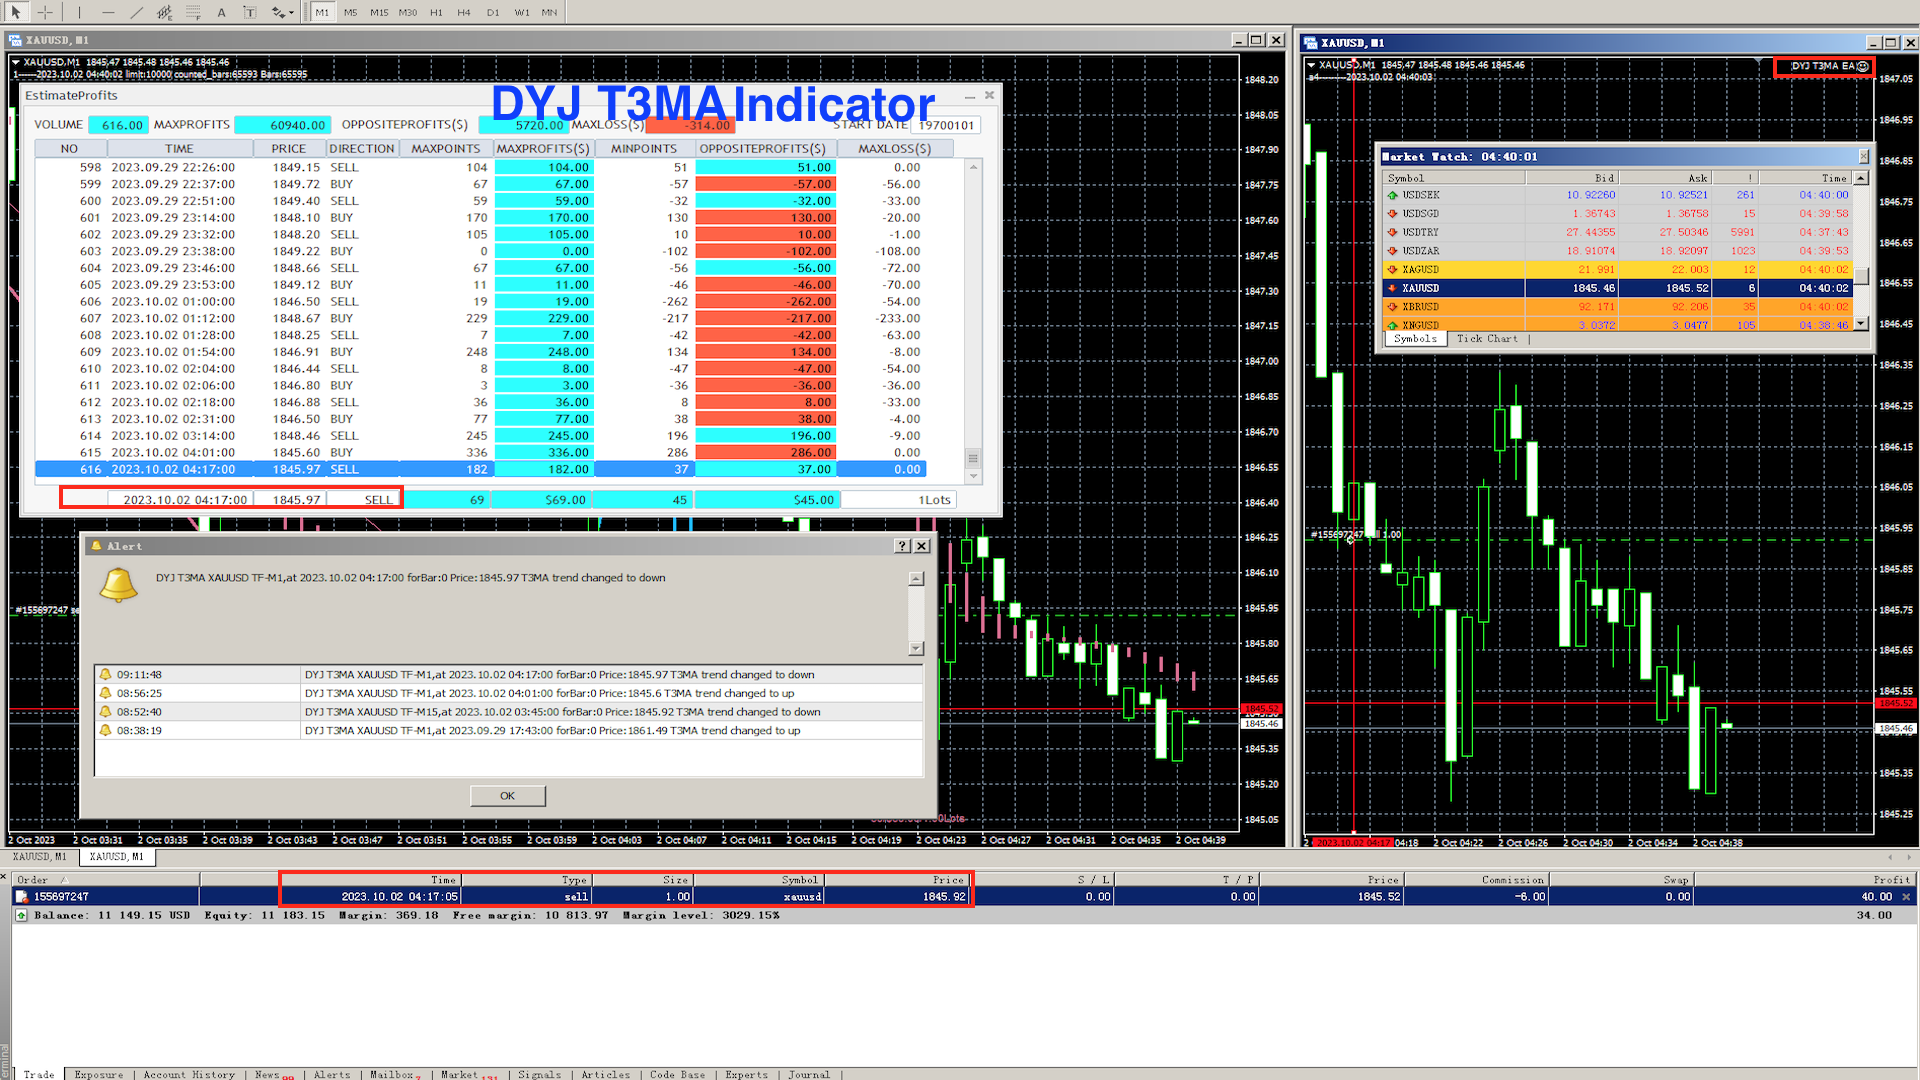
DYJ T3ModeMA se basa en el algoritmo T3.
El algoritmo T3 se introdujo en el campo del análisis técnico en el artículo “Better Moving Averages”, publicado en la revista estadounidense TASC.
T3 suaviza las series de precios al tiempo que reduce el retraso en el sistema de seguimiento de tendencias.
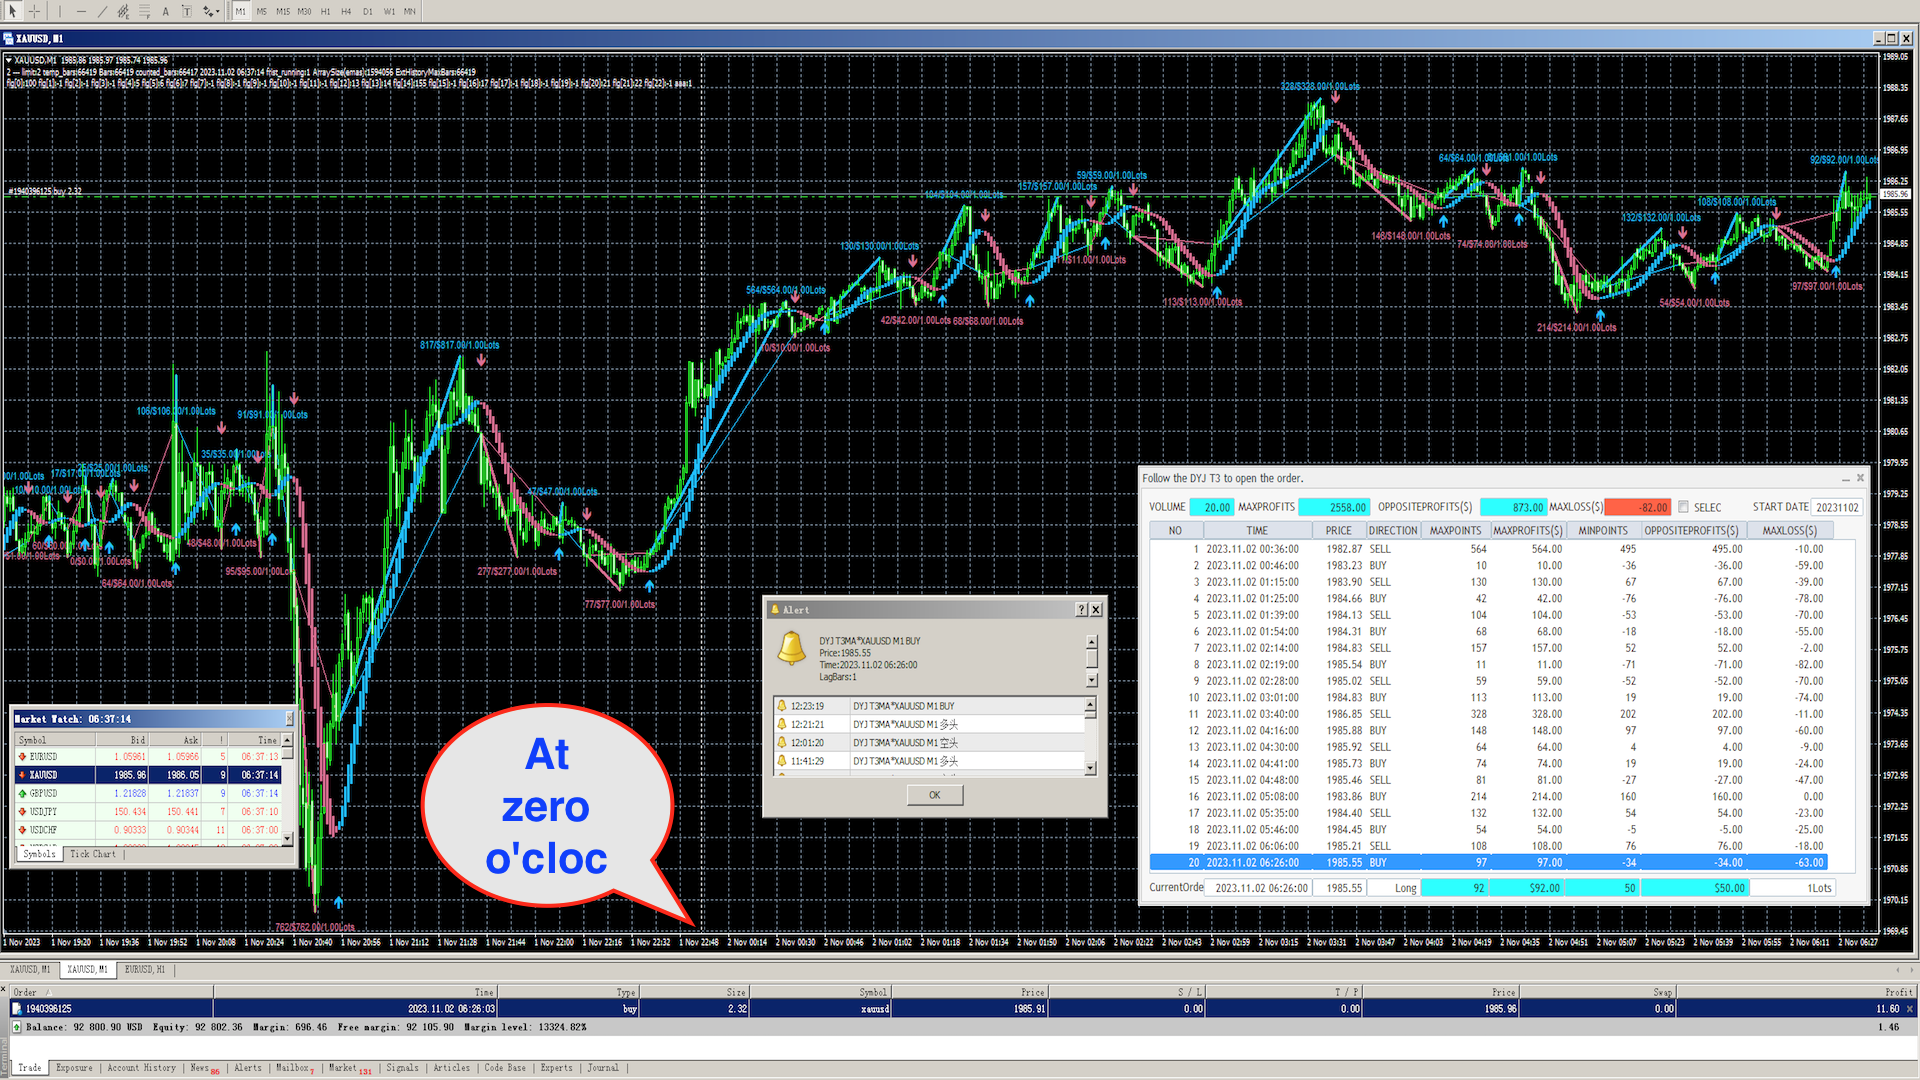
El tamaño de la columna del indicador determina la señal de entrada, y cuando el tamaño de la columna se acerca a 0, es el punto de inflexión de la tendencia.
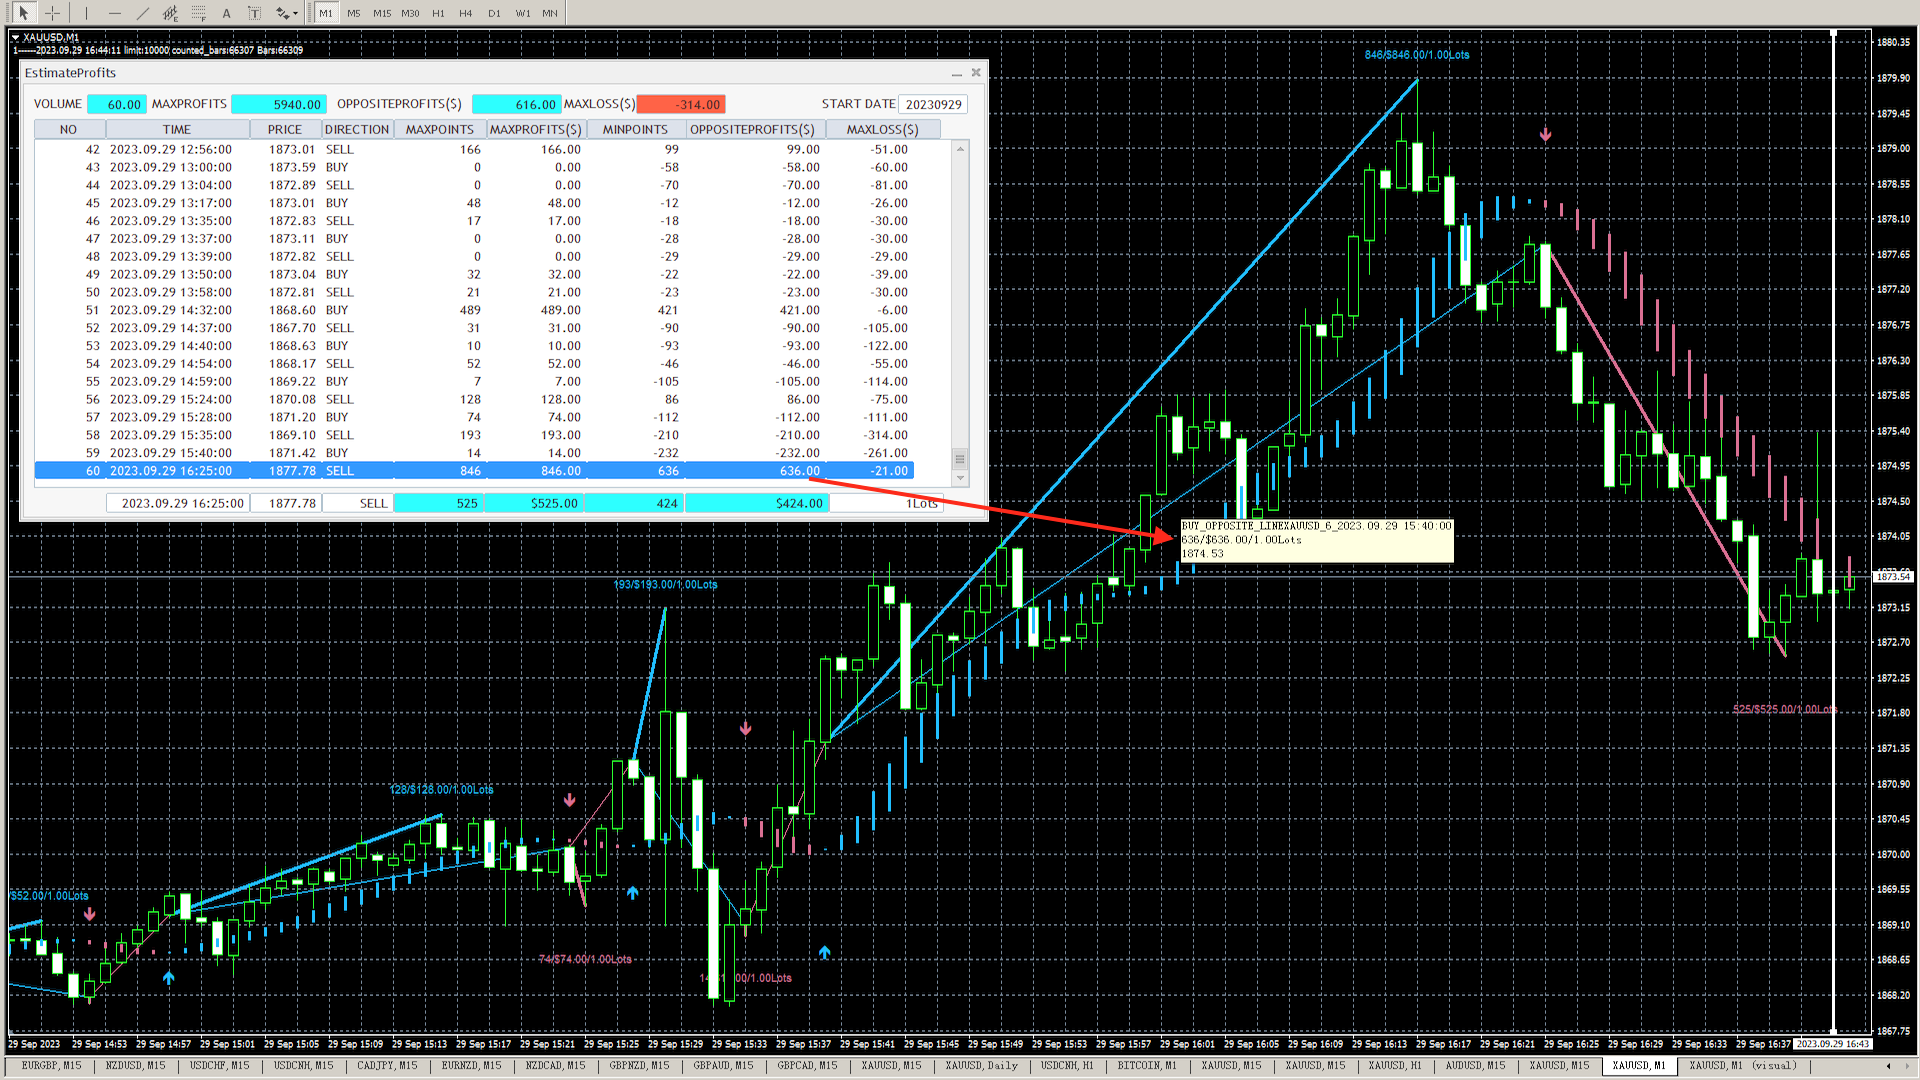
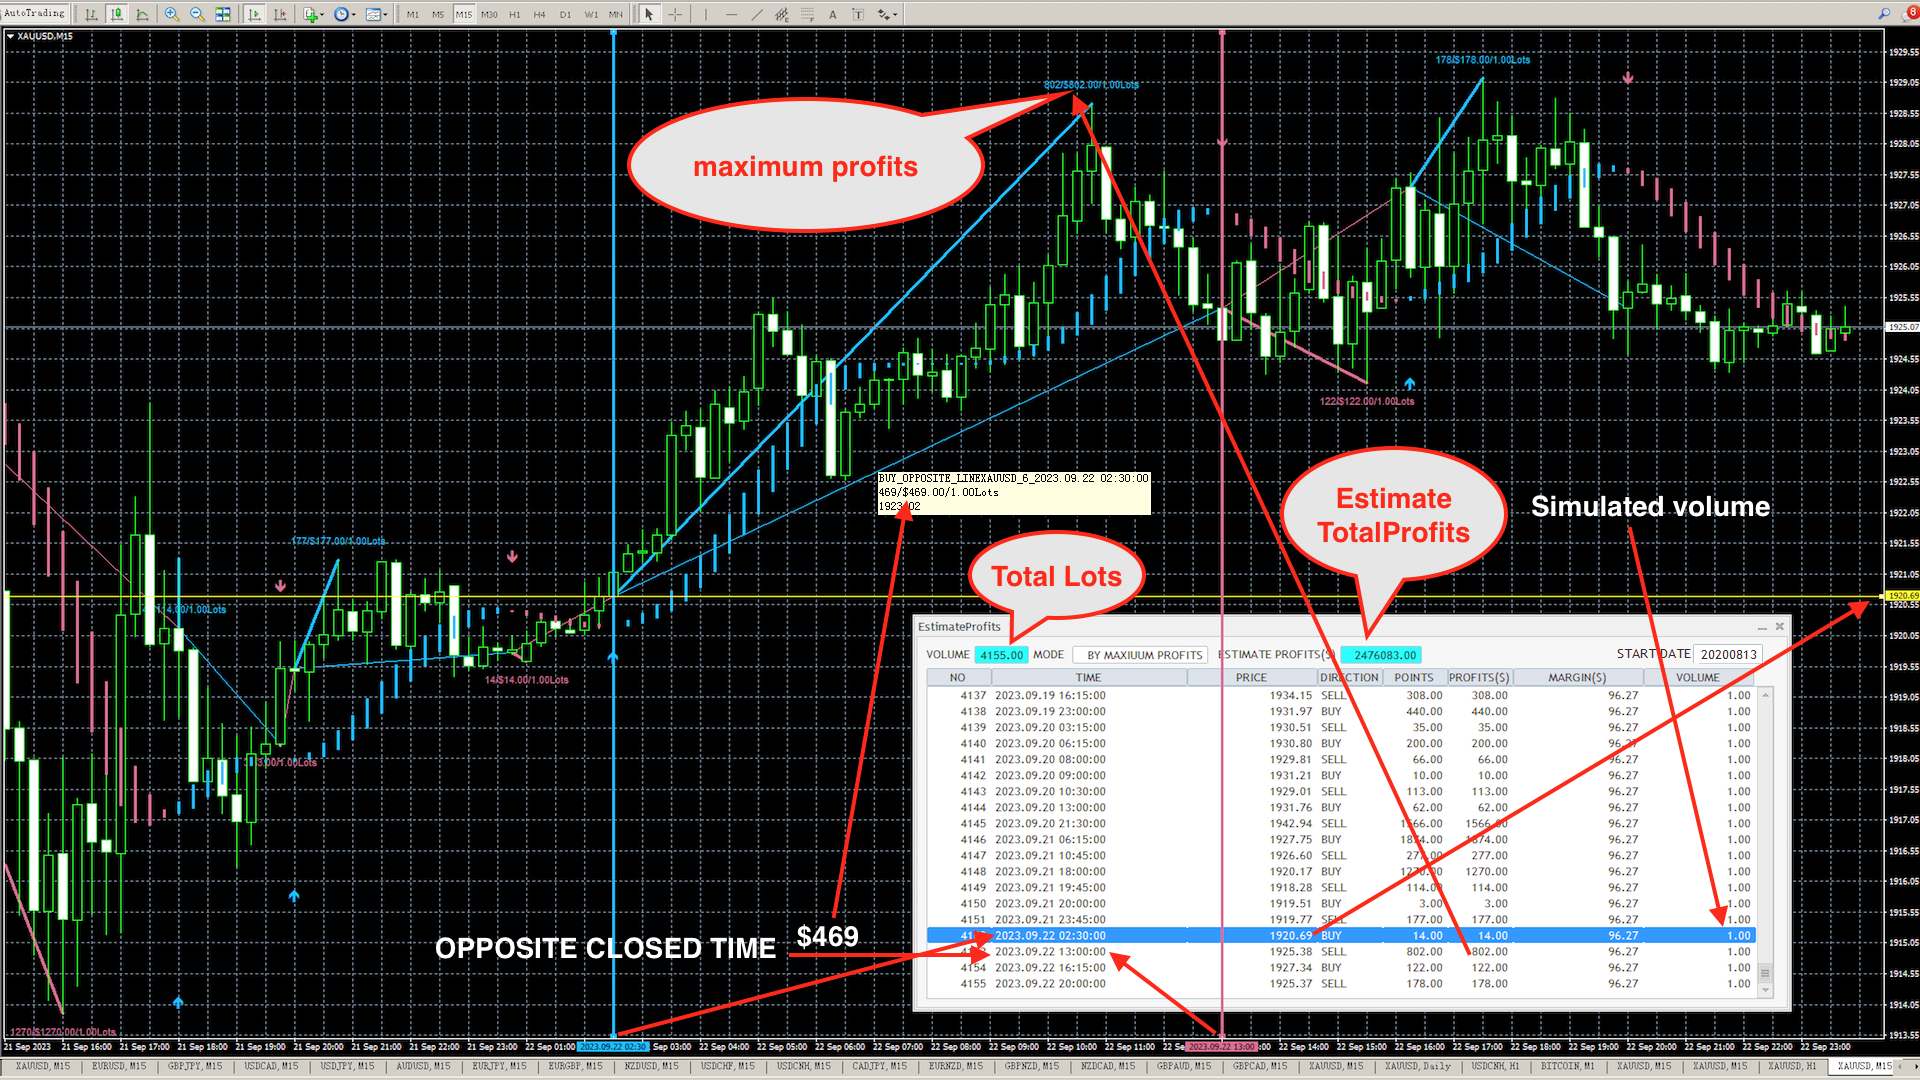
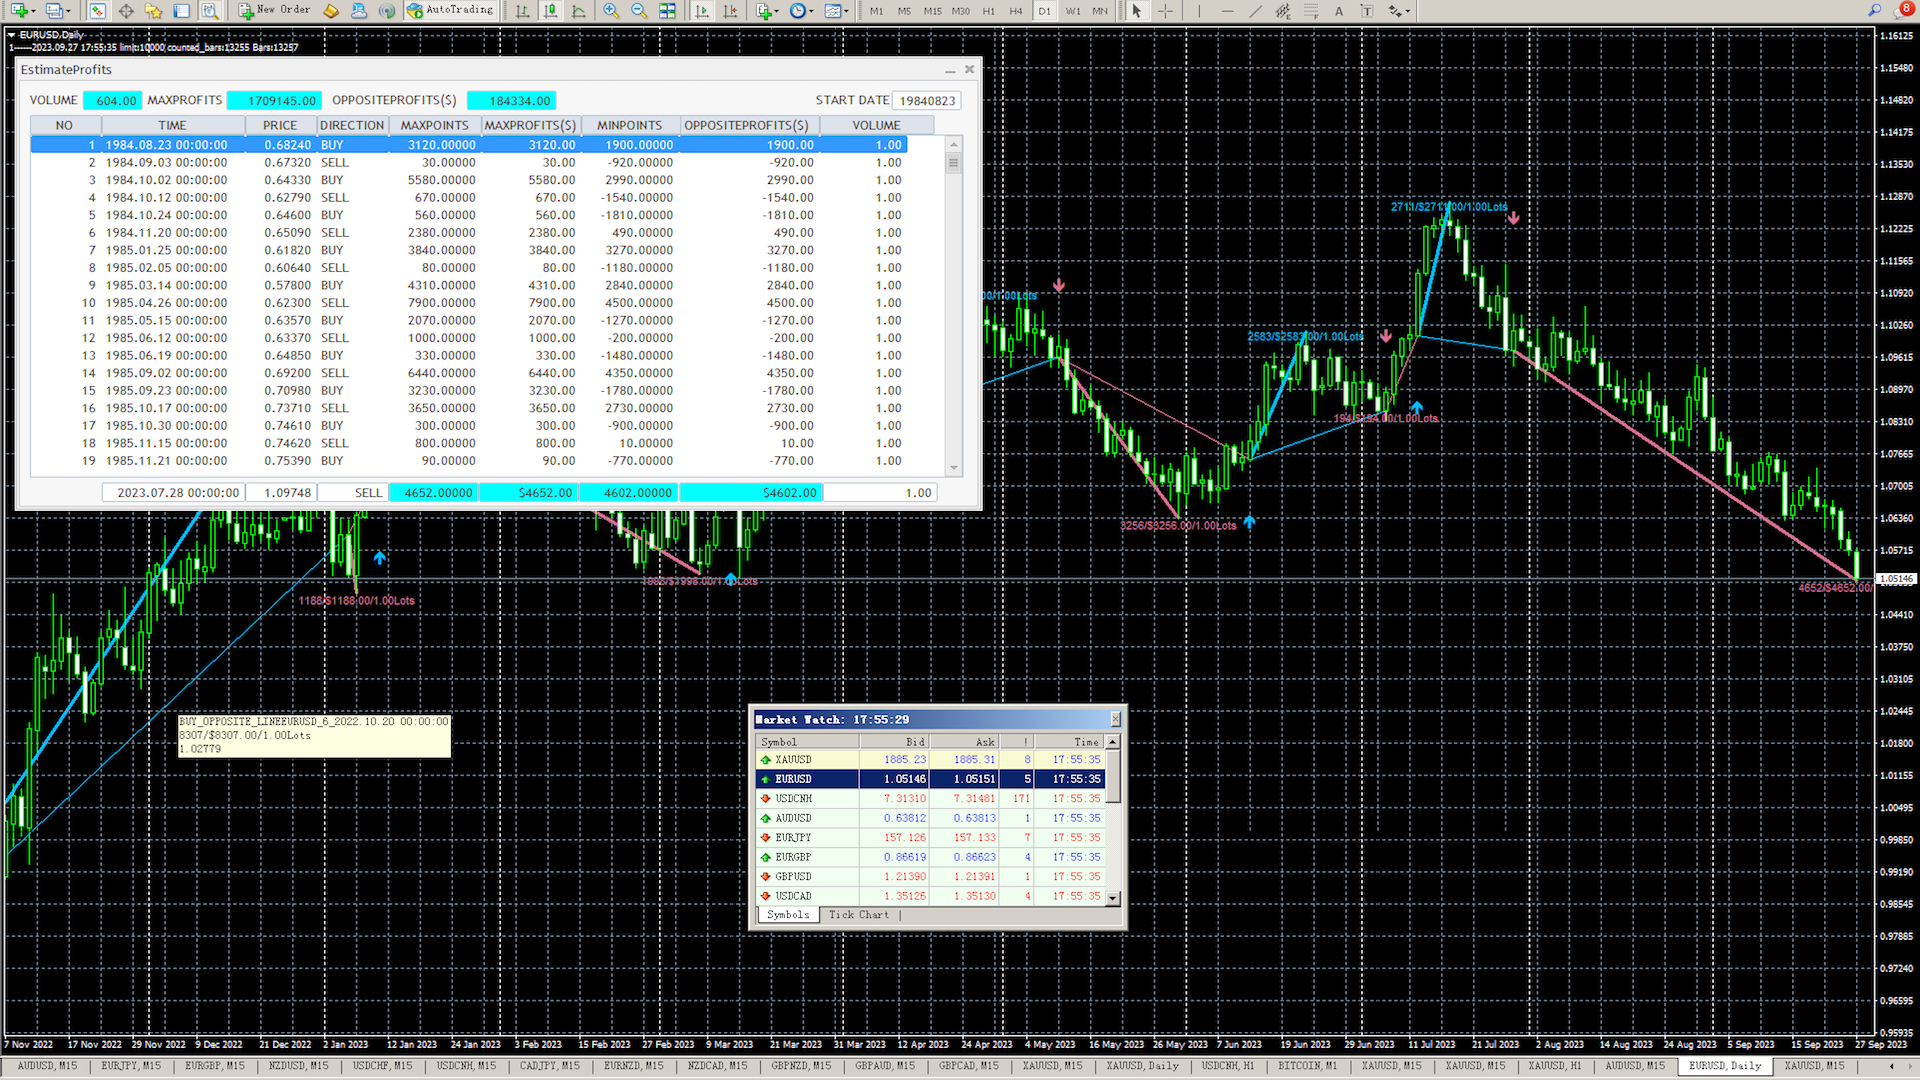
El indicador utiliza técnicas de negociación simulada,
Proporciona indicadores para evaluar la rentabilidad general de las señales de apertura y cierre.
Es conveniente comerciar con el modo de evaluación que utilices.
Cuando elige el modelo de máxima ganancia para evaluar el modelo,
Le recomendamos que utilice la función de detección de pérdidas.
Esto maximiza el seguimiento de las ganancias de tendencia.
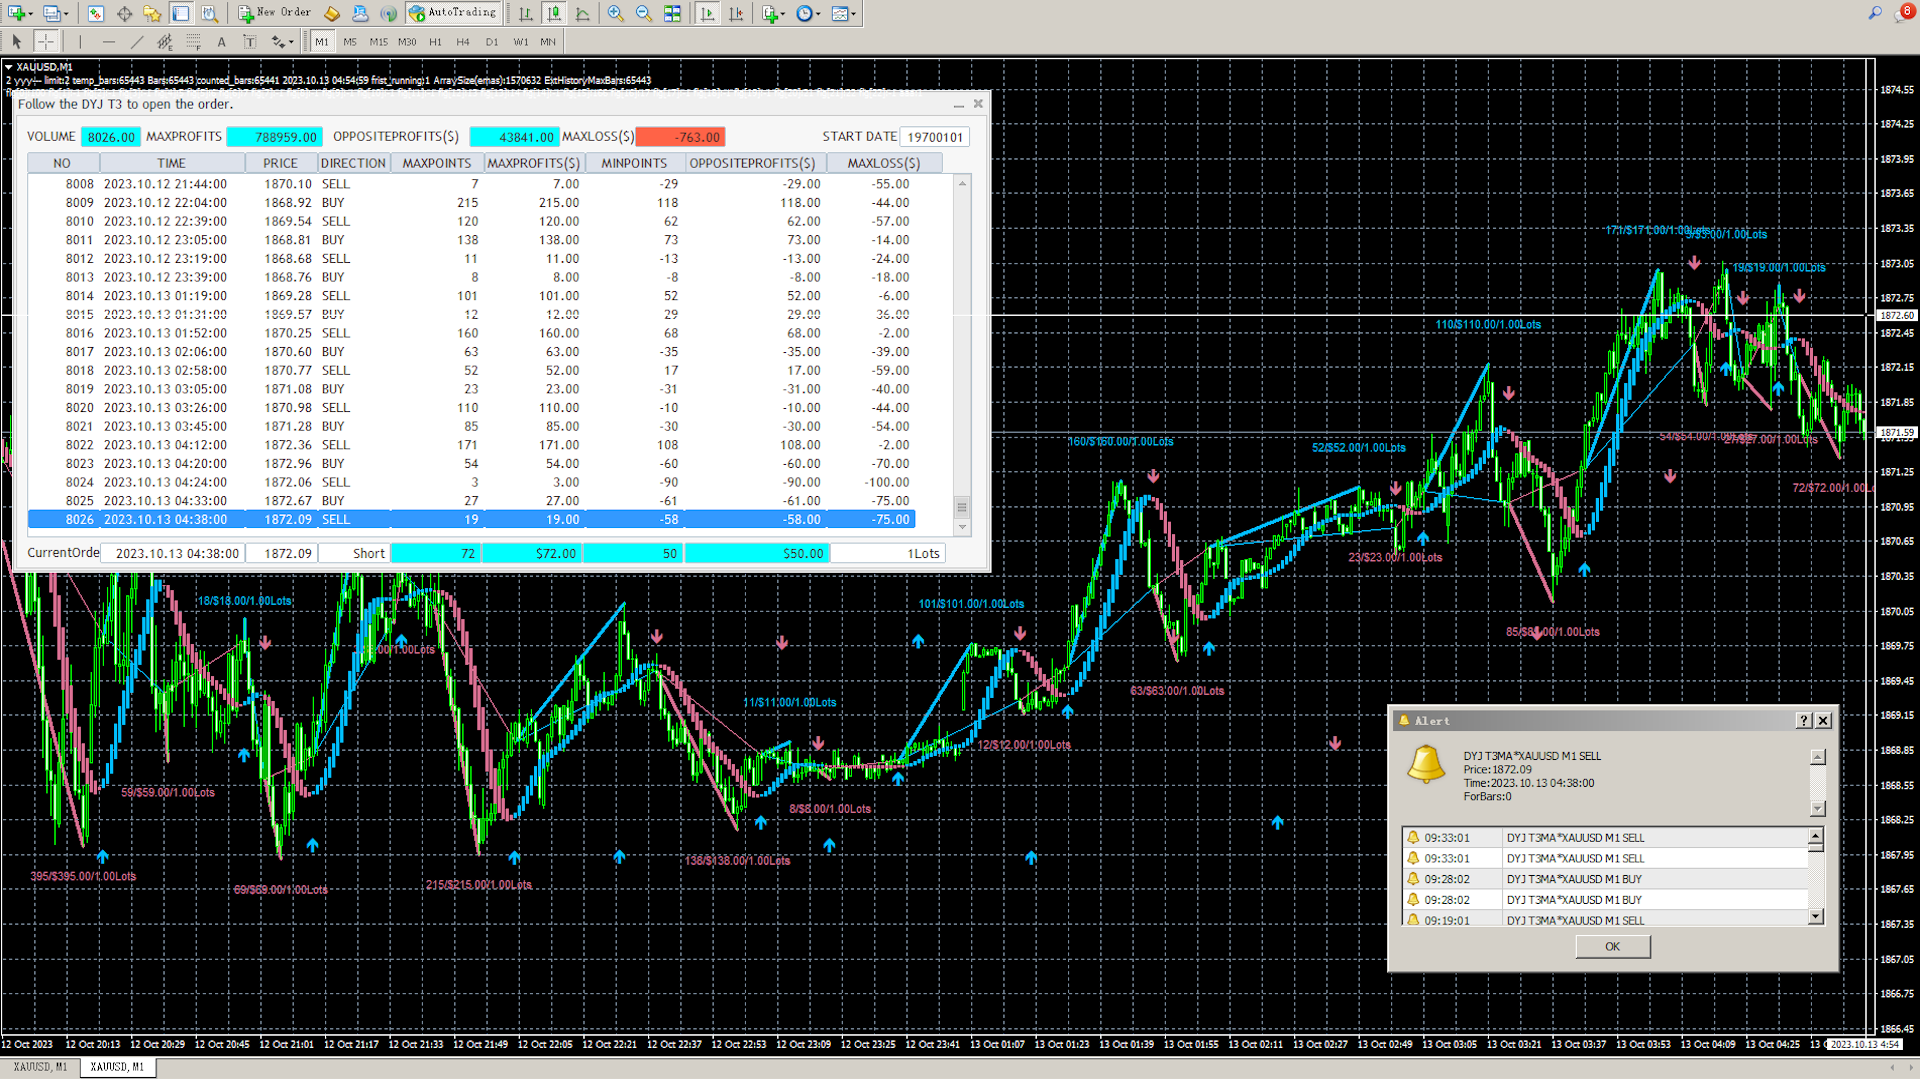
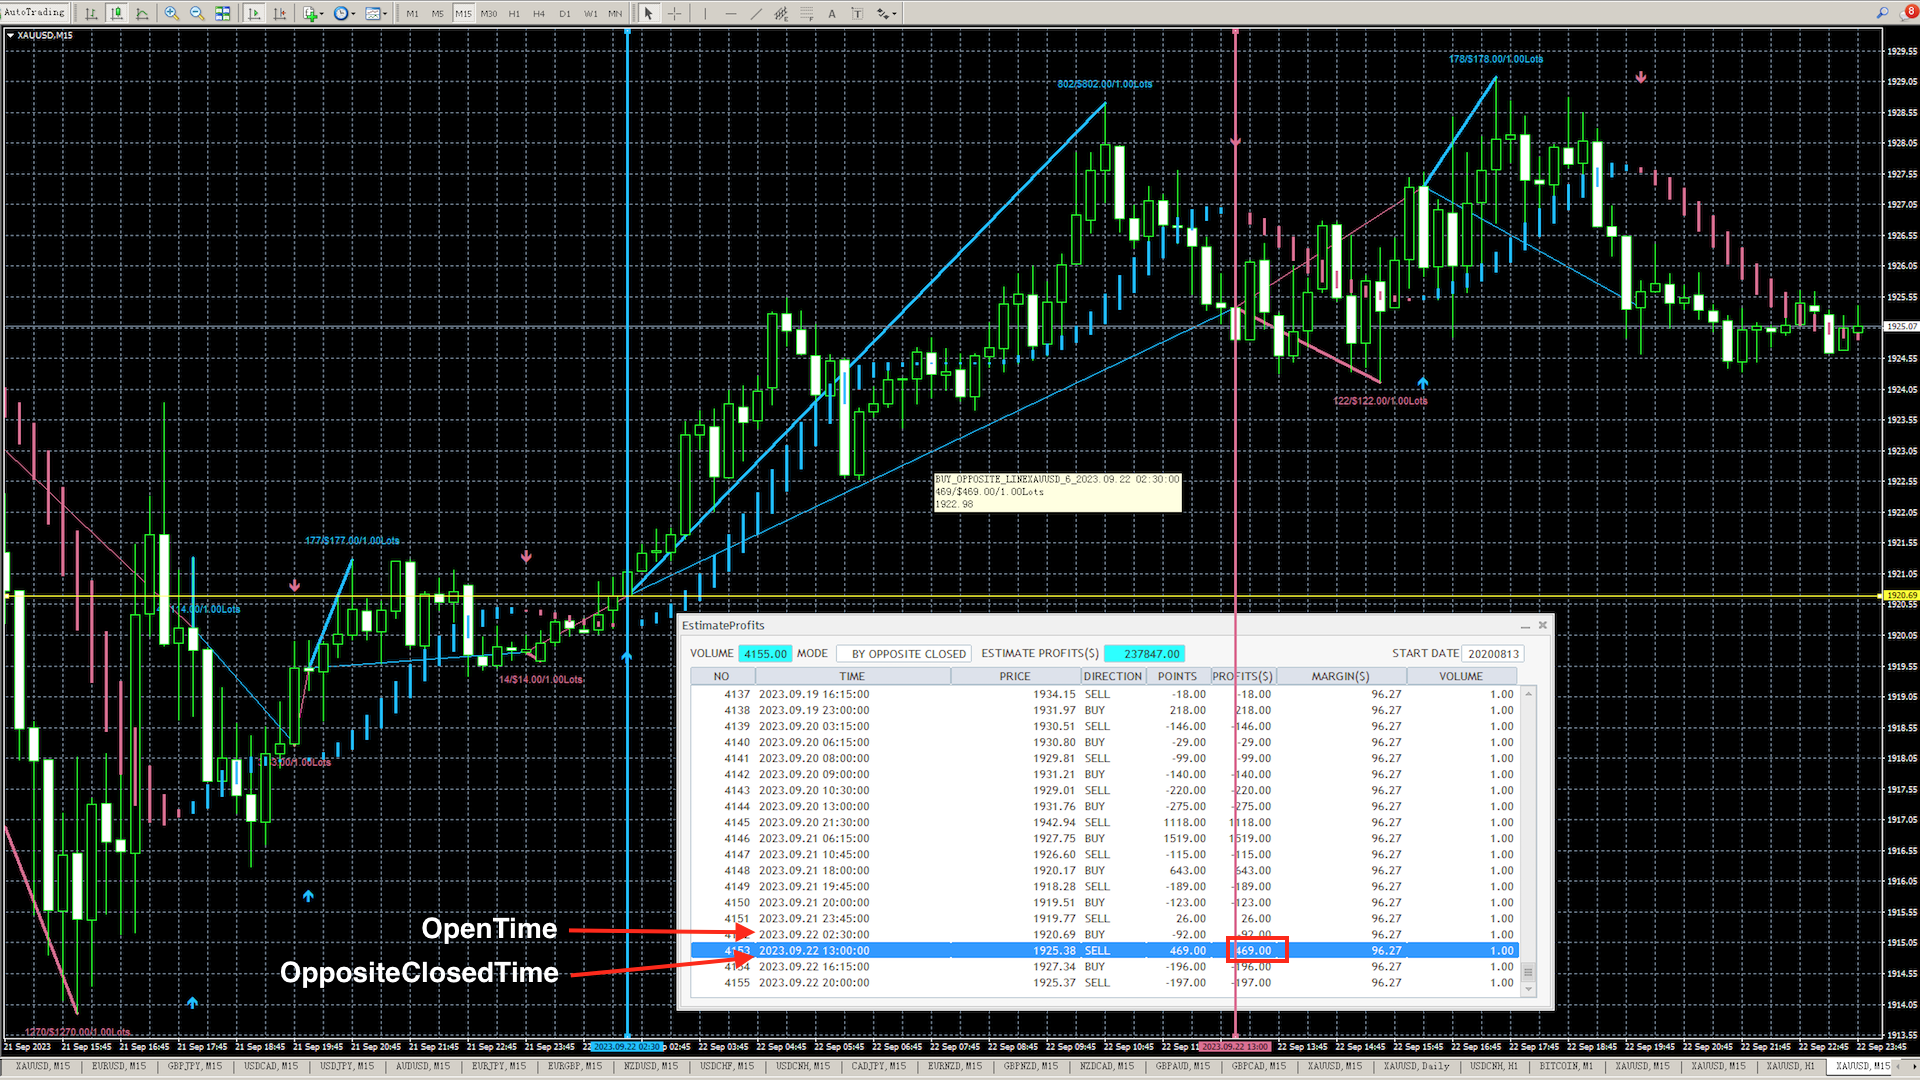
Cuando selecciona la señal opuesta para desactivar el modo de evaluación,
Te aconsejamos que esperes pacientemente hasta que aparezca la señal opuesta.
Esto puede esperar hasta que la tendencia realmente termina y es rentable.
Si necesita seguir automáticamente la apertura y la posición del índice, descargue el software de utilidad DYJ Follow Me.
Input
[Indicator]
InpMaMetod = 2 -- Moving Average method(0~3):0-Simple averaging; 1-Exponential averaging; 2-Smoothed averaging;3-Linear-weighted averaginInpMaPeriod = 6 -- MA Period
InpT3Period = 9 -- T3 algorithm period
InpT3Hot = 0.70 -- T3 Polynomial coefficient
InpShowArrows = true
InpAlertsOn = true
ArrowUpClr = DeepSkyBlue -- Arrow Up Color
ArrowDnClr = PaleVioletRed -- Arrow Down Color
InpIsDisplayIndicatorLine = true -- Display Line Of Indicator
[EstimateProfits]
InpSimulatedVolume = 1 -- SimulatedVolume . 0.01Lots or more
InpOnlyOppositeClosedLine = false -- Only the OppositeClosed line is displayed.
InpIsDisplayChartText = true -- Hide All Text Of Chart
InpIsDisplayProfitsLine = true -- Hide All Line Of Chart
MaxProfitsTextHigh = 40 -- Maximum profit label height
MaxProfitsTextLow = 20 -- Minimum profit label height(opposite)
InpIsEstimateDialog = true -- Hide Or Show EstimateDialog
InpModeProfits = ByMaxProfits -- ByMaxProfits or ByOppositeClosed
InpStartDate = "19700101" -- Statistical start date
不知道怎么安装,没找到安装的地方?麻烦看能否快速协助指导一下,谢谢。