RCCMA Custom Moving Average for RCC
- Indicadores
- Yutaka Okamoto
- Versión: 1.1
- Actualizado: 28 abril 2023
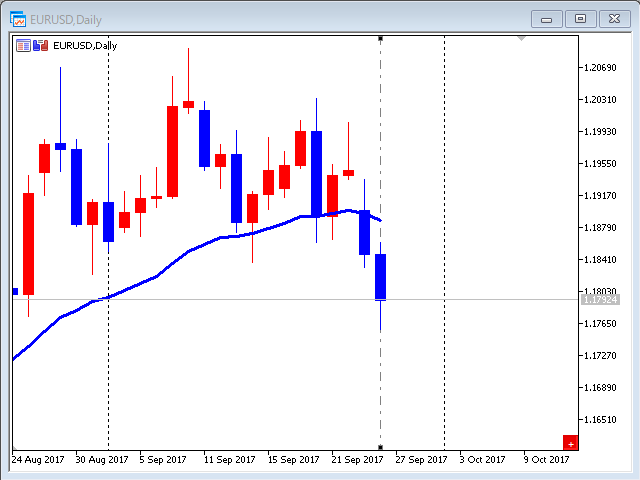
RCCMA is a general moving average indicator that works with ReviewCandleChart.
Original is "Custom Moving Average" provided by MetaQuotes Software Corp. Based on that source code, I corresponded to ReviewCandleChart.
Advantages
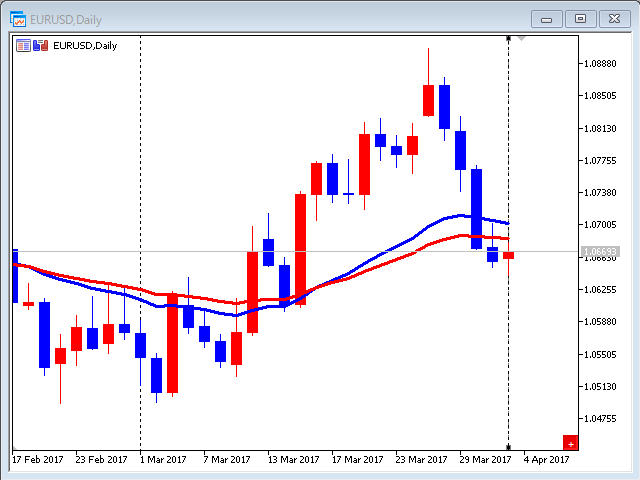
- When ReviewCandleChart is ON, no line will be displayed on the right side from the vertical reference line.
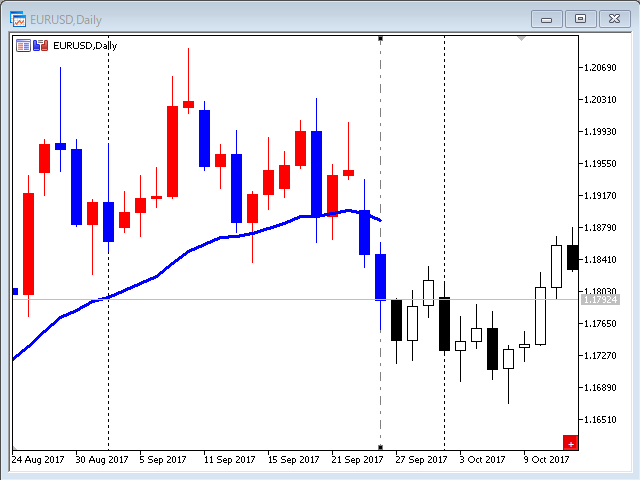
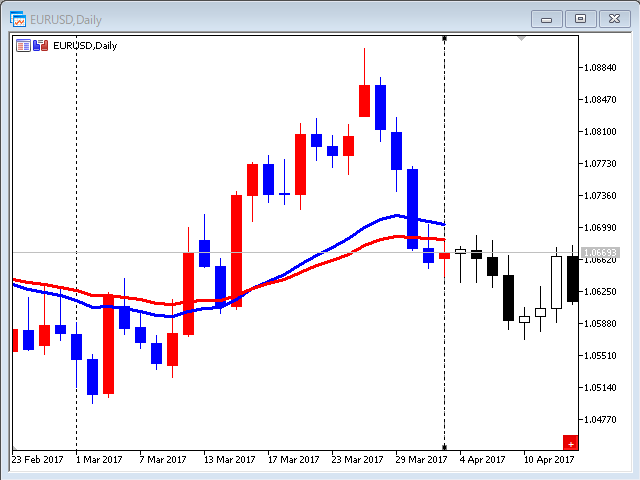
- When ReviewCandleChart is ON and you press a key such as "Z" or "X" Following that, the MA is drawn.
- When ReviewCandleChart is OFF, the same drawing as the original "Custom Moving Average" is made.
Usage tips
The product has proven to be efficient in conjunction with the ReviewCandleChart.
Indicator parameters
- Period - [13]
- Shift - [0]
- Method - [Smoothed]
- Simple
- Exponential
- Smoothed
- Linear weighted
Developer
Yutaka Okamoto, professional programmer.


El usuario no ha dejado ningún comentario para su valoración