EMA Dashboard
- Indicadores
- Chantal Sala
- Versión: 1.3
- Actualizado: 17 julio 2019
- Activaciones: 10
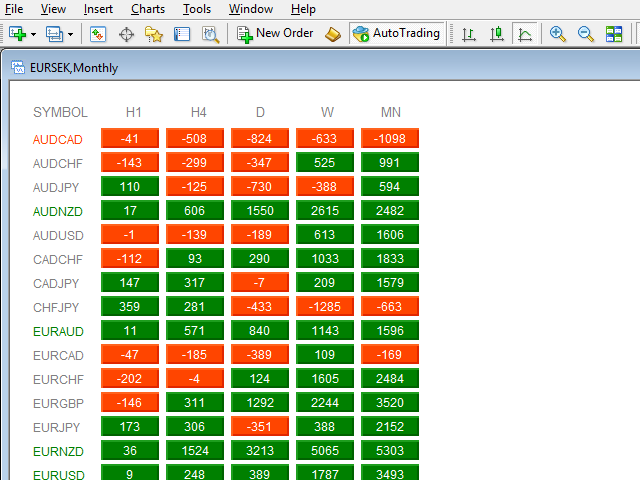
Ema Dashboard is an innovative dashboard that allows you to monitor Moving Average on multiples symbols and different timeframes.
This dashboard allows you to analyze information on 28 pairs on an unique chart.
Its functionality includes analysis of All Time Frames.
This configuration allows you to identify the Long Term Trend with extreme ease.
This panel allows you to take very important directional movements.
A click on button opens a new chart (symbol and timeframe).
Graphic Object
- Symbol label
- Red button: the price is under the relative EMA
- Green button: the price is above the relative EMA
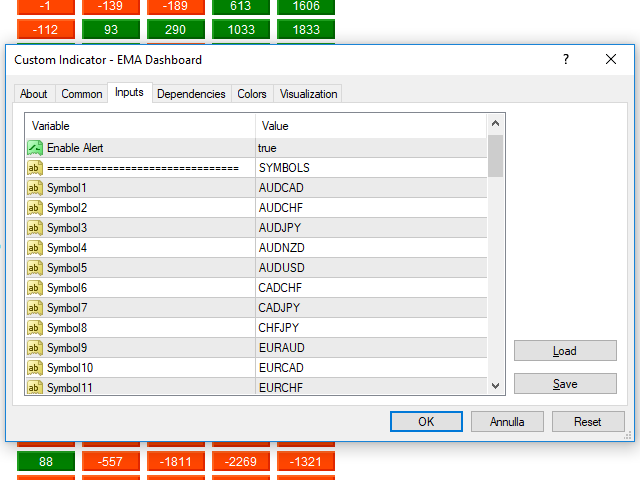
Input Values
- Enable Alert (true/false): the EA will alert with a pop up when all TF for a symbol are the same color
- Use_Only_Current_Symbol: to show only current symbol values
- 28 SYMBOLS
- Forex_Suffix_Symbols: put the broker suffix on symbols to delete from view
Ex: EURUSDc >>> EURUSD on the indicator - EMA SETTINGS differents for ALL Timeframe
- EMA Periods
- EMA Shift
- EMA Method
- EMA Applied Price
- RECTANGLE GRAPHIC SETUP
- Long_color
- Short_color
- TextColor
- COLORS AND SIZE SETTINGS
- Button_Size
- Symbols_Button_Width
- Label_Size
- Button_Text_Color
- NEW_CHART_TO_OPEN
- User template to add on the opened chart (you can apply a custom template on the opened chart)
NOTE: if you have gray button with zero value please update the history oh symbol and open the relative chart.


















THIS INDICATOR WE CANT'S CHANGE INPUT..AND TIME CHART,,WORK ONLY REAL INPUT ONLY,,MY REVIEWS NOT GREAT THIS,,