• Información general
  • Comentarios (144)
  • Discusión (139)
  • Novedades

Bermaui Deviation Percent

4.94
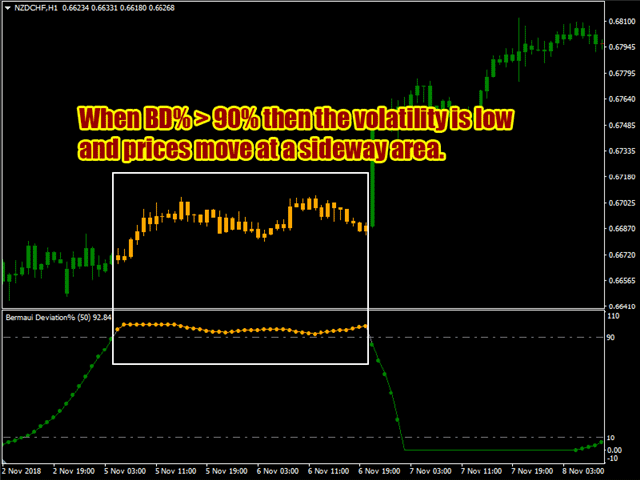
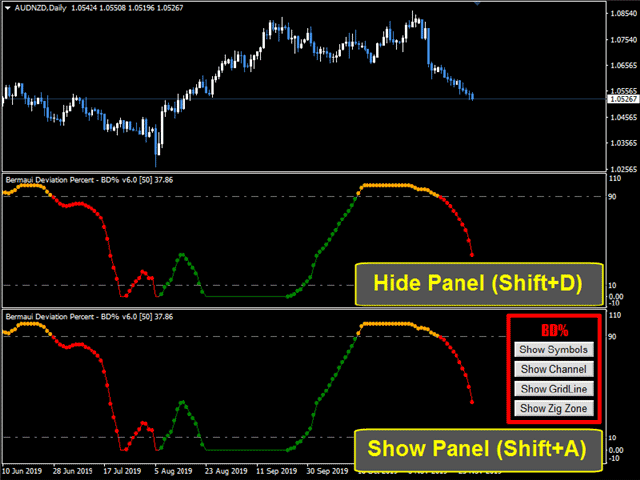
O (BD%), que es un índice de volatilidad que mide la volatilidad en porcentaje en lugar de puntos. La idea de BD% es hacer un índice en función de la Desviación Estándar Clásica (CSD) que se mueva entre 0 y 100 por ciento.

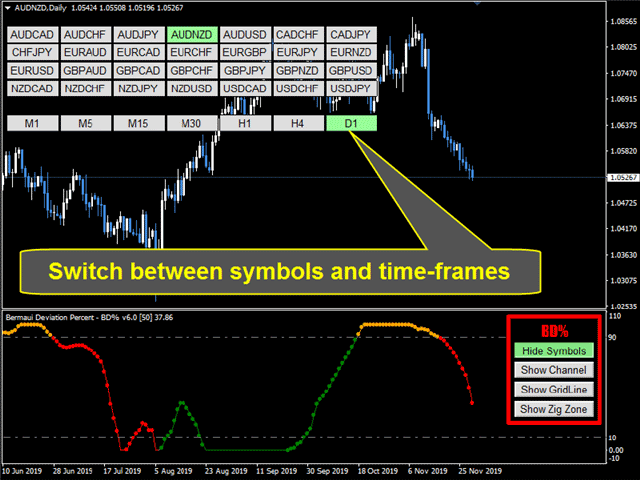
Puede utilizar BD% para comparar la volatilidad de la misma seguridad en diferentes períodos de tiempo o diferentes marcos de tiempo. Además, puede usar BD% para comparar la volatilidad entre diferentes valores en diferentes mercados en términos de porcentaje en lugar de puntos.

CÓMO USAR "BD%"

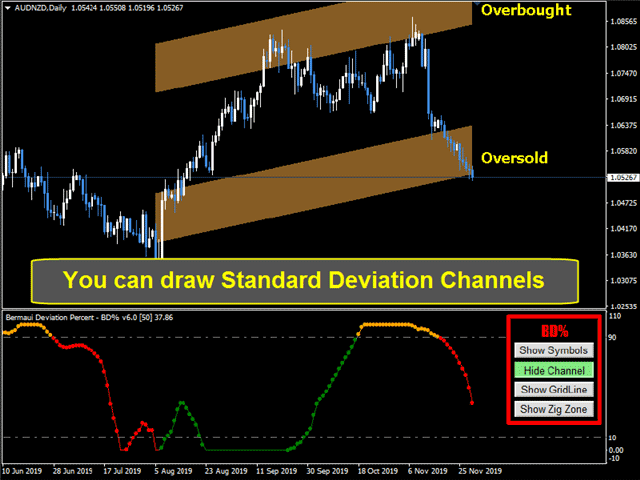
  • Si BD% está por debajo del 90% y luego cruza este nivel hacia arriba, esto es una señal de que los precios pueden moverse en un rango de rango.
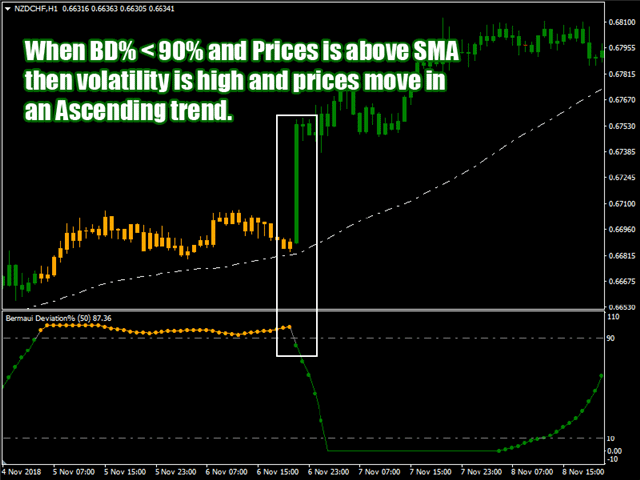
  • Si BD% está por encima del 90% y luego cruza este nivel hacia abajo, y el precio ya está por encima de su promedio móvil simple, esto es una señal del comienzo de una nueva tendencia ascendente. A medida que el BD% se profundiza a la baja, la volatilidad y la fuerza de la tendencia aumentan. Cuando BD% es 0%, esto significa que la volatilidad está en su valor más alto.
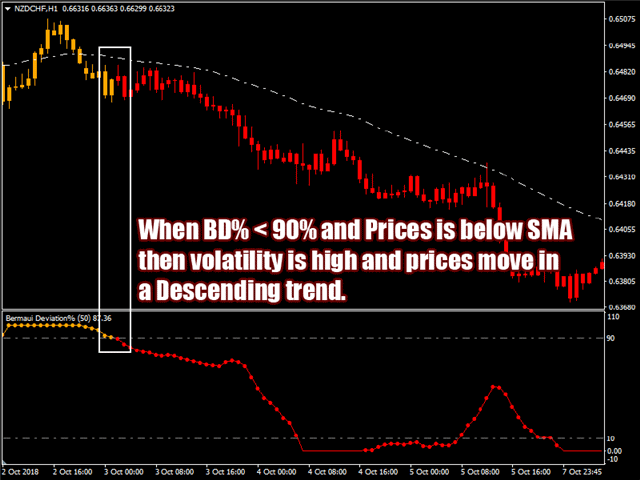
  • Si BD% está por encima del 90% y luego cruza este nivel hacia abajo, y el precio ya está por debajo de su promedio móvil simple, esto es una señal del comienzo de una nueva tendencia descendente. A medida que el BD% se profundiza a la baja, la volatilidad y la fuerza de la tendencia aumentan. Cuando BD% es 0%, esto significa que la volatilidad está en su valor más alto.


Para saber más sobre BD%, lea el manual del usuario desde aquí: https://www.mql5.com/en/blogs/post/718182

Si tiene alguna pregunta, comuníquese conmigo a través de un mensaje privado o escríbala en la sección de comentarios.
Muhammad Al Bermaui, CMT
Comentarios 20
8463792
287
8463792 2024.09.25 02:48 
 

Excelente indicador, eu primeiro aluguei e depois de alguns testes, eu acabei comprando por saber que é um excelente indicador.

Yusuf Hamzah
582
Yusuf Hamzah 2024.09.11 13:16 
 

I have the Bermaui Band and I kinda like the concept behind it. So I am just getting this to complement the product. I would not give any misleading marketing gimmick apart of saying user should try one and assess whether it is worth value-of-money or not. It is subjective for each individual. Cheers.

Lasse Michael Holm
1405
Lasse Michael Holm 2024.08.08 16:24 
 

It works really great. Now I can find the trade which is really trending! The sellers produckt is really good quality. Try also his TDO you will not regret it!

Productos recomendados
Infinity Trend Pro
Yaroslav Varankin
1 (1)
This is a trend indicator without redrawing Developed instead of the binary options strategy (by the color of the Martingale candlestick) Also works well in forex trading When to open trades (binary options) A signal will appear in the place with a candle signaling the current candle It is recommended to open a deal for one candle of the current timeframe M1 and M5 When a blue dot appears, open a deal up When a red dot appears, open a trade down. How to open trades on Forex. When a signal is rec
The Th3Eng PipFinite indicator is based on a very excellent analysis of the right trend direction with perfect custom algorithms. It show the true direction and the best point to start trading. With StopLoss point and Three Take Profit points. Also it show the right pivot of the price and small points to order to replace the dynamic support and resistance channel, Which surrounds the price. And Finally it draws a very helpful Box on the left side on the chart includes (take profits and Stop loss
VR Cub
Vladimir Pastushak
VR Cub es un indicador para obtener puntos de entrada de alta calidad. El indicador fue desarrollado para facilitar los cálculos matemáticos y simplificar la búsqueda de puntos de entrada a una posición. La estrategia comercial para la cual se diseñó el indicador ha demostrado su eficacia durante muchos años. La simplicidad de la estrategia comercial es su gran ventaja, que permite que incluso los operadores novatos negocien con éxito con ella. VR Cub calcula los puntos de apertura de posiciones
Master Scalping M1 es un indicador innovador que utiliza un algoritmo para determinar la tendencia de forma rápida y precisa. El indicador calcula el tiempo de apertura y cierre de posiciones, los algoritmos del indicador le permiten encontrar los momentos ideales para ingresar a una operación (comprar o vender un activo), lo que aumenta el éxito de las transacciones para la mayoría de los comerciantes. Beneficios del indicador: Fácil de usar, no sobrecarga el gráfico con información innecesari
The Sextet Scalper Pro  is an MT4 indicator that gives signals when new waves are starting in a trend. The trends are calculated using the original " The Sextet " indicator method. You get a free EA to trade with The Sextet Scalper Pro: Free EA . Default settings were optimized on GBPUSD H1 from 2017. EA could be tested on free demo version of The Sextet Scalper Pro, before purchase. Key Features: Uses The Sextet Trend Detection Method which is already a good strategy in itself for detecting l
Super Reversal Pattern
Parfait Mujinga Ndalika
Super Reversal Pattern Indicator Unlock the power of advanced pattern recognition with our Super Reversal Pattern Indicator. Designed for traders seeking precision and reliability, this indicator identifies one of the most effective reversal patterns in technical analysis, offering a significant edge in your trading strategy. Key Features: Non-Repainting Accuracy: Enjoy the confidence of non-repainting technology. Once a Super Reversal Pattern is detected, it remains static, providing consis
PipFinite Trend PRO
Karlo Wilson Vendiola
4.89 (2359)
Breakthrough Solution For Trend Trading And Filtering With All Important Features Built Inside One Tool! Trend PRO's smart algorithm detects the trend, filters out market noise and gives entry signals with exit levels. The new features with enhanced rules for statistical calculation improved the overall performance of this indicator. Important Information Revealed Maximize the potential of Trend Pro, please visit www.mql5.com/en/blogs/post/713938 The Powerful Expert Advisor Version Automa
Kangaroo Tailz
Brenden Caleb Luebeck
Looking for an indicator that identifies high-probability price action patterns? Love counter-trend trading? The Kangaroo Tailz indicator might be just for you. This indicator is meant to be used as a reversal detector. I personally would rather enter a position at the beginning of a trend rather than catch the last couple of moves. This indicator does a good job of alerting when price may reverse by identifying price action patterns that occur frequently in markets. Even though this indicator i
Retroceso de Fibonacci & Herramientas de Dibujo de Líneas Extendidas Retroceso de Fibonacci & Herramientas de Dibujo de Líneas Extendidas son aptos para la plataforma MT4 y para operadores que emplean el método de negociación de puntos y la negociación de sección áurea. Ventajas: Sin líneas excusadas ni las excesivamente largas, y es fácil de observar y descubrir oportunidades de negociación. Versión de prueba: https://www.mql5.com/zh/market/product/35884 Funciones principales: 1.
Los indicadores [ZhiBiCCI] son ​​adecuados para todos los ciclos de uso y también son adecuados para todas las variedades de mercado. [ZhiBiCCI] La línea verde sólida es una reversión de la divergencia alcista. La línea de puntos verde es una divergencia alcista clásica. [ZhiBiCCI] La línea continua hacia el rojo es una divergencia bajista inversa. La línea roja punteada es una divergencia bajista clásica. [ZhiBiCCI] puede configurarse en los parámetros (Alerta, Enviar correo, Enviar notif
Daily Candle Predictor es un indicador que predice el precio de cierre de una vela. El indicador está destinado principalmente para su uso en gráficos D1. Este indicador es adecuado tanto para el comercio de divisas tradicional como para el comercio de opciones binarias. El indicador se puede utilizar como un sistema de negociación independiente o puede actuar como una adición a su sistema de negociación existente. Este indicador analiza la vela actual, calculando ciertos factores de fuerza dent
Support and Resistance is a very important reference for trading.  This indicator provides customized support and resistance levels, automatic draw line and play music functions.  In addition to the custom RS, the default RS includes Pivot Point, Fibonacci, integer Price, MA, Bollinger Bands. Pivot Point is a resistance and support system. It has been widely used at froex,stocks, futures, treasury bonds and indexes. It is an effective support resistance analysis system. Fibonacci also known as t
Fourteen plus nine TD Sequential
MOHAMMED IMAD HUSSEIN BASSEE
Fourteen plus nine What is it for? Applying Tom DeMark’s TD Sequential serves the purpose of identifying a price point where an uptrend or a downtrend exhausts itself and reverses. . What are the main components of TD Sequential? TD Sequential has two parts – TD Setup and TD Countdown. The first phase of TD Sequential starts with a TD Setup and is completed with a 9 count. When the 9 count is completed, it is at that point, a price pause, price pullback, or reversal is likely. It is also at tha
Gann Square of 144
Taras Slobodyanik
5 (5)
Gann Box (o Gann Square) es un método de análisis de mercado basado en el artículo "Fórmula matemática para predicciones de mercado" de W.D. Gann. Este indicador puede trazar tres modelos de cuadrados: 90, 52 (104), 144. Hay seis variantes de cuadrículas y dos variantes de arcos. Puede trazar varios cuadrados en un gráfico simultáneamente. Parámetros Square — selección de un modelo cuadrado: 90 — cuadrado de 90 (o cuadrado de nueve); 52 (104) — cuadrado de 52 (o 104); 144 — cuadrado univer
Laser Trend
Nicolas Zouein
The trend is your friend! This is what this indicator is all about. Follow this famous saying and be safe. Characteristics: Buy/Sell signals fixed on the close of a bar. Works on all symbols and all timeframes. Clear visual market trend laser line, Buy/Sell signal arrows, market strength meter, TP1 & TP2 boxes. Visual signals when to enter, when to exit the market. No repainting. Compatible with Flexible EA for trading automation. (Ask for a free set file optimized to perform 2010-2018) Para
Advanced Trend Regime
Shellard Securities (Pty) Ltd
The indicator has been designed to function on any time-frame and any pair.   This regime filter will help the trader better evaluate whether the current market is trending, and in which direction. It quickly reacts to changes in market dynamics using a series of advanced calculations. The user is able to select whether the calculation remains standard, or if a further filter constraint is added to the calculation.   A Yellow moving average of the signal has been included for the trader to smoot
Lyne
Maksim Kalachev
About the Lyne indicator Lyne is a Metatrader 4 (MT4) indicator, the essence of which is to transform the accumulated historical data. The Lyne indicator makes it possible to detect various features and patterns in price dynamics that are invisible to the naked eye. Based on this information, traders can anticipate further price movement and adjust their strategy accordingly. This indicator has proven itself in the scalping strategy. The indicator works without repainting.
Atomic Analyst
Issam Kassas
5 (2)
En primer lugar, vale la pena enfatizar que este Indicador de Trading no repinta, no redibuja y no se retrasa, lo que lo hace ideal tanto para el trading manual como para el automatizado. Manual del usuario: configuraciones, entradas y estrategia. El Analista Atómico es un Indicador de Acción del Precio PA que utiliza la fuerza y el impulso del precio para encontrar una mejor ventaja en el mercado. Equipado con filtros avanzados que ayudan a eliminar ruidos y señales falsas, y aumentan el poten
Predictor PRO MT4
Evgenii Aksenov
5 (1)
Indicador progresivo de nueva generación de INFINITY. Predictor Pro utiliza su propia estrategia de cálculo de entrada y salida. Indicador sin volver a dibujar las señales! Esto es muy importante para el comercio real. El indicador se puede utilizar para cualquier par de divisas, metales, criptomonedas o índices. Mejor horario de tiempo N1. Predictor Pro muestra el punto de entrada Buy / Sell y el punto de salida Close. El cálculo del beneficio en los puntos ayuda a elegir la configuración
El indicador "Two Moving Average Crossover" para MetaTrader 4 (MT4 es una herramienta de análisis técnico que muestra dos medias móviles y notifica cuando las medias móviles se cruzan entre sí. El indicador calcula y traza dos medias móviles, una de las cuales es más rápida y la otra más lenta. Cuando la media móvil más rápida se cruza por encima de la media móvil más lenta, se considera una señal alcista, que indica un posible cambio de tendencia o el inicio de una nueva tendencia alcista. Por
Alpha Trend sign has been a very popular trading tool in our company for a long time. It can verify our trading system and clearly indicate trading signals, and the signals will not drift. Main functions: Based on the market display of active areas, indicators can be used to intuitively determine whether the current market trend belongs to a trend market or a volatile market. And enter the market according to the indicator arrows, with green arrows indicating buy and red arrows indicating
QM Pattern Scanner MT4
Reza Aghajanpour
4.8 (5)
Contact me  to send you instruction and add you in group. QM (Quasimodo) Pattern is based on Read The Market(RTM) concepts. The purpose of this model is to face the big players of the market (financial institutions and banks), As you know in financial markets, big traders try to fool small traders, but RTM prevent traders from getting trapped. This style is formed in terms of price candles and presented according to market supply and demand areas and no price oscillator is used in it. RTM con
Chart Patterns Detect 15 patterns (Ascending Triangle, Descending Triangle, Rising Wedge, Falling Wedge, Bullish Flag, Bearish Flag, Bullish Rectangle, Bearish Rectangle Symmetrical triangle, Head and Shoulders, Inverted Head and Shoulders, Triple top, Triple Bottom, Double Top, Double Bottom) Use historical data to calculate the probability of each pattern to succeed (possibility to filter notification according to the chance of success) gives graphic indication about the invalidation level and
This is the FXTraderariel-TakeProfit - Stop Loss Indicator . It provides you 3 potential Take Profits and 1 Stop Loss. These potential targets are computed based on several methods . The indicator can be used on every time frame, but we advise to use it on H1, H4 and D1. Especially if you are a novice trader. Pro Traders can also you use it for scalping in smaller time frames (M1, M5 and M15). This indicator is not a complete trading system. It doesn't provide you a Signal nor can predict the m
This indicator triggers an alert for one of the most popular methods used in Stochastic Oscillator. This is as follow: a buying alert when the Oscillator (either MAIN [%K] or SIGNAL [%D]) falls below a specific level (e.g., 20) and then rises above that level. a selling alert when the Oscillator rises above a specific level (e.g., 80) and then falls below that level. Note: this tool was developed based on the code of Stochastic Oscillator indicator included by default in MetaTrader 4 terminal
Trendiness Index
Libertas LLC
5 (3)
"The trend is your friend" is one of the best known sayings in investing, because capturing large trendy price movements can be extremely profitable. However, trading with the trend is often easier said than done, because many indicators are based on price reversals not trends. These aren't very effective at identifying trendy periods, or predicting whether trends will continue. We developed the Trendiness Index to help address this problem by indicating the strength and direction of price trend
Heiken Ashi candle chart is an improved version of The Japanese candle chart, which can effectively filter the market "noise" of the Japanese candle chart. It is favored by many traders for its simplicity and intuition. For trend traders, the HA candle chart is a magic tool. Unlike the traditional Japanese candle chart, Heikenashi does not reflect the opening price, high price, low price and closing price of the market. Instead, Heikenashi calculates the value of a single K line in the dominant
Binary Options Support Resistance Indicator This indicator is designed for binary options trading and effectively shows retracements from support and resistance levels. Signals appear on the current candle. A red arrow pointing downwards indicates a potential selling opportunity, while a blue arrow pointing upwards suggests buying opportunities. All that needs adjustment is the color of the signal arrows. It is recommended to use it on the M1-M5 timeframes as signals are frequent on these timef
Trend Divergence Finder – индикатор, позволяющий выявлять дивергенции цены и графика выбранного индикатора. С помощью Trend Divergence Finder вы сможете подобрать тот индикатор, который наиболее эффективен для Вас, и использовать его с наглядным отображением на графике. В индикатор включены 9 базовых индикаторов : 1.        RSI 2.        MACD 3.        MOMENTUM 4.        RVI 5.        STOCHASTIC 6.        CCI 7.        Standard Deviation 8.        Derivative 9.        William Blau Присутст
Trade with Gann on your side!! MASTER CIRCLE 360 CIRCLE CHART, originally created by Gann admitted that this is “The Mother of all charts”. It is one of the last studies that this great trader left for us. The numeric tab le is apparently quite simple like all the tables and is based on square numbers, the SQUARE OF 12 and is by evolution, one of the most important square numbers. Here we can find CYCLE, PRICE AND TIME thanks to angles and grades, to show past and future support and resistance.
Los compradores de este producto también adquieren
Gann Made Easy
Oleg Rodin
4.86 (83)
Gann Made Easy es un sistema de comercio de Forex profesional y fácil de usar que se basa en los mejores principios de comercio utilizando la teoría del Sr. W. D. Gann. El indicador proporciona señales precisas de COMPRA y VENTA, incluidos los niveles de Stop Loss y Take Profit. Puede comerciar incluso sobre la marcha utilizando notificaciones PUSH. ¡Por favor, póngase en contacto conmigo después de la compra! ¡Compartiré mis consejos comerciales con usted y excelentes indicadores de bonificació
FX Volume
Daniel Stein
4.58 (33)
Obtenga su actualización diaria del mercado con detalles y capturas de pantalla a través de nuestro Morning Briefing aquí en mql5 y en Telegram ! FX Volume es el PRIMER y ÚNICO indicador de volumen que proporciona una visión REAL del sentimiento del mercado desde el punto de vista de un bróker. Proporciona una visión impresionante de cómo los participantes institucionales del mercado, como los brokers, están posicionados en el mercado Forex, mucho más rápido que los informes COT. Ver esta info
Enigmera
Ivan Stefanov
5 (3)
ENIGMERA: El núcleo del mercado https://www.enigmera.com Introducción Este indicador y sistema de negociación es un enfoque extraordinario de los mercados financieros. ENIGMERA utiliza los ciclos fractales para calcular con precisión los niveles de soporte y resistencia. Muestra la auténtica fase de acumulación y proporciona dirección y objetivos.  Un sistema que funciona tanto si estamos en una tendencia como en una corrección.  ¿Cómo funciona? ENIGMERA consta de tres líneas: la línea de s
FX Power MT4 NG
Daniel Stein
5 (13)
Obtenga su actualización diaria del mercado con detalles y capturas de pantalla a través de nuestro Morning Briefing aquí en mql5 y en Telegram ! FX Power MT4 NG es la nueva generación de nuestro popular medidor de fuerza de divisas, FX Power. ¿Y qué ofrece este medidor de fuerza de nueva generación? Todo lo que le encantaba del FX Power original PLUS Análisis de fuerza de ORO/XAU Resultados de cálculo aún más precisos Períodos de análisis configurables individualmente Límite de cálculo persona
Trend Punch
Mohamed Hassan
4.95 (19)
This indicator is unstoppable when combined with our other indicator called  Support & Resistance . After purchase, send us a message and you will get it   for  FREE as a BONUS! Introducing Trend Punch , the revolutionary forex trend indicator that will transform the way you trade! Trend Punch is uniquely designed to provide precise buy and sell arrows during strong market trends, making your trading decisions clearer and more confident. Whether you're trading major currency pairs or exotic sym
Gann Swing Structure
Kirill Borovskii
5 (1)
This indicator is based on the mathematics of the great trader W.D. Ganna. With its help, you can easily find strong levels by analyzing swings to find the optimal entry point. The indicator works on all instruments and all timeframes. The indicator is fully manual and has control buttons. All you need to do is press the NEW button, a segment will appear, which you can place on any movement, swing or even 1 candle that you want to analyze. By placing the segment, press the OK button. A grid (th
Scalper Inside PRO
Alexey Minkov
4.73 (56)
An exclusive indicator that utilizes an innovative algorithm to swiftly and accurately determine the market trend. The indicator automatically calculates opening, closing, and profit levels, providing detailed trading statistics. With these features, you can choose the most appropriate trading instrument for the current market conditions. Additionally, you can easily integrate your own arrow indicators into Scalper Inside Pro to quickly evaluate their statistics and profitability. Scalper Inside
Dynamic Forex28 Navigator
Bernhard Schweigert
5 (1)
Dynamic Forex28 Navigator: la herramienta de trading de Forex de última generación. ACTUALMENTE CON UN 49 % DE DESCUENTO. Dynamic Forex28 Navigator es la evolución de nuestros indicadores populares de larga data, que combina el poder de tres en uno: Indicador avanzado Currency Strength28 (695 reseñas) + Indicador avanzado Currency IMPULSE con ALERT (520 reseñas) + Señales combinadas CS28 (bonificación). Detalles sobre el indicador https://www.mql5.com/en/blogs/post/758844 ¿Qué ofrece el i
¡Actualmente 20% OFF ! ¡La mejor solución para cualquier novato o trader experto! Este software funciona con 28 pares de divisas. Se basa en 2 de nuestros principales indicadores (Advanced Currency Strength 28 y Advanced Currency Impulse). Proporciona una gran visión general de todo el mercado de divisas. Muestra los valores de Advanced Currency Strength, la velocidad de movimiento de las divisas y las señales para 28 pares de divisas en todos los (9) marcos temporales. Imagine cómo mejorar
TPSproTREND PrO
Roman Podpora
4.79 (19)
TPSpro TREND PRO   es un indicador de tendencia que analiza automáticamente el mercado y proporciona información sobre la tendencia y cada uno de sus cambios, además de dar señales para ingresar operaciones sin volver a dibujar. El indicador utiliza cada vela, analizándolas por separado. refiriéndose a diferentes impulsos: impulso hacia arriba o hacia abajo. ¡Puntos de entrada exactos a transacciones de divisas, criptomonedas, metales, acciones e índices! Versión MT5                   DESCRIPCI
Presentamos ON Trade Waves Patterns Harmonic Elliot Wolfe, un indicador avanzado diseñado para detectar diversas formas de patrones en el mercado mediante métodos tanto manuales como automáticos. A continuación, te explicamos cómo funciona: Patrones Armónicos: Este indicador puede identificar patrones armónicos que aparecen en tu gráfico. Estos patrones son esenciales para los traders que practican la teoría del trading armónico, tal como se popularizó en el libro de Scott Carney "Harmonic Tradi
Scalper Vault
Oleg Rodin
5 (27)
Scalper Vault es un sistema profesional de reventa que le brinda todo lo que necesita para una reventa exitosa. Este indicador es un sistema comercial completo que puede ser utilizado por operadores de divisas y opciones binarias. El marco de tiempo recomendado es M5. El sistema le proporciona señales de flecha precisas en la dirección de la tendencia. También le proporciona señales superiores e inferiores y niveles de mercado de Gann. Los indicadores proporcionan todo tipo de alertas, incluidas
TPA True Price Action indicator reveals the true price action of the market makers through 100% non-repainting signals (except early signals mode) strictly at the close of a candle! TPA shows entries and re-entries, every time the bulls are definitely stronger than the bears and vice versa. Not to confuse with red/green candles. The shift of power gets confirmed at the earliest stage and is ONE exit strategy of several. There are available now two free parts of the TPA User Guide for our custo
Currency Strength Wizard es un indicador muy poderoso que le proporciona una solución todo en uno para operar con éxito. El indicador calcula el poder de este o aquel par de divisas utilizando los datos de todas las monedas en múltiples marcos de tiempo. Estos datos se representan en forma de índice de moneda fácil de usar y líneas eléctricas de moneda que puede usar para ver el poder de esta o aquella moneda. Todo lo que necesita es adjuntar el indicador al gráfico que desea operar y el indicad
El sistema PRO Renko es un sistema de trading de alta precisión especialmente diseñado para operar gráficos RENKO. Se trata de un sistema universal que se puede aplicar a diversos instrumentos de negociación. El sistema neutraliza eficazmente el llamado ruido de mercado, lo que le brinda acceso a señales de reversión precisas. El indicador es muy fácil de usar y solo tiene un parámetro responsable de la generación de señales. Puede adaptar fácilmente la herramienta a cualquier instrumento com
TPSpro RFI Levels
Roman Podpora
4.82 (22)
INSTRUCCIONES      RUSO  -  ING     Se recomienda utilizar con un indicador.   -    TPSpro   TENDENCIA PRO -   Versión MT5 Un elemento clave en el trading son las zonas o niveles desde los que se toman las decisiones de compra o venta de un instrumento de trading. A pesar de los intentos de los principales actores de ocultar su presencia en el mercado, inevitablemente dejan rastros. Nuestra tarea era aprender a identificar estos rastros e interpretarlos correctamente. Funciones principales: ¡Mo
Currency Strength Exotics
Bernhard Schweigert
4.87 (30)
¡ACTUALMENTE 20% DE DESCUENTO ! ¡La mejor solución para cualquier operador novato o experto! Este indicador está especializado en mostrar la fuerza de la divisa para cualquier símbolo como Pares Exóticos, Materias Primas, Índices o Futuros. Es el primero de su clase, cualquier símbolo se puede añadir a la 9 ª línea para mostrar la verdadera fuerza de la moneda de Oro, Plata, Petróleo, DAX, US30, MXN, TRY, CNH etc. Se trata de una herramienta de trading única, de alta calidad y asequible por
Trend Pulse
Mohamed Hassan
5 (4)
Please contact me after purchase to immediately get your PDF strategy + documentation for Trend Pulse !  Introducing Trend Pulse , a unique and robust indicator capable of detecting bullish, bearish, and even ranging trends! Trend Pulse uses a special algorithm to filter out market noise with real precision. If the current symbol is moving sideways, Trend Pulse will send you a ranging signal, letting you know that it's not a good time to enter a trade. This excellent system makes Trend Pulse
MetaBands M4
Vahidreza Heidar Gholami
5 (2)
MetaBands utiliza algoritmos potentes y únicos para dibujar canales y detectar tendencias para que pueda proporcionar a los traders puntos potenciales para entrar y salir de operaciones. Es un indicador de canal junto con un potente indicador de tendencia. Incluye diferentes tipos de canales que se pueden fusionar para crear nuevos canales simplemente utilizando los parámetros de entrada. MetaBands utiliza todos los tipos de alertas para notificar a los usuarios sobre eventos del mercado. Caract
Gold Channel is a volatility-based indicator, developed with a specific timing algorithm for the XAUUSD pair, which consists of finding possible corrections in the market. This indicator shows two outer lines, an inner line (retracement line) and an arrow sign, where the theory of the channel is to help identify overbought and oversold conditions in the market. The market price will generally fall between the boundaries of the channel. If prices touch or move outside the channel it is a tra
Automated Trendlines
Georgios Kalomoiropoulos
5 (16)
Las líneas de tendencia son la herramienta más esencial del análisis técnico en el comercio de divisas. Desafortunadamente, la mayoría de los comerciantes no los dibujan correctamente. El indicador de líneas de tendencia automatizadas es una herramienta profesional para comerciantes serios que lo ayuda a visualizar el movimiento de tendencia de los mercados. Hay dos tipos de Trendlines Bullish Trendlines y Bearish Trendlines. En la tendencia alcista, la línea de tendencia de Forex se dib
Reversal Sniper is designed to find the extreme reversals of the price. Indicator collects data of Cycle Sniper Indicator. NOTE: REVERSAL SNIPER Indicator is made for Cycle Sniper Users as an additional tool.  However, it can be used by the traders who look for finding out strong reversal levels. Indicator works on all timeframes and all instruments. Reversal  Sniper  Checks: Harmonic Patterns RSI Zig Zag and Harmonic Swings Cycle Sniper Indicator's Buy / Sell Signals The complex algo i
¡LEA LA INFORMACIÓN A CONTINUACIÓN ANTES DE COMPRAR EL PRODUCTO! ¡Apollo Pips PLUS SP es un producto único! ¡ES PARA AQUELLOS QUE QUIEREN OBTENER MI NUEVO INDICADOR "APOLLO PIPS" MÁS BONO "SUPER PACK" CON ACCESO A TODOS MIS INDICADORES COMERCIALES! Al comprar el producto Apollo Pips PLUS SP, en realidad está comprando una versión absolutamente nueva de mi indicador Apollo Pips. Esta versión del indicador tiene un algoritmo mejorado y un parámetro fácil de usar que le brinda la oportunidad de uti
Introducing the South African Sniper indicator created by a small group of traders with a few years trading trading the financial market profitably . This is a plug and play indicator that provides you with  BUY and SELL (SNIPER ENTRY) signals with TARGET and trail stops. The indicator Works with all MT4 trading instruments. The indicator uses previous  chart data as receipt to speculate on future market moves.
Este tablero muestra los últimos patrones armónicos disponibles para los símbolos seleccionados, por lo que ahorrará tiempo y será más eficiente / versión MT5 . Indicador gratuito: Basic Harmonic Pattern Columnas del indicador Symbol: aparecerán los símbolos seleccionados Trend : alcista o bajista Pattern : tipo de patrón (gartley, mariposa, murciélago, cangrejo, tiburón, cifrado o ABCD) Entry : precio de entrada SL: precio de stop loss TP1: 1er precio de toma de beneficios TP2: 2º precio de
PowerBall Signals es un indicador de señales de COMPRA/VENTA basado en la idea de utilizar zonas de soporte/resistencia. El indicador detecta patrones de reversión especiales basados ​​en zonas de soporte/resistencia y proporciona estas señales en su gráfico. La idea principal del indicador es utilizar el análisis MTF (Multi Time Frame) y proporcionar señales basadas en los niveles de su marco de tiempo actual y del siguiente superior. Este método permite predecir posibles reversiones de precios
IX Power MT4
Daniel Stein
5 (5)
IX Power lleva por fin la insuperable precisión de FX Power a los símbolos que no son de Forex. Determina con exactitud la intensidad de las tendencias a corto, medio y largo plazo de tus índices, acciones, materias primas, ETF e incluso criptodivisas favoritas. Puede analizar todo lo que su terminal le ofrece. Pruébalo y experimenta cómo tu timing mejora significativamente a la hora de operar. Características principales de IX Power Resultados de cálculo 100% precisos y sin repintado -
Apollo BuySell Predictor es un sistema comercial profesional que incluye varios módulos. El indicador proporciona al operador zonas de ruptura de precios, niveles de soporte y resistencia basados ​​en Fibonacci, una línea de inversión de tendencia, señales de volumen, retrocesos y otras características útiles que cualquier operador necesita a diario. El sistema funcionará con cualquier par. Los marcos de tiempo recomendados son M30, H1, H4. Aunque el indicador puede funcionar con otros marcos de
Ultimate Gold Advisor para MetaTrader 4 El Ultimate Gold Advisor es una herramienta tecnológica avanzada diseñada para optimizar la experiencia de trading en MetaTrader 4. Creada para satisfacer las necesidades de los traders más experimentados, este indicador combina precisión, análisis sofisticado y funcionalidad versátil, ofreciendo soporte para tomar decisiones de trading informadas. Ideal para el trading de oro, pero también aplicable a una amplia gama de activos, el Ultimate Gold Advisor p
Order Block Hunter
Noha Mohamed Fathy Younes Badr
5 (6)
Order block hunter indicator is the best indicator for  hunt the order blocks that area where there has been a large concentration of limit orders waiting to be executed Order blocks are identified on a chart by observing previous price action and looking for areas where the price experienced significant movement or sudden changes in direction .This indicator does that for you by using very complicated codes and helps you to take the best areas To buy and sell because it make marks at the best a
Otros productos de este autor
True Direction Oscillator
Muhammad Elbermawi
4.86 (363)
O (TDO), que es un índice que mide la tasa de cambio de precios utilizando el principio de " Pure Momentum ". Cuando el precio de un valor aumenta de 10 a 15, la tasa de cambio del precio es del 150%, pero cuando baja de 15 a 10, la tasa de cambio del precio es solo del 33,3%. Es por eso que los indicadores de análisis técnico como "Tasa de cambio de precio" (ROC) o "Momentum" dan lecturas más altas para los movimientos de precios ascendentes que las dadas para los descendentes. TDO soluciona e
Bermaui Manual EA
Muhammad Elbermawi
5 (9)
Este es un asesor experto semiautomático que comercia con el sistema de red. La idea es tomar gradualmente diferentes posiciones en el mercado y luego calcular el nivel de equilibrio para ellas. Cuando los precios superan este punto de equilibrio por una distancia predeterminada, todas las órdenes abiertas se cierran. Información importante Aquí está la guía del usuario:   https://www.mql5.com/en/blogs/post/730567 Puede probar este EA con cualquiera de mis otros productos, aquí: https://www.
MASR Bands
Muhammad Elbermawi
5 (5)
O bandas M Oving Un verage S poyo R esistencia. El indicador MASR Bands es un promedio móvil rodeado por dos bandas que funcionan juntas como niveles de soporte y resistencia. Estadísticamente, las bandas MASR contienen velas de precios el 93% del tiempo. Así es como se calcula en pasos: 1. El primer paso es calcular el máximo más alto (HHV) y el mínimo más bajo (LLV) durante un período de tiempo X. 2. El segundo paso es dividir HHV por LLV para obtener el ancho de la distancia entre ello
Bermaui Bands
Muhammad Elbermawi
4.97 (68)
Bermaui Bands (BB) es una herramienta de análisis técnico que ayuda a filtrar entre los movimientos de precios de rango y tendencia. La idea detrás de este indicador se puede explicar en los siguientes pasos: Calcule la desviación estándar como un oscilador que se mueve entre 0 y 100. Lo llamaré porcentaje de desviación de Bermaui (BD%). Si "BD%" está cerca de cero, la volatilidad está en su punto máximo. Además, si "BD%" está cerca de 100, la volatilidad es muy baja. Una alta volatilidad signif
BACD Cloud
Muhammad Elbermawi
5 (6)
O B ermaui Un verage C onvergence D ivergence la nube, que es un oscilador que muestra la dirección de tendencia y las medidas de su fuerza en porcentaje. El cálculo de BACD Cloud es el siguiente: 1- Calcula dos medias móviles exponenciales. Uno de ellos es más rápido que el otro. Llamaré al primero (Rápido) y al segundo (Lento) 2- Encuentra el centro entre ellos, donde: Centro MA = (Rápido + Lento) / 2 3- Calcule la línea BACD de la siguiente manera: BACD = 100 * (Fast / Center MA) 4-
Or DBD%. The indicator consists of colored tape that shows trading signals depending on two Bermaui Deviation Oscillator (BD%) and two moving averages. Bermaui Deviation Percent is a volatility index that measures volatility in percent rather than points. The idea of BD% is to make an index depending on Classic Standard Deviation (CSD) that moves between 0 and 100 percent. Important Information DBD% expert advisor example:  https://www.mql5.com/en/blogs/post/731145 If you want to know mor
Bermaui RSI Candles
Muhammad Elbermawi
5 (4)
La idea de este indicador es dibujar RSI en forma de velas que se pueden comparar con gráficos de precios para generar señales de compra y venta. El indicador no es invención mía. Lo fundé en Internet hace varios años. Actualicé el código, agregué funciones de alerta, agregué el grupo de herramientas Bermaui Utilities. El indicador calcula el RSI de todos los precios que se utilizan para dibujar velas (RSI de apertura, máximo, mínimo y cierre). Utiliza el más alto de ellos para dibujar la mecha
Moving Average Cloud
Muhammad Elbermawi
4.92 (13)
O "MAC". Este es un indicador diseñado para ayudarlo a capturar e intercambiar la tendencia. La idea detrás de este indicador se puede explicar en los siguientes pasos: Dibuja una envolvente promedio de rápido movimiento. Dibuja una Envolvente promedio de movimiento lento. La banda superior de MAC es el valor más alto entre el máximo de ambas envolventes. La banda inferior de MAC es el valor más bajo entre el mínimo de ambas envolventes. La nube de histograma MAC llena la distancia entre dos
Classic Keltner Channel
Muhammad Elbermawi
4.87 (30)
O CKC. Este indicador funciona según la regla clásica de la media móvil de diez días descrita por Chester W. Keltner (1909-1998). Todos los parámetros están configurados en la versión clásica del sistema Keltner por defecto, mientras que el usuario puede cambiarlos si lo desea. Información importante Lea el manual de CKC: https://www.mql5.com/en/blogs/post/736577 Ejemplo de asesor experto de CKC: https://www.mql5.com/en/blogs/post/734150 Acerca de la fórmula del canal Keltner 1. Calcule la
Bermaui Pin Bars
Muhammad Elbermawi
5 (13)
Barras de pasador Bermaui O (BPB) es un indicador que encuentra el patrón de acción del precio de Pin Bars en el gráfico. Pin Bars es un atajo para "Pinocchio Bars", que es un patrón de barra clásico alternativo a los candelabros japoneses con sombras altas o inferiores y cuerpos muy pequeños como Hammer, Inverted-Hammer, Hanging Man, Shooting Star, Dragon Fly Doji o Grave Stone Doji . El indicador Bermaui Pin Bars encuentra este patrón en función de una fórmula que se puede explicar en los
Bermaui Channel
Muhammad Elbermawi
5 (19)
This is a price channel that shows five important price levels on the chart. Those levels are: 1. The Highest High (HH) of the previous x bars. 2. The Highest Low (HL) of the previous x bars. 3. The Center Line. 4. The Lowest High (LH) of the previous x bars. 5. The Lowest Low (LL) of the previous x bars. How does Bermaui Channels Captures Overbought  area Think of the distance between HH and HL levels as an overbought area. When the price candles or bars crosses the HL to the upside this
Horus EA
Muhammad Elbermawi
3 (2)
Horus EA para MT4 Hace miles de años, los antiguos egipcios inventaron un sistema de conteo que usaban para medir sus tierras y pesar sus mercancías. Este sistema fue conocido como el " Ojo de Horus ". El Ojo de Horus se asoció con el mito del dios Osiris y se convirtió en uno de los símbolos sagrados de los faraones. Usé las ecuaciones matemáticas en el Ojo de Horus con la secuencia de Fibonacci para construir un sistema de administración de dinero de progresión negativa que es un 89% más se
Filtro:
8463792
287
8463792 2024.09.25 02:48 
 

Excelente indicador, eu primeiro aluguei e depois de alguns testes, eu acabei comprando por saber que é um excelente indicador.

Yusuf Hamzah
582
Yusuf Hamzah 2024.09.11 13:16 
 

I have the Bermaui Band and I kinda like the concept behind it. So I am just getting this to complement the product. I would not give any misleading marketing gimmick apart of saying user should try one and assess whether it is worth value-of-money or not. It is subjective for each individual. Cheers.

Muhammad Elbermawi
52495
Respuesta del desarrollador Muhammad Elbermawi 2024.09.11 13:18
Thanks a lot, Yusuf ... I appreciate that 🙏
Lasse Michael Holm
1405
Lasse Michael Holm 2024.08.08 16:24 
 

It works really great. Now I can find the trade which is really trending! The sellers produckt is really good quality. Try also his TDO you will not regret it!

ovno27
109
ovno27 2024.04.07 09:09 
 

Fantastic filter/Momentum Indicator.

lilinhui
59
lilinhui 2023.03.12 03:33 
 

非常好的指标。我们可以自信地使用这个指标进行交易。

elite luis
3351
elite luis 2023.03.03 16:00 
 

This is Amazing indicator! Author is very responsive and passionate in his work, Best Buy for 2023! I want to get MT5 version also for Bermaui Deviation Percent, Author please code MT5 ok?

Muhammad Elbermawi
52495
Respuesta del desarrollador Muhammad Elbermawi 2023.03.03 18:43
Thanks a lot for the great review & stars
Ruslan Ostafiichuk
275
Ruslan Ostafiichuk 2023.02.20 08:30 
 

Очень полезный и удобный индикатор. Покупкой доволен.

Cd Vijaya Narayana
700
Cd Vijaya Narayana 2022.12.22 20:20 
 

Very good indicator. we can confidently trade using this indicator.

Muhammad Elbermawi
52495
Respuesta del desarrollador Muhammad Elbermawi 2022.12.22 20:24
Thanks a lot for the great review & stars :)
Najseattle
77
Najseattle 2022.11.27 07:47 
 

The Bermaui Deviation % is definitely one of the top ten indicators I have ever used. Along with a few others also created by Mr. Bermaui. I do recommend you at least test all of his indicators. It may help you to visualize the Markets in a different way that proves beneficial to your trading career! 5 stars

Muhammad Elbermawi
52495
Respuesta del desarrollador Muhammad Elbermawi 2022.11.29 07:49
I really want to thank you for your great words, Nicolas.
powertrader24
85
powertrader24 2022.10.07 08:54 
 

The first indicator I bought from Muhammad was TDO (True Direction Oscillator) about a week ago. I've had great luck using the TDO indicator so, now I purchased his BD% to get even better results from my trading. Keep up the good work Muhammad!

Muhammad Elbermawi
52495
Respuesta del desarrollador Muhammad Elbermawi 2022.10.07 09:18
Thanks a lot for that great review
KEWELL99 Hields
89
KEWELL99 Hields 2022.09.14 21:59 
 

Downloaded the demo and was impressed so just purchased the full version and im in 2 profitable trades already....best thing I can say is though that the developer is happy to share knowledge and has responded to some queries already, this makes a good seller in my opinion. Really like the look of TDO from this developer aswell which I am demoing, his products are visually very helpful - 5 stars, thank you Muhammed

Muhammad Elbermawi
52495
Respuesta del desarrollador Muhammad Elbermawi 2022.09.14 22:10
You are welcome my friend
Jedidiah Benedict
91
Jedidiah Benedict 2022.08.05 18:31 
 

I really like this indicator.

James Sabai-Jai
911
James Sabai-Jai 2022.07.29 11:00 
 

El usuario no ha dejado ningún comentario para su valoración

hisunsun
502
hisunsun 2022.07.22 09:02 
 

This indicator spots out the volatility ; it could increase with winning rate on combine with using other indicators.

Vinicius Favarin
322
Vinicius Favarin 2022.07.21 23:04 
 

It's no use throwing money away.

Nikodem Dobrzynski
216
Nikodem Dobrzynski 2022.07.13 20:14 
 

Very good volatility indicator for trading strategy, is useful as filter to protect you to enter week trades. Bermaui Deviation Percent you have to use as combination with other indicators . It’s no secret that all technical analysis indicators are lagging . Also you have to understand that sometimes doesn’t get you into a good trade, it is normal thing using indicators. Overall my rating is five stars.

rodbizness
84
rodbizness 2022.06.11 01:23 
 

Just Very Very GOOD Indicator . Thank again Muhammad for your nice job.

SurfsideTrader
265
SurfsideTrader 2022.05.26 14:30 
 

So far so good. Not only does this indicator generate high probability signals but, equally importantly, it keeps you out of lower probability trades that you may ordinarily have entered.

ck15220
714
ck15220 2022.04.20 05:38 
 

Good indictor accurate signals

Munch Makuchi
1334
Munch Makuchi 2022.04.17 18:00 
 

Seriously nothing like this indicator. With the Bermaui Bands + Deviation% the likelihood of entering a bad trade is almost nothing for as long as you trade with the trend and not entering into resistance or support. Thank you!

Respuesta al comentario
Versión 6.1 2020.03.28
1. Fixed a small bug in the de-initialization function, that used to cause the "Symbols Switch" tool not to work properly.
2. Organized BD% parameters in a better style.
3. Enhanced alert messages.
.
Note:
I didn't make any changes on TDO basic formula. It is still the same.
I didn't make serious changes in indicator parameters or buffers.
Versión 6.0 2019.12.05
Bermaui Deviation Percent version 5.0:
--------------------------------------------------
1. I worked to enhance the built-in function of the indicator and made the code much more organized than before.

2. This version have much less parameters.

3. Enhanced the panel at the right side of the indicator.

4. Added four Color Lists.

5. Enhanced all alerts and messages code.
Versión 5.0 2019.07.18
Welcome to Bermaui Deviation Percent version 5.0. In this version:

1. I worked to enhance the built-in function of the indicator and made the code much more organized than before.
2. Made the code more easier to be read with iCustom().
3. Added the option to change font size for buttons.

I hope you like it.
Kind regards
Versión 4.0 2019.01.11
1. Método de cálculo de% de BD mejorado.
2. Organiza los parámetros de% de BD en un mejor estilo.
3. Se mejoró el método de cálculo de la Cuadrícula de números redondos.
4. Se agregaron subniveles a la Cuadrícula de números redondos.
5. Agregué lo que llamo Zig Zone Levels para capturar fácilmente el soporte y la resistencia.
Versión 3.0 2018.08.03
1.1. Added a "Symbol Switch Panel" to make it easy for user to switch between different charts.
1.2. "Symbol Switch Panel" can be from User inputs or from Market Watch window.
1.3. "Symbol Switch Panel" can change chart for current window or open it in a new one.
1.4. User can use "Symbol Switch Panel" to change current chart time frame.
1.5. User control the number of buttons on "Symbol Switch Panel". He can make them appear on main chart or TDO window.
---------------------------------------------------------
2.1 Added a "Price Channel".
2.2 User can choose between "Standard Deviation" or "Linear Regression" channels.
2.3 User can draw channels as a ray or make them as background.
---------------------------------------------------------
3.1 Added a "Price Grid".
3.2 User can choose between "Automatic Grid" and "Customer Grid".
3.3 User can multiply distance between grid levels.