• Información general
  • Comentarios (1)
  • Discusión (4)

DG TrendSigns

3

Purpose

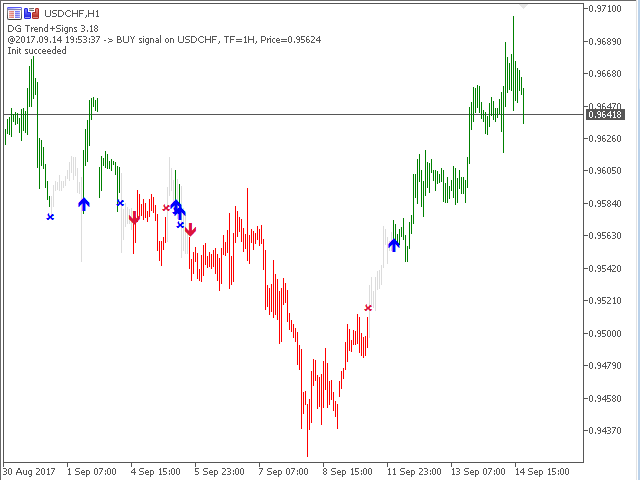
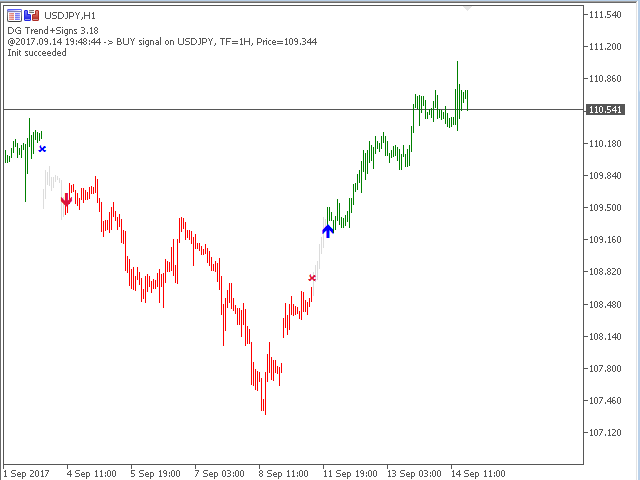
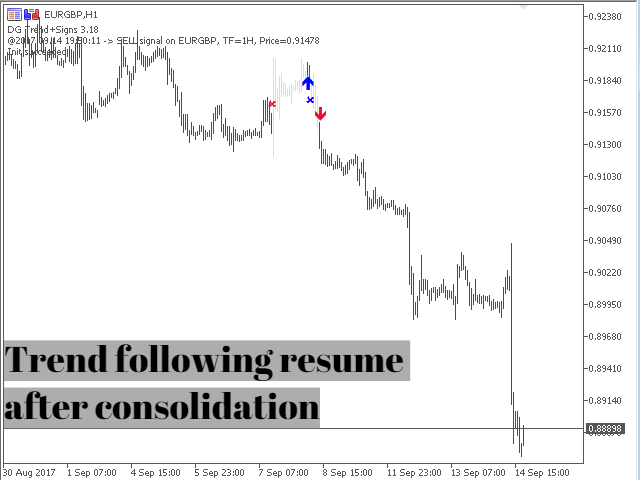
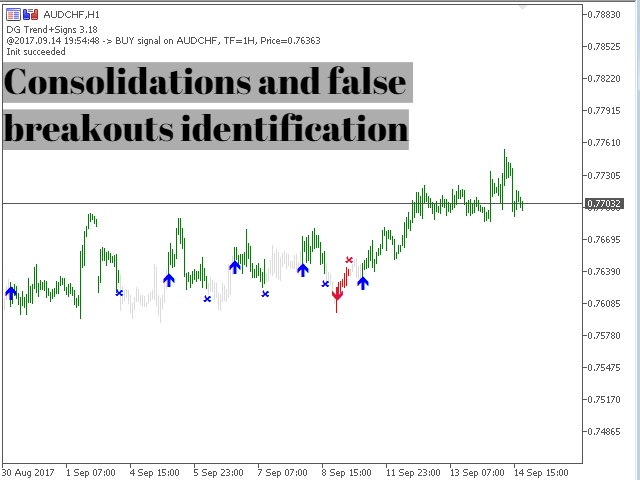
DG Trend+Signs is an indicator that paints candles with trend colors and clearly shows consolidations, using both DoGMA Trend and DoGMA Channel indicators.

It was created to help users in their trades, showing trends, consolidations and marking entry and exit points. The indicator also takes consolidations in consideration to identify breakouts.


Key features

  • Designed to be simple to use, with a few parameters
  • Does NOT repaint
  • Does NOT recalculate
  • Signals on entries
  • Works in ALL pairs
  • Works in ALL timeframes
  • Many kinds of alerts


Main Indicator Parameters and How to Use Them:

  • Signal Sensibility - The sensibility of the of the price change detection (the greater, the less sensible)

Use this parameter to tune the sensibility of the DoGMA signal, that means how much price variations are needed to be considered relevant. Similar to the MACD signal, however, it is more sensible.

If you using low timeframes (from M1 to M15), for daytrading, use a low integer number (from 3 to 20, e.g.). If you want to make swing or position trades use greater values (above 21, e.g.). Remember to set this parameter lower than Trend Sensibility to achieve better results.

  • Trend Sensibility - The sensibility of the trend detection (the greater, the less sensible)

This parameter is used to identify trends, it's the main value for the coloring candles feature. As the previous parameter, if you using low timeframe (from M1 to M15), for daytrading, use a low integer number (from 19 to 36, e.g.). If you want to make swing or position trades, analyze greater timeframes (H1, D1) and use greater values (above 144, e.g.).

  • Congestion Sensibility - Channel breakout sensibility (the greater, the less sensible)

The indicator tunes its sensibility to long periods of consolidations through this parameter. Usually, if you are doing daytrades, use it low (e.g., between 8 and 24), to longer trades, use values from 14 to 36.

  • Sigma Sensibility - Amplitude variation of DoGMA Channel

Sigma is an advanced parameter and it is related to the variation speed of the DoGMA channel. The greater, the less sensible. We recommend a value between 1.6 and 2.4. If you are beginning to use DG TrendSigns, use the default value (2.1).

  • Minimum Tick variation Sensibility - Minimum tick variation to be considered as a meaningful price movement.

Mininum number of ticks of which the price should go before consider it a breakout or a meaningful price movement. Use it carefully, and adjust it to each asset and stock market, since it's linked to the price values itself. If you new to DG TrendSigns or don't know how to use it yet, please set it to 1 or accept the default value.

  • Price to be considered - The price to be used by the indicator in its calculations
  • Do not paint candles on weak trends/consolidations - Should the indicator paint grayish candles when the trend is weak?
  • Arrow shift - The vertical shift of signal arrow
  • Bars analyzed - The number of bars to be analyzed
  • Alerts - Set your preferred alerts


Example Settings

  • EURUSD - M1 to M15 charts - Daytrading
Signal Sensibility 5
Trend Sensibility 74
Min Tick var 2
Consolidation Sensibility 38
DoGMA Channel Sigma 1.8
  • EURUSD - H1 to D1 charts - Swing trading
Signal Sensibility 14
Trend Sensibility 144
Min Tick var 10
Consolidation Sensibility 36
DoGMA Channel Sigma 2.1
  • EURUSD - H1 to W1 charts - Position trading
Signal Sensibility 16
Trend Sensibility 310
Min Tick var 14
Consolidation Sensibility 34
DoGMA Channel Sigma 2.1


Notes

This indicator is a manual trading tool that can be used in many ways. It's up to you to find the best setting to fit your purposes.

DoGMA Trend is a copyrighted method that uses combined zero lag averages algorithms to identify a trend, DoGMA Channel is a new approach to calculate a dynamic channel, sensible to consolidations, minimum variations, and quick price spins.

Productos recomendados
This indicator builds upon the previously posted Nadaraya-Watson smoothers. Here we have created an envelope indicator based on Kernel Smoothing with integrated alerts from crosses between the price and envelope extremities. Unlike the Nadaraya-Watson estimator, this indicator follows a contrarian methodology. Please note that by default this indicator can be subject to repainting. Users can use a non-repainting smoothing method available from the settings. The triangle labels are designed
Noize Absorption Index - is the manual trading system that measures the difference of pressure between bears forces and bulls forces. Green line - is a noize free index that showing curent situation. Zero value of index shows totally choppy/flat market.Values above zero level shows how powerfull bullish wave is and values below zero measures bearish forces.Up arrow appears on bearish market when it's ready to reverse, dn arrow appears on weak bullish market, as a result of reverse expectation.
HiLo Activator Plus
Rodrigo Galeote
5 (1)
HiLo Activator es uno de los indicadores más utilizados para determinar tendencia. Encuéntrelo aquí esta versión personalizada de Gekko con la capacidad de personalizar el período y los colores. Este indicador también traza flechas hacia arriba y hacia abajo cuando hay un cambio en la tendencia, lo que indica puntos de entrada y salida muy fuertes HiLo se adapta bien a diferentes tipos de períodos para la negociación intradiaro. Puedes entender fácilmente cuándo es el momento de comprar o vender
Multiple Timeframe MACD indicator. This indicator was built for making multiple timeframe analysis possible in MT5 using MACD Indicator. MACD Indicator traditionally shows two lines and one histogram. MACD Line(Yellow) is calculated by subtracting 12period EMA(fast) from 26period EMA (slow). Signal Line(Blue) is created by a 9period EMA from MACD Line. Histogram is just the difference between MACD and Signal lines. Histogram is colored based on the difference between its value and the previous h
Limitless MT5
Dmitriy Kashevich
Limitless MT5 is a universal indicator suitable for every beginner and experienced trader. works on all currency pairs, cryptocurrencies, raw stocks Limitless MT5 - already configured and does not require additional configuration And now the main thing Why Limitless MT5? 1 complete lack of redrawing 2 two years of testing by the best specialists in trading 3 the accuracy of correct signals exceeds 80% 4 performed well in trading during news releases Trading rules 1 buy signa
KT Supply and Demand MT5
KEENBASE SOFTWARE SOLUTIONS
KT Supply and Demand indicator identifies and plots key supply and demand zones. It achieves this by analyzing swing points and integrating them with a multi-timeframe analysis, ensuring that only the most crucial supply-demand zones are highlighted. This advanced method highlights the regions where prices are likely to reverse, stemming from significant supply-demand zones established by recent price movements. Features Precision Analysis: Our refined algorithm is designed to accurately pi
Strong Candle Indica el tamaño de cada vela con el valor de texto encima e indica qué vela tiene un cuerpo mayor al especificado en los parámetros en porcentaje, es decir, una vela fuerte (entre Size_Min y Size_Max) con al menos x% de cuerpo. El tamaño de la vela se coloca en el buffer y esa es la indicación de compra o venta, donde: valor > 0 = vela alcista o valor < 0 vela bajista, valor = 0 significa que no hay indicación (la vela no coincide con el patrón deseado)
Este indicador le mostrará los valores TP y SL (en esa moneda) que ya configuró para cada pedido en los gráficos (cerrados a la línea de transacción/pedido) que lo ayudarán mucho a estimar sus ganancias y pérdidas para cada pedido. Y también te muestra los valores de PIP. el formato que se muestra es "Valores de moneda de nuestros valores de ganancias o pérdidas / PIP". El valor TP se mostrará en color verde y el valor SL se mostrará en color rojo. Para cualquier pregunta o más información, n
Este es el indicador de barras fuertes de Gekko. Produce señales cuando hay una barra fuerte alcista o bajista, para eso usa tres condiciones diferentes: 1 - cuando la barra actual es más alta / más baja que las x últimas barras (x es un parámetro de entrada), 2 - cuando el tamaño de la barra actual es más grande que el tamaño promedio de las últimas x barras (x es un parámetro de entrada) y 3 - cuando la barra actual tiene una cola corta en su candle (sombra). Entradas Plot Strong Bar Arrows fo
Owl Smart Levels MT5
Sergey Ermolov
4.31 (39)
Versión MT4  |  FAQ El Indicador Owl Smart Levels es un sistema comercial completo dentro de un indicador que incluye herramientas de análisis de mercado tan populares como los fractales avanzados de Bill Williams , Valable ZigZag que construye la estructura de onda correcta del mercado y los niveles de Fibonacci que marcan los niveles exactos de entrada. en el mercado y lugares para tomar ganancias. Descripción detallada de la estrategia Instrucciones para trabajar con el indicador Asesor de c
Master OBV
Thalles Nascimento De Carvalho
The MasterOBV indicator is a powerful technical analysis tool that utilizes volume, positive correlation, and a Moving Average (MA) to enhance trend identification in financial markets. By incorporating assets with positive correlation through the indicator menu, MasterOBV provides a refined approach to assessing the strength and direction of trends. The inclusion of the Moving Average adds additional smoothing to price movements, aiding in a more accurate tracking of the underlying trend over
Aroon Precision Trends MT5
Maestri Investment Group Ltd.
Introducing the Aroon Indicator - Your Ultimate Trend Analysis Tool! Are you looking to take your trading game to the next level? Want to identify lucrative entry and exit points in the financial markets with ease? Look no further! The Aroon Indicator is here to revolutionize your trading strategy and help you make informed decisions like never before. Developed by the brilliant mind of Tushar Chande, the Aroon Indicator is a powerful technical analysis tool designed to measure the strength
Liquidity Oscillator
Paolo Scopazzo
5 (1)
A powerful oscillator that provide Buy and Sell signals by calculating the investor liquidity. The more liquidity the more buy possibilities. The less liquidity the more sell possibilities. Please download the demo and run a backtest! HOW IT WORKS: The oscillator will put buy and sell arrow on the chart in runtime only . Top value is 95 to 100 -> Investors are ready to buy and you should follow. Bottom value is 5 to 0 -> Investors are ready to sell and you should follow. Alert + sound will app
Heiken Ashi Smoothed Strategy is a very simple but powerful system to get forex market trend direction. This indicator is actually 2 indicators in 1 pack, Heiken Ashi and Heiken Ashi Smoothed Moving Average both included. Because HA (Heiken Ashi) and HAS (Heiken Ashi Smoothed) are calculated in the same one system event with necessary buffers and loop only, so it is the FAST, OPTIMIZED and EFFICIENT HA having the combined indicator of MetaTrader 5. You can choose to display HA and HAS in the sam
Este innovador indicador de medición de la fuerza de la moneda de INFINITY es un ayudante indispensable para los revendedores y comerciantes que negocian en el largo plazo. El sistema de Análisis de fortaleza / debilidad de las monedas ha sido conocido y utilizado en el mercado por los principales operadores del mundo. Cualquier comercio de arbitraje no está completo sin este análisis. Nuestro indicador determina fácilmente la fuerza de las monedas subyacentes entre sí. Muestra gráficos de líne
HAshi-E es una forma mejorada de analizar las señales Heiken-Ashi. Información: Heiken-Ashi es especialmente valorado por su capacidad para filtrar la volatilidad a corto plazo, lo que lo convierte en una herramienta preferida para identificar y seguir tendencias, ayuda en la toma de decisiones sobre puntos de entrada y salida, y ayuda a distinguir entre señales falsas y auténticos cambios de tendencia. A diferencia de los gráficos de velas tradicionales, las velas Heiken-Ashi se calculan u
Automated Trendlines MT5
Georgios Kalomoiropoulos
Las líneas de tendencia son la herramienta más esencial del análisis técnico en el comercio de divisas. Desafortunadamente, la mayoría de los comerciantes no los dibujan correctamente. El indicador de líneas de tendencia automatizadas es una herramienta profesional para comerciantes serios que lo ayuda a visualizar el movimiento de tendencia de los mercados. Hay dos tipos de Trendlines Bullish Trendlines y Bearish Trendlines. En la tendencia alcista, la línea de tendencia de Forex se dib
Atomic Analyst MT5
Issam Kassas
4.79 (19)
En primer lugar, vale la pena enfatizar que este Indicador de Trading no repinta, no redibuja y no se retrasa, lo que lo hace ideal tanto para el trading manual como para el automatizado. Manual del usuario: configuraciones, entradas y estrategia. El Analista Atómico es un Indicador de Acción del Precio PA que utiliza la fuerza y el impulso del precio para encontrar una mejor ventaja en el mercado. Equipado con filtros avanzados que ayudan a eliminar ruidos y señales falsas, y aumentan el poten
WEEKEND OFFER! --> -60% OFF + BONUS EA: NEWS Scope EA PRO with AMAZING results! NOTE: Promo price: $117 ( Regular Price: $297) - The offer ends on Monday!  Click here to check News Scope EA PRO results! Trend Reader Indicator is a revolutionary trading indicator designed to empower forex traders with the tools they need to make informed trading decisions. This cutting-edge indicator utilizes complex mathematical calculations and the Average True Range (ATR) indicator to identify and highlight t
Mercadulls Trade
Gilberto Rodrigues
The   Mercadulls   Indicator gives to you many signals types, detecting supports, resistances and accumulation/distribution zones. The indicator constantly checks the graph for direct analysis and the appearance of long trends. Main characteristics No repaint! Stop loss and take profit levels are provided by the indicator. Suitable for Day Traders, Swing Traders, and Scalpers. Optimized algorithm to increase the accuracy of signals. Technical analysis indicator for all assets available in the m
Oscillator trading signals - это динамический индикатор, определяющий состояние к продолжению тенденции роста или падению цены торгового инструмента и отсечению зон с нежелательной торговлей. Индикатор состоит из 2 линий осцилляторов. Медленная и быстрая сигнальная линия.  Шкала отображения перевернутая. Зоны вблизи 0 свидетельствуют о тенденции роста цены валютной пары. Зоны -100 свидетельствуют о падении цены валютной пары. На основном графике в виде стрелок отображается потенциально выгодные
VIP Buy Sell Signals
Hapu Arachchilage Tharindu Lakmal
Here is a Live DEMO testing account for the indicator. ( Profit proofs ) Login (MT5) - 100246 Server - FusionMarkets-Demo Investor PW - VIPindicator@2024 Click bellow link to download the FREE strategy PDF for this indicator   (Google Drive) Download Strategy Introduction   The   "Buy Sell Signals"   is designed to provide BUY and SELL trade signals based on the current market conditions.   A   Profitable   Trading Strategy   (Chee sheet)   is provided for this trading indicator.   (Read the
Indicador Heikin Ashi multidivisa y multiplazo. Muestra el estado actual del mercado. En el panel del escáner puede ver la dirección, la fuerza y el número de barras de la tendencia actual. Las velas de Consolidación/Reversión también se muestran usando colores. Puede especificar las monedas y períodos que desee en los parámetros. Además, el indicador puede enviar notificaciones cuando cambia la tendencia o cuando aparecen velas de reversión y consolidación (dojis). Al hacer clic en una celda,
How to use Pair Trading Station Pair Trading Station is recommended for H1 time frame and you can use it for any currency pairs. To generate buy and sell signal, follow few steps below to apply Pair Trading Station to your MetaTrader terminal. When you load Pair Trading Station on your chart, Pair Trading station will assess available historical data in your MetaTrader platforms for each currency pair. On your chart, the amount of historical data available will be displayed for each currency pai
XCalper HiLo Activator
Aecio de Feo Flora Neto
HiLo Activator v1.02 by xCalper The HiLo Activator is similar to moving average of previous highs and lows. It is a trend-following indicator used to display market’s direction of movement. The indicator is responsible for entry signals and also helps determine stop-loss levels. The HiLo Activator was first introduced by Robert Krausz in the Feb. 1998 issue of Stocks & Commodities Magazine.
Master Calendar Osw
William Oswaldo Mayorga Urduy
MASTER CALENDAR OSW Este Indicador fue creado inicialmente para mi uso personal, pero lo he ido mejorando poco a poco e implementando funciones para ayudas de mi trading del día a día y se seguirán implementando funciones si son de utilidad. DETALLES DEL CALENDARIO. >Calendario móvil y detallado de las noticias cercanas a la fecha actual, con datos como: fecha, País, Moneda, Sector de la noticia, Nombre de la Noticia, y datos Previo, Predicción y Actual. >El Calendario se actualiza automáticamen
Trend Monitor MT5
Pavel Zamoshnikov
3.67 (3)
The indicator generates early signals basing on ADX reading data combined with elements of price patterns. Works on all symbols and timeframes. The indicator does not redraw its signals. You see the same things on history and in real time. For better visual perception signals are displayed as arrows (in order not to overload the chart). Features The best results are obtained when the indicator works on two timeframes. For example: M30 – the indicator shows the main trend; M5 – the indicator ge
Renko Gold
Ignacio Agustin Mene Franco
Renko Gold !  indica clara mente los pisos y techos donde va de 4 lineas ,  la linea de abajo que marca el piso en color verde confirmando con la linea mas fina aclara la entrada en compra ,  lo mismo es para la venta , la linea de arriba marca el techo y la mas fina de color  rojo marca la venta ,  este indicador sirve para todas las temporalidades !  Para los mercados de Forex y Indices sinteticos ! Tambien sirve para los mercados de crypto !  Buen Profit! World Inversor. 
Indicador único que implementa un enfoque profesional y cuantitativo para el comercio de reversión a la media. Aprovecha el hecho de que el precio se desvía y vuelve a la media de manera predecible y medible, lo que permite reglas claras de entrada y salida que superan ampliamente las estrategias comerciales no cuantitativas. [ Installation Guide | Update Guide | Troubleshooting | FAQ | All Products ] Señales comerciales claras Sorprendentemente fácil de operar Colores y tamaños personalizable
PipFinite Trend PRO MT5
Karlo Wilson Vendiola
4.87 (666)
Breakthrough Solution For Trend Trading And Filtering With All Important Features Built Inside One Tool! Trend PRO's smart algorithm detects the trend, filters out market noise and gives entry signals with exit levels. The new features with enhanced rules for statistical calculation improved the overall performance of this indicator. Important Information Revealed Maximize the potential of Trend Pro, please visit www.mql5.com/en/blogs/post/713938 The Powerful Expert Advisor Version Automa
Los compradores de este producto también adquieren
Primero que todo, vale la pena enfatizar que este Sistema de Trading es un Indicador No Repintado, No Redibujado y No Retrasado, lo que lo hace ideal tanto para el trading manual como para el automatizado. Curso en línea, manual y descarga de ajustes preestablecidos. El "Sistema de Trading Inteligente MT5" es una solución completa de trading diseñada para traders nuevos y experimentados. Combina más de 10 indicadores premium y presenta más de 7 estrategias de trading robustas, lo que lo convie
TPSpro RFI Levels MT5
Roman Podpora
4.67 (9)
Reversal First Impulse levels (RFI)      INSTRUCTIONS        RUS       -       ENG              R ecommended to use with an indicator   -   TPSpro  TREND PRO -  Version MT4                 A key element in trading is zones or levels from which decisions to buy or sell a trading instrument are made. Despite attempts by major players to conceal their presence in the market, they inevitably leave traces. Our task was to learn how to identify these traces and interpret them correctly. Main functi
TPSproTREND PrO MT5
Roman Podpora
4.89 (9)
TPSpro TREND PRO  - is a trend indicator that automatically analyzes the market and provides information about the trend and each of its changes, as well as giving signals for entering trades without redrawing! The indicator uses each candle, analyzing them separately. referring to different impulses - up or down impulse. Exact entry points into transactions for currencies, crypto, metals, stocks, indices!  Version MT4               DETAILED DESCRIPTION               R ecommended to use with an
Quantum Trend Sniper
Bogdan Ion Puscasu
4.92 (48)
Introduciendo       Indicador Quantum Trend Sniper   , el innovador indicador MQL5 que está transformando la forma en que identificas y negocias los cambios de tendencia. Desarrollado por un equipo de comerciantes experimentados con experiencia comercial de más de 13 años,       Indicador de francotirador de tendencia cuántica       está diseñado para impulsar su viaje comercial a nuevas alturas con su forma innovadora de identificar cambios de tendencia con una precisión extremadamente alta.
FX Power MT5 NG
Daniel Stein
5 (6)
Obtenga su actualización diaria del mercado con detalles y capturas de pantalla a través de nuestro Morning Briefing aquí en mql5 y en Telegram ! FX Power MT5 NG es la nueva generación de nuestro popular medidor de fuerza de divisas, FX Power. ¿Y qué ofrece este medidor de fuerza de nueva generación? Todo lo que le encantaba del FX Power original PLUS Análisis de fuerza de ORO/XAU Resultados de cálculo aún más precisos Períodos de análisis configurables individualmente Límite de cálculo persona
Este tablero muestra los últimos   patrones armónicos   disponibles para los símbolos seleccionados, por lo que ahorrará tiempo y será más eficiente /   versión MT4 . Indicador gratuito:   Basic Harmonic Pattern Columnas del indicador Symbol:   aparecerán los símbolos seleccionados Trend :   alcista o bajista Pattern :   tipo de patrón (gartley, mariposa, murciélago, cangrejo, tiburón, cifrado o ABCD) Entry :   precio de entrada SL:   precio de stop loss TP1:   1er precio de toma de benefici
Este es un genial indicador para MT5 que ofrece señales precisas para entrar en una transacción sin redibujar. Se puede aplicar a cualquier activo financiero: fórex, criptomonedas, metales, acciones, índices. Nos dará valoraciones bastante precisas y nos dirá cuándo es mejor abrir y cerra una transacción. Eche un vistazo  al vídeo  (6:22), ¡contiene un ejemplo de procesamiento de una sola señal que ha amortizado el indicador! La mayoría de los tráders mejoran sus resultados comerciales durante l
Ahora $ 147 (aumentando a $ 499 después de algunas actualizaciones) - Cuentas ilimitadas (PC o Mac) Manual de usuario de RelicusRoad + Videos de capacitación + Acceso al grupo privado de Discord + Estado VIP UNA NUEVA MANERA DE VER EL MERCADO RelicusRoad es el indicador comercial más poderoso del mundo para divisas, futuros, criptomonedas, acciones e índices, y brinda a los comerciantes toda la información y las herramientas que necesitan para mantenerse rentables. Brindamos análisis téc
Blahtech Supply Demand MT5
Blahtech Limited
4.54 (13)
Was: $299  Now: $99   Supply Demand uses previous price action to identify potential imbalances between buyers and sellers. The key is to identify the better odds zones, not just the untouched ones. Blahtech Supply Demand indicator delivers functionality previously unavailable on any trading platform. This 4-in-1 indicator not only highlights the higher probability zones using a multi-criteria strength engine, but also combines it with multi-timeframe trend analysis, previously confirmed swings
Advanced Supply Demand MT5
Bernhard Schweigert
4.53 (15)
¡Actualmente con 33% de descuento! ¡La mejor solución para cualquier tráder principiante o experto! Este indicador es una herramienta comercial única, de alta calidad y asequible, porque incorpora una serie de características patentadas y una nueva fórmula. Con esta actualización, podrá mostrar zonas de doble marco temporal. No solo podrá mostrar un marco temporal más alto, sino también mostrar ambos, el marco temporal del gráfico MÁS el marco temporal más alto: MOSTRANDO ZONAS ANIDADAS. A todos
Introduction to X3 Chart Pattern Scanner X3 Cherart Pattern Scanner is the non-repainting and non-lagging indicator detecting X3 chart patterns including Harmonic pattern, Elliott Wave pattern, X3 patterns, and Japanese Candlestick patterns. Historical patterns match with signal patterns. Hence, you can readily develop the solid trading strategy in your chart. More importantly, this superb pattern scanner can detect the optimal pattern of its kind. In addition, you can switch on and off individu
Introduciendo       Quantum Breakout PRO   , el innovador indicador MQL5 que está transformando la forma en que comercia con Breakout Zones. Desarrollado por un equipo de comerciantes experimentados con experiencia comercial de más de 13 años,       Desglose cuántico PRO       está diseñado para impulsar su viaje comercial a nuevas alturas con su innovadora y dinámica estrategia de zona de ruptura. El indicador de ruptura cuántica le dará flechas de señal en las zonas de ruptura con 5 zonas
AT Forex Indicator MT5
Marzena Maria Szmit
5 (4)
The AT Forex Indicator MT5 is a sophisticated trading tool designed to provide traders with a comprehensive analysis of multiple currency pairs. This powerful indicator simplifies the complex nature of the forex market, making it accessible for both novice and experienced traders. AT Forex Indicator uses advanced algorithms to detect trends, patterns and is an essential tool for traders aiming to enhance their forex trading performance. With its robust features, ease of use, and reliable signal
Gold TMAF MTF - es el mejor indicador técnico bursátil. El algoritmo del indicador analiza el movimiento del precio de un activo y refleja la volatilidad y las posibles zonas de entrada. Las mejores señales del indicador: - Para VENTA = límite superior rojo de TMA2 por encima del límite superior rojo de TMA1 + indicador fractal rojo por encima + flecha amarilla de señal SR en la misma dirección. - Para COMPRA = límite inferior azul de TMA2 por debajo del límite inferior azul de TMA1 + i
Elliott Wave Trend was designed for the scientific wave counting. This tool focuses to get rid of the vagueness of the classic Elliott Wave Counting using the guideline from the template and pattern approach. In doing so, firstly Elliott Wave Trend offers the template for your wave counting. Secondly, it offers Wave Structural Score to assist to identify accurate wave formation. It offers both impulse wave Structural Score and corrective wave Structure Score. Structural Score is the rating to sh
Gartley Hunter Multi
Siarhei Vashchylka
5 (8)
Gartley Hunter Multi - An indicator for searching for harmonic patterns simultaneously on dozens of trading instruments and on all possible timeframes. Manual (Be sure to read before purchasing) | Version for MT4 Advantages 1. Patterns: Gartley, Butterfly, Shark, Crab. Bat, Alternate Bat, Deep Crab, Cypher 2. Simultaneous search for patterns on dozens of trading instruments and on all possible timeframes 3. Search for patterns of all possible sizes. From the smallest to the largest 4. A
FX Volume MT5
Daniel Stein
4.94 (17)
Obtenga su actualización diaria del mercado con detalles y capturas de pantalla a través de nuestro Morning Briefing aquí en mql5 y en Telegram ! FX Volume es el PRIMER y ÚNICO indicador de volumen que proporciona una visión REAL del sentimiento del mercado desde el punto de vista de un bróker. Proporciona una visión impresionante de cómo los participantes institucionales del mercado, como los brokers, están posicionados en el mercado Forex, mucho más rápido que los informes COT. Ver esta info
IVISTscalp5
Vadym Zhukovskyi
5 (5)
Te presentamos el indicador iVISTscalp5, que no solo es único sino también efectivo en operaciones de trading. Este indicador se basa en datos temporales y es el resultado de muchos años de experiencia y análisis profundo de los mercados financieros. El indicador iVISTscalp5 es una excelente herramienta para el trading manual. La conveniencia, simplicidad y visualización, toda la complejidad está oculta en su interior. Hemos simplificado al máximo la configuración y uso del indicador iVISTscalp5
Was: $249  Now: $99   Market Profile defines a number of day types that can help the trader to determine market behaviour. A key feature is the Value Area, representing the range of price action where 70% of trading took place. Understanding the Value Area can give traders valuable insight into market direction and establish the higher odds trade. It is an excellent addition to any system you may be using. Inspired by Jim Dalton’s book “Mind Over Markets”, this indicator is designed to suit the
If you want to find good trading opportunities, then you must trade near the Trend Line. This allows you to have a tighter         stop loss   on your trades — which improves your       risk to reward . But that’s not all… Because if you combine Trend Line with Support and Resistance, that’s where you find the best trading opportunities. Now you might wonder: “So when do I enter a trade?” Well, you can use reversal     candlestick patterns   (like the   Hammer, Bullish Engulfing, etc.) as your e
XQ Indicator MetaTrader 5
Marzena Maria Szmit
5 (1)
Step into the realm of Forex trading with confidence and precision using XQ, a cutting-edge Forex indicator designed to elevate your trading game to unprecedented heights. Whether you're a seasoned trader or just stepping into the world of currency exchange, XQ Forex Indicator empowers you with the insights and signals needed to make informed trading decisions. The signal conditions are a combination of three indicators, and XQ Forex Indicator only display  medium and long-term trends . The ind
Order Block Hunter MT5
Noha Mohamed Fathy Younes Badr
5 (1)
Order block hunter indicator is the best indicator for  hunt the order blocks that area where there has been a large concentration of limit orders waiting to be executed Order blocks are identified on a chart by observing previous price action and looking for areas where the price experienced significant movement or sudden changes in direction .This indicator does that for you by using very complicated codes and helps you to take the best areas To buy and sell because it make marks at the best a
Market Overview MT5
Mehran Sepah Mansoor
Optimice sus decisiones de trading con nuestro indicador de fuerza y sentimiento del mercado y deje de operar contra tendencia! Diseñado meticulosamente para los operadores serios que valoran la información precisa y oportuna, nuestro indicador proporciona una vista de pájaro de los 28 pares principales de una manera muy sencilla. Esta herramienta es capaz de clasificar los pares de divisas basándose en términos de popularidad, fuerza de tendencia alcista o bajista y porcentaje de compradores y
Gold ATR MTF: este es un excelente indicador técnico de acciones. El algoritmo del indicador ATR (Average True Range) analiza el movimiento del precio del activo y refleja la volatilidad dibujando los niveles correspondientes en porcentajes específicos (%) del precio de apertura del período de tiempo especificado (D1). Los indicadores (rojo y/o azul D1 H4) de la dirección del movimiento del precio del símbolo y las señales de flecha son ayudas adicionales y esenciales para una negociación y/o e
Este es posiblemente el indicador de reconocimiento automático de formación de precios más completo que puede encontrar para la plataforma MetaTrader. Detecta 19 patrones diferentes, toma las proyecciones de Fibonacci tan en serio como usted, muestra la zona de reversión potencial (PRZ) y encuentra niveles adecuados de stop-loss y take-profit. [ Guía de instalación | Guía de actualización | Solución de problemas | FAQ | Todos los productos ] Detecta 19 formaciones de precios armónicos difer
Royal Scalping Indicator M5
Vahidreza Heidar Gholami
5 (8)
Royal Scalping Indicator is an advanced price adaptive indicator designed to generate high-quality trading signals. Built-in multi-timeframe and multi-currency capabilities make it even more powerful to have configurations based on different symbols and timeframes. This indicator is perfect for scalp trades as well as swing trades. Royal Scalping is not just an indicator, but a trading strategy itself. Features Price Adaptive Trend Detector Algorithm Multi-Timeframe and Multi-Currency Trend Low
Trend Forecaster
Alexey Minkov
5 (6)
The Trend Forecaster indicator utilizes a unique proprietary algorithm to determine entry points for a breakout trading strategy. The indicator identifies price clusters, analyzes price movement near levels, and provides a signal when the price breaks through a level. The Trend Forecaster indicator is suitable for all financial assets, including currencies (Forex), metals, stocks, indices, and cryptocurrencies. You can also adjust the indicator to work on any time frames, although it is recommen
Volume by Price MT5
Brian Collard
3.6 (5)
The Volumebyprice.com Indicator for MetaTrader 5 features Volume Profile and Market Profile TPO (Time Price Opportunity). Volume and TPO histogram bar and line charts. Volume Footprint charts. TPO letter and block marker collapsed and split structure charts. Static, dynamic and flexible range segmentation and compositing methods with relative and absolute visualizations. Session hours filtering and segment concatenation with Market Watch and custom user specifications. Graphical layering, posit
El indicador muestra los puntos de entrada y salida más adecuados. También muestra datos estadísticos sobre todas las señales para un mejor análisis de las operaciones. Con la ayuda de este indicador podrá comprender mejor el mercado. Tan pronto como la fuerza de la tendencia comience a debilitarse (esto se mostrará en el panel), la línea de tendencia gravitará hacia la posición horizontal - esta es la señal para salir de la operación. O puede salir cuando se alcance el nivel de beneficio me
Quantum Heiken Ashi PRO MT5
Bogdan Ion Puscasu
4.5 (8)
Presentamos el   Quantum Heiken Ashi PRO Diseñadas para brindar información clara sobre las tendencias del mercado, las velas Heiken Ashi son reconocidas por su capacidad para filtrar el ruido y eliminar las señales falsas. Diga adiós a las confusas fluctuaciones de precios y dé la bienvenida a una representación gráfica más fluida y confiable. Lo que hace que Quantum Heiken Ashi PRO sea realmente único es su fórmula innovadora, que transforma los datos de velas tradicionales en barras de colore
Otros productos de este autor
DG DayInfo
David Gadelha
4.8 (10)
Purpose DG DayInfo is a free indicator that shows information about: Day's maximum prices; Day's minimum prices; Day's percentual variations; Daily candle direction (Up, Down or Flat); Candle timer; This way, DG DayInfo helps you to see day's maximum and minimum, check day's percentual variation and time left to close candle. Key features Designed to be simple to use, with a few parameters Works in ALL pairs Works within ALL time frames* Main Indicator Parameters Days - Set to how many days
FREE
Filtro:
James Erasmus
1045
James Erasmus 2023.06.07 11:06 
 

Really like this indicator, great concept and thought went into this, many possibilities. Not really reprint, only when bar changes direction, but once exit or entry is set it does not reprint. Nice features thanks. Needed assistance on buffer for arrows, also indicator prints on chart data top left, this is slowing test and obstructing chart view, no option to remove this. He has not responded to several messages over months.

Respuesta al comentario