Strong Retracement Points
- Indicadores
- Farhad Kia
- Versión: 1.1
- Actualizado: 28 junio 2017
- Activaciones: 5
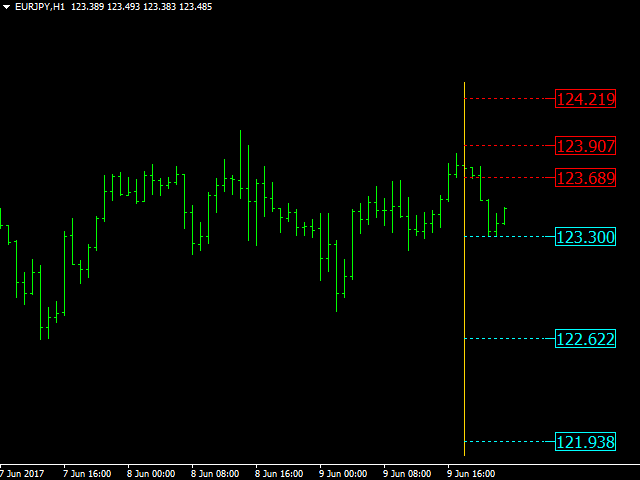
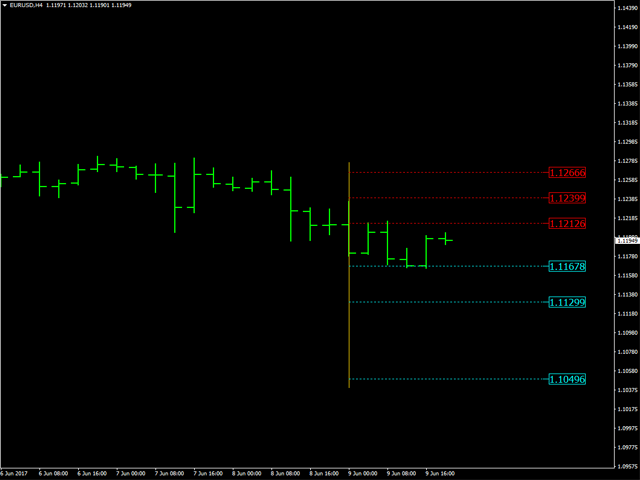
SRP (Strong Retracement/Reversal Points) is a powerful and unique support and resistance indicator.
It displays the closest important levels which we expect the price retracement/reversal!
If all level are broken from one side, it recalculates and draws new support and resistance levels, so the levels might be valid for several days depending on the market!
Key Features
- You can use it in all time-frames smaller than daily!
- Displays closest significant support and resistance levels
- Update the levels if all levels are clearly broken
- The levels are time independent means that these levels are valid in all time-frames which make this indicator very unique!
- It can be very helpful as a complementary tool for your own trading system to adjust the stop-loss or take-profit, and can also be a helpful stand-alone tool for scalpers!


This is Amazing! It magically works , Well Done!