Versión 5.21
2023.07.27
Bags fixed
Versión 5.20
2023.01.26
In the new version of the Geo_Info 5.2 indicator, in addition to the already familiar for users voicing profitable positions using parameters:
• Positive Pro fit Sound Enable = True; //Play Sound When Profit.
• SoundFile = "Tick.wav"; //Your Profit Sound
thanks to the idea of @fxproaddicted, you can now hear a signal or music when closing orders. The sound file must be located in the Sound folder.
• CloseOrderSoundEnable = True; //Play Sound When Order To Close.
• CloseOrderSoundFile = "Money.wav"; //File To Play
Versión 5.15
2023.01.10
Исправлены ошибки
Versión 5.13
2023.01.10
Fixed Bugs.
Thanks to fxproaddicted !!
Grazie!!
Versión 5.12
2023.01.10
Geo_Info - ahora el estándar de equipamiento de la terminal de trabajo del comerciante.
Geo_Info - uno de los indicadores más informativos, en una forma compacta muestra la información básica sobre el instrumento de negociación, las posiciones abiertas, muestra los niveles NETOS.
La versión 5.2 contiene un indicador de información fundamentalmente nuevo, que anteriormente no estaba disponible para los comerciantes.
En la versión anterior, el indicador mostraba el Tamaño de ATR , el rango medio durante varios períodos.
Ahora hemos agregado una visualización de la relación de rango medio al spread.
Esta simple acción le brinda un nuevo conocimiento que lleva al comerciante a un nuevo nivel de comprensión de la efectividad de trabajar en un instrumento determinado en un momento dado.
De hecho, si en el momento actual en el instrumento seleccionado, la relación del rango medio con el spread en el marco de tiempo seleccionado está cerca del valor del spread, o lo excede ligeramente, tiene sentido considerar un marco de tiempo más antiguo o cambiar el instrumento por uno más eficiente.
Todas las demás posibilidades se dejan sin cambios.
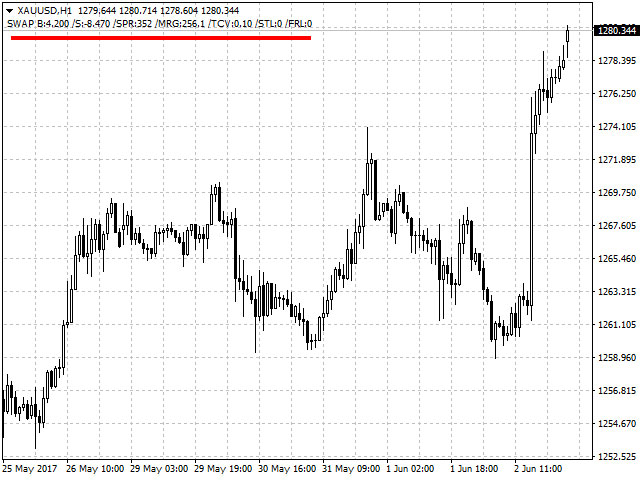
Muestra en la línea en la esquina superior izquierda del gráfico en forma resumida información sobre los parámetros principales de la herramienta:
Swap para la orden Buy, swap para la orden Sell, spread actual, depósito (margen), Tamaño de Tick, nivel de Stop, nivel de congelación de órdenes. La información se muestra por lote y en puntos.
La información se muestra de la siguiente manera: SWAP B:4.200 /S:-8.470 / SPR: 342 / MRG: 256.0 / TCV: 0.10 / STL: 0 / FRL
Puede activar/desactivar la visualización de esta información en los parámetros del indicador.
Existe la posibilidad de Mostrar en la segunda línea en la esquina superior izquierda del gráfico en forma resumida información sobre los principales parámetros de las posiciones comerciales en este instrumento: el número de órdenes Buy, Sell, BuyStop, SellStop, BuyLimt, SellLimit, así como el número total de lotes de posiciones abiertas.
La información se muestra de la siguiente manera: B: 0 S: 1 BS: 0 SS: 0 BL: 0 SL: 1 / LotB: 0 LotS:0.1
Puede activar/desactivar la visualización de esta información en los parámetros del indicador.
En la nueva versión, se muestra información sobre el monto de las ganancias actuales y los swaps acumulados para el instrumento en total para las posiciones BUY y SELL en el formato:
Profite_Info: ProfitB:125 SwapB:-2 ProfitS:-20 SwapS:-1 Total:102
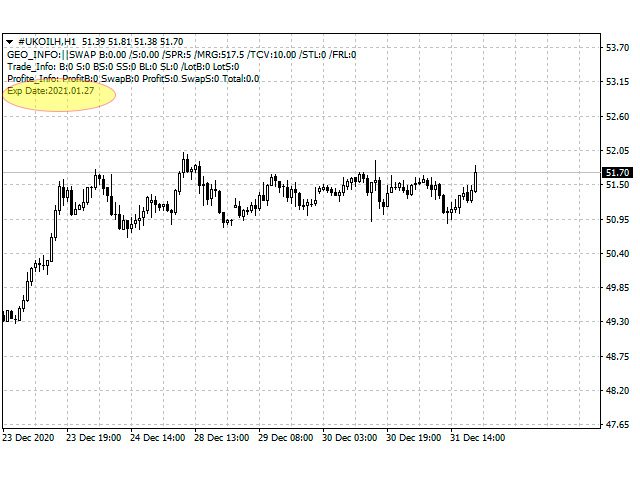
Para los instrumentos a plazo (futuros), se muestra la fecha de vencimiento en el formato:
Exp Date:2022.02.18
Además, ahora tiene la oportunidad de Mostrar en el gráfico "Líneas cero" (los nombres de las líneas son "ZeroBuy" y "ZeroSell") para cada grupo de órdenes de compra y venta, es decir, los niveles de las posiciones netas Buy y Sell, donde el beneficio total de todas las órdenes de compra (venta) (teniendo en cuenta los swaps acumulados) será igual a 0. Cada nivel se muestra con una línea de su propio color. Los niveles se calculan en función de las órdenes abiertas.
Además, si hay órdenes pendientes, se muestran adicionalmente "Líneas cero" (los nombres de las líneas son "ZeroBuyP" y "ZeroSellP"), que muestran los niveles NETOS teniendo en cuenta si las órdenes pendientes funcionan.
Estos niveles se muestran por rayos.
Útil para los comerciantes que trabajan en múltiples posiciones utilizando topping, Grid. Por lo tanto, las líneas reflejan la posición NETA para cada grupo (compra y venta) tanto de las órdenes abiertas como de las pendientes.
Puede activar/desactivar la visualización de líneas, así como seleccionar el color de las líneas en los parámetros del indicador.
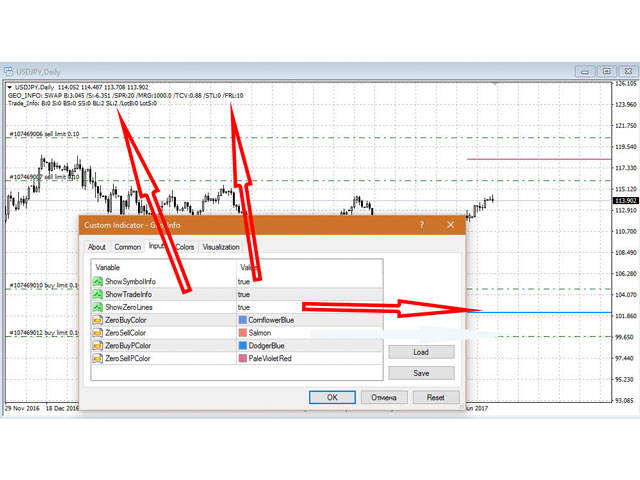
Parámetros
ShowSymbolInfo = True-True o False-Mostrar o no información de la herramienta
ShowTradeInfo = True-True o False-Mostrar o no información sobre las posiciones comerciales
ShowZeroLines = True-True o False-Mostrar o no la" Línea Cero " de los niveles de compra y venta
ZeroBuyColor = clrCornflowerBlue-color "Línea Cero" para órdenes BUY abiertas.
ZeroSellColor = clrSalmon-el color de la "Línea Cero" para las órdenes de VENTA abiertas.
ZeroBuyPColor = clrDodgerBlue-el color de la "Línea Cero" para las órdenes BUY teniendo en cuenta las pendientes.
ZeroSellPColor = clrPaleVioletRed-el color de la "Línea Cero" para las órdenes de VENTA teniendo en cuenta las pendientes.
Versión 5.11
2022.02.08
Уточнено отображение стоимости тика для разных инструментов.
TCV
Versión 5.1
2022.02.08
Fixed a bug that caused the indicator to temporarily freeze and incorrectly display the current situation, sometimes occurring on a thin market, or between sessions.
Versión 5.0
2021.04.11
The 5th version of the popular Geo_Info indicator is released.
Geo_Info - one of the most informative indicators, in a compact form displays basic information about a trading instrument, open positions, displays NET levels, etc. being a free indicator, available to everyone, and has already become a standard, in fact, a "must-have" indicator in equipping a trader's workspace.
Now, the displayed information has been supplemented with the reading of the ATR indicator, which shows the average value of the size of the instrument's stroke for the selected period, and the value of the ratio of this value to the size of the spread on the instrument, which allows us to evaluate the expected efficiency of work on this instrument on the selected timeframe.
If the spread is close to the current average volatility, then it makes sense to move to a higher time frame to reduce the influence of the spread on the trading result.
The parameters were added accordingly:
input bool ShowATRInfo = True; - whether or not to display the ATR section
input int ATR = 14; - period for calculating ATR
Versión 4.0
2021.01.01
Now to display the information about the expiration date for instruments with an expiration date.
Versión 3.0
2020.03.10
What's new:
The Geo_Info indicator version 3.0 displays in a third line in the upper left corner of the chart a summary of the main trading parameters for instrument: Profit and swap for BUY orders, profit and swap for SELL orders, as well as total profit for the instrument. Information is displayed in short form, for example: ProfitB: 110 SwapB: 10 ProfitS: 0 SwapS: 0 Total: 120.1
Also added the ability to voice the wonderful event when a positive profit is at the instrument. Setting the "PositiveProfitSoundEnable" parameter to "True" will allow you to play sound when a positive profit is on the instrument. The default sound is "tick.wav". You can change the sound in the "SoundFile" parameter. As always, the Geo_Info indicator is free.
Versión 2.0
2017.07.21
Indicator Geo_Info version 2.0 displays in left upper corner the second line with short info about trading position: quantity of Buy, Sell, BuyStop, SellStop, BuyLimt, SellLimit orders, and also summary Lot Size of open trades. Info is presented as below:
B:0 S:1 BS:0 SS:0 BL:0 SL:1/LotB:0 LotS:0.1
Besides, now you can see "Zero Lines" for both Sell and Buy groups of trading orders. There are two lines of different colors that indicate the levels where profit (including swaps) of all Sell positions and separately profit of all Buy positions is 0. Only open position are calculated.
Also, if you have or place pending orders, you will see "Zero Lines" for pending orders, that means that they show the levels, where profit is 0 for all open and pending orders. Those levels are displays as rays.
The indicator is useful for traders that can use several positions and/or orders. The lines display a net position for each group of orders (buy and sell).
Using the parameters of indicators, you can choose what to show on the chart, as well select the color of lines.


ОГОНЬ !!!!