• Información general
  • Comentarios (2)
  • Discusión (6)

Price Velocity

5

The indicator calculates the average price velocity over the specified time period. It is known that the trading time flows unevenly, in bursts. It either goes faster, or slows down. This indicator will tell if the trading time has accelerated and it is necessary to go to the smaller timeframes to search for trade signals.


Usage

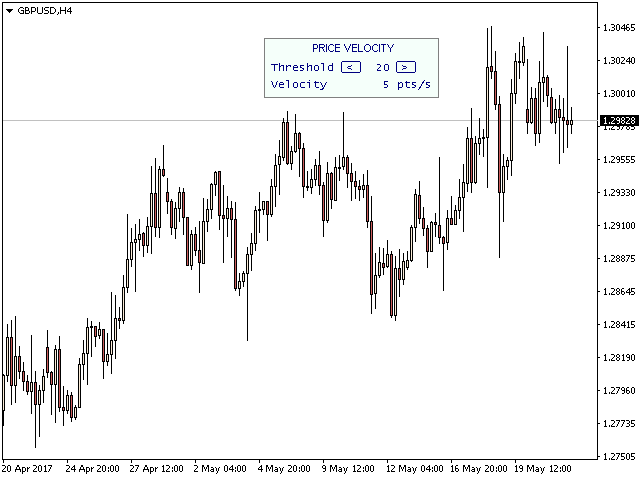
Alert is generated when the price velocity exceeds the specified threshold. The threshold value can be modified using the buttons on the information panel. A .wav file from the set of standard terminal sounds or any other audio file can be used as the audio alert. A third-party file should be placed to <MT4 terminal>\Sounds folder, after that its name should be specified in the indicator settings.

The information panel of the indicator can be selected (double click) and dragged in the main chart window using the mouse.


Input parameters

  • Price - applied price: bid, ask, (bid+ask)/2;
  • Averaging time interval, ms - duration of the averaging interval in milliseconds;
  • SoundFile name - name of the .wav audio file;
  • InfoPanel background color - background color of the information panel;
  • InfoPanel text color - text color of the information panel;
  • InfoPanel text fontsize - text size of the information panel.
Comentarios 2
zainul134
44
zainul134 2022.12.13 07:27 
 

Thanks for the indicator Oleg. Indicator good at indicating volatile markets.

Productos recomendados
TrendPlus
Sivakumar Subbaiya
4.08 (12)
Trend Plus   Trendplus  Indicator   Time Frame: Suitable for any time frame.  Purpose: Trend Prediction. Blue and red candle indicate the buy and sell call respectively. Buy: When the blue candle is formed buy call is initiated. close the buy trades when the next red candle will formed.   Sell: When the Red candle is formed Sell call is initiated. close the Sell trades when the next blue candle will formed.   Happy trade!!
FREE
MT4 Candlestick Pattern Alert Indicator: Stay Ahead of Trading Opportunities Overview The MT4 Candlestick Pattern Alert Indicator is a robust tool designed to empower traders by detecting candlestick patterns and delivering timely alerts through notifications, emails, and pop-up alerts. This invaluable tool saves traders precious time, allowing focused analysis on patterns and potential profitable trades. Importance of Candlestick Patterns Candlestick patterns are pivotal in technical analysis,
FREE
TrendFinder VolumeI are Colored candlesticks showing the trend based on Volume and Slope of Trend This indicator will give you the color change on the next bar on the confirmation candle and will never repaint Lime Green = Possible Buy (Volume up),  Teal Green = Bullish Weak (Volume Decreasing), Red = Possible Sell (Volume up) , Orange = Bearish Weak (Volume Decreasing) TrendFinder Volume is optimize to trade on any market and to be used trending and None trending markets. For best results us
FREE
Pivot Point Fibo RSJ es un indicador que rastrea las líneas de soporte y resistencia del día utilizando las tasas de Fibonacci. Este espectacular indicador crea hasta 7 niveles de soporte y resistencia a través del Pivot Point utilizando las tasas de Fibonacci. Es fantástico cómo los precios respetan cada nivel de este soporte y resistencia, donde es posible percibir posibles puntos de entrada / salida de una operación. Características Hasta 7 niveles de soporte y 7 niveles de resistencia
FREE
Discover the power of precision and efficiency in your trading with the " Super Auto Fibonacci " MT4 indicator. This cutting-edge tool is meticulously designed to enhance your technical analysis, providing you with invaluable insights to make informed trading decisions. Key Features: Automated Fibonacci Analysis: Say goodbye to the hassle of manual Fibonacci retracement and extension drawing. "Super Auto Fibonacci" instantly identifies and plots Fibonacci levels on your MT4 chart, saving you tim
FREE
High Low Open Close MT4
Alexandre Borela
4.79 (19)
Si te gusta este proyecto, deja una revisión de 5 estrellas. Seguir en instagram: borelatech Este indicador dibuja los precios abiertos, altos, bajos y finales para los especificados período y se puede ajustar para una zona horaria específica. Estos son niveles importantes considerados por muchos institucionales y profesionales comerciantes y puede ser útil para que usted sepa los lugares donde podrían ser más activo. Los períodos disponibles son: Día previo. Semana anterior. Mes anteri
FREE
FusionAlert StochRSI Master is an indicator available for MT4/MT5 platforms, it is a combination of RSI & Stochastic indicator which provide "alerts" when the market is inside "overbought and oversold" regions combined for both indicators, results in more precise and accurate signals to be used as a wonderful tool, in the form of "buy or sell" signals. This indicator comes with many customization options mentioned in the parameter section below, user can customise these parameters as needful. Jo
FREE
HMA Trend
Pavel Zamoshnikov
4.6 (68)
A trend indicator based on the Hull Moving Average (HMA) with two periods. The Hull Moving Average is an improved variant of the moving average, which shows the moment of trend reversal quite accurately. It is often used as a signal filter. Combination of two types of Hull Moving Averages makes a better use of these advantages: HMA with a slow period identifies the trend, while HMA with a fast period determines the short-term movements and signals in the trend direction. Features The movement
FREE
QualifiedEngulfing
Ashkan Hazegh Nikrou
QualifiedEngulfing - es la versión gratuita del indicador ProEngulfing ProEngulfing - es la versión de pago del indicador Advance Engulf, descárguela aquí. ¿Cuál es la diferencia entre la versión gratuita y la de pago de ProEngulfing ? La versión gratuita tiene la limitación de un solo señal por día. Presentamos QualifiedEngulfing - Su indicador profesional de patrones Engulf para MT4 Desbloquee el poder de la precisión con QualifiedEngulfing, un indicador de vanguardia diseñado para identifica
FREE
Triple RSI
Pablo Leonardo Spata
1 (1)
MIRA LA SIGUIENTE ESTRATEGIA CON ESTE INDICADOR. Triple RSI es una herramienta que utiliza el clásico RSI, pero en varios períodos de tiempo para encontrar reversiones del mercado.    1.  ️ Idea detrás del indicador y su estrategia: En el trading, ya sea Forex o cualquier otro activo, lo ideal es mantenerlo simple, cuanto más simple, mejor . La estrategia triple RSI es una de las estrategias simples que buscan retornos de mercado. En nuestra experiencia, donde siempre hay más dinero p
FREE
Wise Men Indicator demo
Bohdan Kasyanenko
3 (2)
The indicator displays signals according to the strategy of Bill Williams on the chart. Demo version of the indicator has the same features as the paid, except that it can work only on a demo account . Signal "First Wise Man" is formed when there is a divergent bar with angulation.  Bullish divergent bar - with lower minimum and closing price in the upper half. Bearish divergent bar - higher maximum and the closing price at the bottom half. Angulation is formed when all three lines of Alligat
FREE
Pro Support Resistance
Suvashish Halder
4.75 (4)
This is the best Support and Resistance Indicator on the market, and it shows both confirmed Support and Resistance as well as Retests. Support & Resistance: Support marks where buying demand halts price declines, acting as a safety net. Resistance caps price surges, driven by selling pressure. Traders leverage these levels to predict reversals, plan entries, exits, and manage risks, making them trading's fundamental guideposts. You can also find Premium and Discount Levels, Strong High/Low, Wea
FREE
Head and Shoulders Pattern Indicator - Your Key to Recognizing Trend Reversals Unlock the power of pattern recognition with the "Head and Shoulders Pattern Indicator." This cutting-edge tool, designed for MetaTrader, is your trusted ally in identifying one of the most powerful chart patterns in technical analysis. Whether you're a novice or an experienced trader, this indicator simplifies the process of spotting the Head and Shoulders pattern, allowing you to make informed trading decisions. Key
FREE
CCI in MA
Nikolaos Pantzos
4.75 (4)
iCC in iMA is indicator to change color in iMA if iCCI crosses level up (up trend) or crosses level down (down trend). It is a useful tool to track when the upside and the downside iCCI on iMA. You can to get source code from here . Parameters MA_Periods —Period for iMA. MA_Method — Method for iMA. CCI_Periods —Period for iCCI. CCI_ApliedPrice — Price used for iCCI. CCI_LevelsUp — Level iCCI for up trend. CCI_LevelsDN — Level iCCI for down trend. BarsCount — How many bars will show the line.
FREE
Are you tired of drawing trendlines every time you're analyzing charts? Or perhaps you would like more consistency in your technical analysis. Then this is for you. This indicator will draw trend lines automatically when dropped on a chart. How it works Works similar to standard deviation channel found on mt4 and mt5. It has 2 parameters: 1. Starting Bar 2. Number of bars for calculation The   starting bar   is the bar which drawing of the trend lines will begin, while the   number of bars for c
FREE
Toby Strategy Indicator
Ahmd Sbhy Mhmd Ahmd ʿYshh
The indicator rely on The Toby strategy >> The mother candle which is bigger in range than the previous six candles. A vertical line shows the last Toby Candle with the targets shown up and down. The strategy is about the closing price out of the range of the toby candle to reach the 3 targets..The most probable to be hit is target1 so ensure reserving your profits and managing your stop lose.
FREE
UPD1 Rsi Dots Dashboard
Vitaliy Kuznetsov
5 (1)
El indicador muestra señales basadas en el oscilador RSI del terminal en el gráfico. Es posible filtrar señales repetidas. En este caso, el oscilador se utiliza para buscar una señal inversa. Se recomienda como punto de entrada en estrategias de swing y trading desde niveles. Está disponible un panel de control multidivisa. Con él, puede cambiar fácilmente entre gráficos. En las discusiones de productos, puede sugerir un algoritmo en el que puede incrustar un panel de control. Parámetros
FREE
Rule Plotter MT4
Francisco Gomes Da Silva
5 (1)
Cómo Crear un Robot de Trading Automatizado con Rule Plotter ¿Alguna vez has imaginado lo poderoso que sería poder automatizar tus estrategias de trading con solo unos clics del mouse? Imagina tener la libertad de crear y probar diferentes estrategias de trading sin necesidad de sumergirte en complicados códigos. Con Rule Plotter, esta visión se hace realidad. Aquí exploraremos cómo puedes crear tu propio robot de trading personalizado usando Rule Plotter, una herramienta de creación de sistemas
FREE
Traditional MACD MT4
Daniel Lewis
4.59 (56)
El indicador MACD en MetaTrader 4/5 se diferencia de los semejantes indicadores en otros programas. Eso se debe al hecho de que en la versión MetaTrader 4/5 la línea MACD se muestra en forma del histograma, mientras que habitualmente se muestra en forma de la línea. Además, en la versión MetaTrader 4/5 la línea de señal se construye con el uso de SMA, mientras que por definición tiene que construirse usando EMA. En la versión MetaTrader 4/5 también se diferencia el histograma (la diferencia entr
FREE
Trend indicator Trend Esay MTF is an indicator that draws arrows directly on the price chart. Like every trend indicator, it works well with good price movement and worse in a flat. A feature of this indicator is the ability to send alerts both in the terminal and on a smartphone. The indicator menu contains the number of bars in the history of the indicator and period value for determining the trend. The "trend" function has been added to the indicator menu, which filters the indicator signals
FREE
Cumulative Delta MT4
Evgeny Shevtsov
4.93 (27)
The indicator analyzes the volume scale and splits it into two components - seller volumes and buyer volumes, and also calculates the delta and cumulative delta. The indicator does not flicker or redraw, its calculation and plotting are performed fairly quickly, while using the data from the smaller (relative to the current) periods. The indicator operation modes can be switched using the Mode input variable: Buy - display only the buyer volumes. Sell - display only the seller volumes. BuySell -
FREE
UPD1 X00 Levels
Vitaliy Kuznetsov
5 (8)
El indicador muestra niveles   redondos   en el gráfico. También se denominan niveles   psicológicos , bancarios o de jugadores importantes. En estos niveles, hay una verdadera pelea entre alcistas y bajistas, la acumulación de muchos pedidos, lo que conduce a una mayor volatilidad. El indicador se ajusta   automáticamente   a cualquier instrumento y período de tiempo. Cuando el   nivel 80   se rompe y luego se prueba,   compramos . Cuando el   nivel 20   se rompe y luego se prueba,   vendemos
FREE
OrderBlock TS Roman
Vladislav Vlastovskii
3.8 (5)
Индикатор строит блоки заказов (БЗ) по торговой системе (ТС) Романа. Поиск блоков осуществляется одновременно на двух таймфремах: текущем и старшем (определяемым в настройках). Для оптимизации и игнорирования устаревших блоков в настройках задается ограничение количества дней в пределах которых осуществляется поиск блоков. Блоки строятся по правилам ТС состоящем из трех шагов: какую свечу вынесли (что?); какой свечой вынесли (чем?); правило отрисовки (как?).
FREE
Rainbow MT4
Jamal El Alama
Rainbow MT4 is a technical indicator based on Moving average with period 34 and very easy to use. When price crosses above MA and MA changes color to green, it’s a signal to buy. When price crosses below MA and MA changes color to red, it’s a signal to sell. The Expert advisor ( Rainbow EA MT4) based on Rainbow MT4 indicator, as you can see in the short video below is now available here .
FREE
This simple indicator paints with a darker color on the volume bar when the quantity traded is above the average of select number of periods of the volume itself, highlighting the moments when there was a large volume of deals above the average. It is also possible to use a configuration of four colors where the color tone shows a candle volume strength. The indicator defaults to the simple average of 20 periods, but it is possible to change to other types of averages and periods. If you like
FREE
Check my paid tools they work great and I share Ea's based on them for free please r ate The Dual Timeframe RSI (Relative Strength Index) indicator is a novel trading tool that allows traders to monitor RSI readings from two different timeframes on a single chart. This dual perspective enables traders to identify potential trend confirmations and divergences more effectively. For instance, a trader might use a 1-hour RSI alongside a daily RSI to ensure that short-term trades align with the bro
FREE
Universal Box
Sergey Ermolov
5 (1)
Version MT5   |  FAQ  |   EA Universal Breakout   Universal Box traza intervalos de precios en el gráfico que pueden utilizarse posteriormente para operar en la ruptura de un intervalo de precios. Hay muchas estrategias que pueden aplicarse a este indicador. El indicador está configurado por defecto para marcar en el gráfico los intervalos de la sesión de negociación Asiática, Europea y Americana . Los intervalos se trazan como rectángulos, cuyos límites son las horas de inicio y fin de la sesi
FREE
MTF Stochastic and RSI
Georgiy Gazaryan
5 (2)
A simple but effective helper that will allow you to track both global and local market trends. The indicator combines the work of two oscillators: Stochastic and RSI. Both indicators can be set to any timeframe. Advantages of Use Multitimeframe - you can adjust both indicators to the desired timeframes. To obtain the entry points, you can use the Elder's triple screen system. Highly customizable - you can configure not only the parameters of the indicators, but also their appearance (color an
FREE
Contact me for any queries or custom orders, if you want to use this in an EA. Key Features: Pattern Recognition : Identifies Fair Value Gaps (FVGs) Spots Break of Structure (BOS) points Detects Change of Character (CHoCH) patterns Versatile Application : Optimized for candlestick charts Compatible with any chart type and financial instrument Real-Time and Historical Analysis : Works seamlessly with both real-time and historical data Allows for backtesting strategies and live market analysis V
FREE
MegaTrends
Sivakumar Subbaiya
1 (1)
Megatrends  Indicator   Time Frame: Suitable for any time frame.  Purpose: Trend Prediction. Blue and red color indicate the buy and sell call respectively. Buy: When the blue line is originating it is opened buy call. Sell: When the Red line is origination it is opened sell call Happy trade!! this indicator is suitable for all time frame, but our recommended time frame to use 1hour and 4 hours, suitable for any chart.
FREE
Los compradores de este producto también adquieren
Gann Made Easy
Oleg Rodin
4.85 (82)
Gann Made Easy es un sistema de comercio de Forex profesional y fácil de usar que se basa en los mejores principios de comercio utilizando la teoría del Sr. W. D. Gann. El indicador proporciona señales precisas de COMPRA y VENTA, incluidos los niveles de Stop Loss y Take Profit. Puede comerciar incluso sobre la marcha utilizando notificaciones PUSH. ¡Por favor, póngase en contacto conmigo después de la compra! ¡Compartiré mis consejos comerciales con usted y excelentes indicadores de bonificació
- Real price is 80$ - 40% Discount ( It is 49$ now ) Contact me for instruction, add group and any questions! Related Product:  Bitcoin Expert , Gold Expert Introduction The breakout and retest strategy is traded support and resistance levels. it involves price breaking through a previous level.  The break and retest strategy is designed to help traders do two main things, the first is to avoid false breakouts. Many false breakouts start with a candlestick that breaks out of a level but ends wi
Atomic Analyst
Issam Kassas
5 (2)
En primer lugar, vale la pena enfatizar que este Indicador de Trading no repinta, no redibuja y no se retrasa, lo que lo hace ideal tanto para el trading manual como para el automatizado. Manual del usuario: configuraciones, entradas y estrategia. El Analista Atómico es un Indicador de Acción del Precio PA que utiliza la fuerza y el impulso del precio para encontrar una mejor ventaja en el mercado. Equipado con filtros avanzados que ayudan a eliminar ruidos y señales falsas, y aumentan el poten
Scalper Inside PRO
Alexey Minkov
4.73 (56)
An exclusive indicator that utilizes an innovative algorithm to swiftly and accurately determine the market trend. The indicator automatically calculates opening, closing, and profit levels, providing detailed trading statistics. With these features, you can choose the most appropriate trading instrument for the current market conditions. Additionally, you can easily integrate your own arrow indicators into Scalper Inside Pro to quickly evaluate their statistics and profitability. Scalper Inside
Gold Stuff
Vasiliy Strukov
4.89 (239)
Gold Stuff: un indicador de tendencia diseñado específicamente para el oro, también se puede usar en cualquier instrumento financiero. El indicador no se vuelve a dibujar ni se retrasa. El marco de tiempo recomendado es H1. Este indicador está escrito por EA Gold Stuff Advisor, puede encontrarlo en mi perfil.  Puede obtener una copia gratuita de nuestro indicador Strong Support y Trend Scanner, por favor envíe un mensaje privado. ¡a mí! IMPORTANTE! Póngase en contacto conmigo inmediatamente d
¡Actualmente 20% OFF ! ¡La mejor solución para cualquier novato o trader experto! Este software funciona con 28 pares de divisas. Se basa en 2 de nuestros principales indicadores (Advanced Currency Strength 28 y Advanced Currency Impulse). Proporciona una gran visión general de todo el mercado de divisas. Muestra los valores de Advanced Currency Strength, la velocidad de movimiento de las divisas y las señales para 28 pares de divisas en todos los (9) marcos temporales. Imagine cómo mejorar
Enigmera
Ivan Stefanov
5 (3)
ENIGMERA: El núcleo del mercado https://www.enigmera.com Introducción Este indicador y sistema de negociación es un enfoque extraordinario de los mercados financieros. ENIGMERA utiliza los ciclos fractales para calcular con precisión los niveles de soporte y resistencia. Muestra la auténtica fase de acumulación y proporciona dirección y objetivos.  Un sistema que funciona tanto si estamos en una tendencia como en una corrección.  ¿Cómo funciona? ENIGMERA consta de tres líneas: la línea de s
TPSproTREND PrO
Roman Podpora
4.79 (19)
TPSpro TREND PRO   es un indicador de tendencia que analiza automáticamente el mercado y proporciona información sobre la tendencia y cada uno de sus cambios, además de dar señales para ingresar operaciones sin volver a dibujar. El indicador utiliza cada vela, analizándolas por separado. refiriéndose a diferentes impulsos: impulso hacia arriba o hacia abajo. ¡Puntos de entrada exactos a transacciones de divisas, criptomonedas, metales, acciones e índices! Versión MT5                   DESCRIPCI
Dynamic Forex28 Navigator: la herramienta de trading de Forex de última generación. ACTUALMENTE CON UN 49 % DE DESCUENTO. Dynamic Forex28 Navigator es la evolución de nuestros indicadores populares de larga data, que combina el poder de tres en uno: Indicador avanzado Currency Strength28 (695 reseñas) + Indicador avanzado Currency IMPULSE con ALERT (520 reseñas) + Señales combinadas CS28 (bonificación). Detalles sobre el indicador https://www.mql5.com/en/blogs/post/758844 ¿Qué ofrece el i
Trend Punch
Mohamed Hassan
4.95 (19)
This indicator is unstoppable when combined with our other indicator called  Support & Resistance . After purchase, send us a message and you will get it   for  FREE as a BONUS! Introducing Trend Punch , the revolutionary forex trend indicator that will transform the way you trade! Trend Punch is uniquely designed to provide precise buy and sell arrows during strong market trends, making your trading decisions clearer and more confident. Whether you're trading major currency pairs or exotic sym
Trend Screener
STE S.S.COMPANY
4.8 (87)
Indicador de tendencia, solución única e innovadora para el comercio y filtrado de tendencias con todas las funciones de tendencias importantes integradas en una sola herramienta. Es un indicador 100% sin repintar de marcos temporales y monedas múltiples que se puede usar en todos los símbolos/instrumentos: divisas, materias primas, criptomonedas, índices y acciones. OFERTA POR TIEMPO LIMITADO: El indicador de detección de soporte y resistencia está disponible por solo 50$ y de por vida. (Precio
FX Volume
Daniel Stein
4.58 (33)
Obtenga su actualización diaria del mercado con detalles y capturas de pantalla a través de nuestro Morning Briefing aquí en mql5 y en Telegram ! FX Volume es el PRIMER y ÚNICO indicador de volumen que proporciona una visión REAL del sentimiento del mercado desde el punto de vista de un bróker. Proporciona una visión impresionante de cómo los participantes institucionales del mercado, como los brokers, están posicionados en el mercado Forex, mucho más rápido que los informes COT. Ver esta info
TPSpro RFI Levels
Roman Podpora
4.82 (22)
INSTRUCCIONES      RUSO  -  ING     Se recomienda utilizar con un indicador.   -    TPSpro   TENDENCIA PRO -   Versión MT5 Un elemento clave en el trading son las zonas o niveles desde los que se toman las decisiones de compra o venta de un instrumento de trading. A pesar de los intentos de los principales actores de ocultar su presencia en el mercado, inevitablemente dejan rastros. Nuestra tarea era aprender a identificar estos rastros e interpretarlos correctamente. Funciones principales: ¡Mo
FX Power MT4 NG
Daniel Stein
5 (13)
Obtenga su actualización diaria del mercado con detalles y capturas de pantalla a través de nuestro Morning Briefing aquí en mql5 y en Telegram ! FX Power MT4 NG es la nueva generación de nuestro popular medidor de fuerza de divisas, FX Power. ¿Y qué ofrece este medidor de fuerza de nueva generación? Todo lo que le encantaba del FX Power original PLUS Análisis de fuerza de ORO/XAU Resultados de cálculo aún más precisos Períodos de análisis configurables individualmente Límite de cálculo persona
Ante todo, vale la pena enfatizar que esta Herramienta de Trading es un Indicador No Repintado, No Redibujado y No Retrasado, lo que la hace ideal para el trading profesional. Curso en línea, manual del usuario y demostración. El Indicador de Conceptos de Acción del Precio Inteligente es una herramienta muy potente tanto para traders nuevos como experimentados. Combina más de 20 indicadores útiles en uno solo, combinando ideas avanzadas de trading como el Análisis del Trader del Círculo Interio
Ultimate Gold Advisor para MetaTrader 4 El Ultimate Gold Advisor es una herramienta tecnológica avanzada diseñada para optimizar la experiencia de trading en MetaTrader 4. Creada para satisfacer las necesidades de los traders más experimentados, este indicador combina precisión, análisis sofisticado y funcionalidad versátil, ofreciendo soporte para tomar decisiones de trading informadas. Ideal para el trading de oro, pero también aplicable a una amplia gama de activos, el Ultimate Gold Advisor p
Stratos Pali
Michela Russo
5 (1)
Stratos Pali Indicator   is a revolutionary tool designed to enhance your trading strategy by accurately identifying market trends. This sophisticated indicator uses a unique algorithm to generate a complete histogram, which records when the trend is Long or Short. When a trend reversal occurs, an arrow appears, indicating the new direction of the trend. Important Information Revealed Leave a review and contact me via mql5 message to receive My Top 5 set files for Stratos Pali at no cost! D
Legacy of Gann
Pavel Zamoshnikov
4.83 (12)
The indicator very accurately determines the levels of the possible end of the trend and profit fixing. The method of determining levels is based on the ideas of W.D.Gann, using an algorithm developed by his follower Kirill Borovsky. Extremely high reliability of reaching levels (according to K. Borovsky  - 80-90%) Indispensable for any trading strategy – every trader needs to determine the exit point from the market! Precisely determines targets on any timeframes and any instruments (forex, met
Gold Channel is a volatility-based indicator, developed with a specific timing algorithm for the XAUUSD pair, which consists of finding possible corrections in the market. This indicator shows two outer lines, an inner line (retracement line) and an arrow sign, where the theory of the channel is to help identify overbought and oversold conditions in the market. The market price will generally fall between the boundaries of the channel. If prices touch or move outside the channel it is a tra
Currency Strength Wizard es un indicador muy poderoso que le proporciona una solución todo en uno para operar con éxito. El indicador calcula el poder de este o aquel par de divisas utilizando los datos de todas las monedas en múltiples marcos de tiempo. Estos datos se representan en forma de índice de moneda fácil de usar y líneas eléctricas de moneda que puede usar para ver el poder de esta o aquella moneda. Todo lo que necesita es adjuntar el indicador al gráfico que desea operar y el indicad
GOLD Impulse with Alert
Bernhard Schweigert
4.56 (9)
Este indicador es una super combinación de nuestros 2 productos Advanced Currency IMPULSE with ALERT  +   Currency Strength Exotics . ¡Funciona para todos los marcos de tiempo y muestra gráficamente el impulso de fuerza o debilidad para las 8 divisas principales más un Símbolo! Este Indicador está especializado en mostrar la aceleración de la fuerza de la divisa para cualquier símbolo como Oro, Pares Exóticos, Materias Primas, Índices o Futuros. Es el primero de su clase, cualquier símbol
Scalper Vault
Oleg Rodin
5 (27)
Scalper Vault es un sistema profesional de reventa que le brinda todo lo que necesita para una reventa exitosa. Este indicador es un sistema comercial completo que puede ser utilizado por operadores de divisas y opciones binarias. El marco de tiempo recomendado es M5. El sistema le proporciona señales de flecha precisas en la dirección de la tendencia. También le proporciona señales superiores e inferiores y niveles de mercado de Gann. Los indicadores proporcionan todo tipo de alertas, incluidas
Market Structure
Reza Aghajanpour
4.85 (26)
** All Symbols x All Timeframes scan just by pressing scanner button ** *** Contact me  to send you instruction and add you in "Market Structure group" for sharing or seeing experiences with other users. Introduction: Market structure is important for both new and professional traders since it can influence the liquidity and price action of a market (Breakout and Retest). It’s also one of the most commonly used techniques to understand trends, identify potential reversal points, and get a feel f
Matrix Arrow Indicator MT4
Juvenille Emperor Limited
5 (3)
Matrix Arrow Indicator MT4 es una tendencia única 10 en 1 que sigue un indicador 100% sin repintado de marcos temporales múltiples que se puede usar en todos los símbolos/instrumentos: divisas, materias primas, criptomonedas, índices, acciones.  Matrix Arrow Indicator MT4 determinará la tendencia actual en sus primeras etapas, recopilando información y datos de hasta 10 indicadores estándar, que son: Índice de movimiento direccional promedio (ADX) Índice de canales de productos básicos (CCI) Ve
IX Power MT4
Daniel Stein
5 (5)
IX Power lleva por fin la insuperable precisión de FX Power a los símbolos que no son de Forex. Determina con exactitud la intensidad de las tendencias a corto, medio y largo plazo de tus índices, acciones, materias primas, ETF e incluso criptodivisas favoritas. Puede analizar todo lo que su terminal le ofrece. Pruébalo y experimenta cómo tu timing mejora significativamente a la hora de operar. Características principales de IX Power Resultados de cálculo 100% precisos y sin repintado -
ACTUALMENTE 31% DE DESCUENTO Este indicador es una herramienta de transacción única, de alta calidad y asequible porque hemos incorporado una serie de características propias y una fórmula secreta. Con solo un gráfico, da Alertas para los 28 pares de divisas. ¡Imagina cómo mejorarás porque puedes identificar el punto de activación exacto de una nueva tendencia u oportunidad de crecimiento! Basado en nuevos algoritmos subyacentes , hace que sea aún más fácil identificar y confirmar operaciones po
Deja un comentario después de la compra para recibir 4 indicadores de alta calidad como bono. El indicador Chart Patterns All-in-One ayuda a los traders a visualizar varios patrones de gráficos comúnmente utilizados en el análisis técnico. Este indicador apoya la identificación de posibles comportamientos del mercado, pero no garantiza rentabilidad. Se recomienda probar el indicador en modo demo antes de comprar. Oferta actual : Descuento del 50% en el indicador "Chart Patterns All in One". Patr
Conviértase en un Breaker Trader y obtenga beneficios de los cambios en la estructura del mercado a medida que se invierte el precio. El indicador de ruptura de bloque de órdenes identifica cuándo una tendencia o movimiento de precio se acerca al agotamiento y está listo para revertirse. Le alerta sobre cambios en la estructura del mercado que generalmente ocurren cuando una reversión o un retroceso importante están a punto de suceder. El indicador utiliza un cálculo patentado que identific
Blahtech Supply Demand
Blahtech Limited
4.61 (33)
Was: $299  Now: $99   Supply Demand uses previous price action to identify potential imbalances between buyers and sellers. The key is to identify the better odds zones, not just the untouched ones. Blahtech Supply Demand indicator delivers functionality previously unavailable on any trading platform. This 4-in-1 indicator not only highlights the higher probability zones using a multi-criteria strength engine, but also combines it with multi-timeframe trend analysis, previously confirmed swings
Otros productos de este autor
Индикатор выводит первые производные двух MACD. По умолчанию, желтая MACD является более быстрой, чем синяя MACD. В настройках можно задать подходящие вам параметры для каждой из MACD. Одновременное изменение знака производных может являться дополнительным сигналом разворота. Входные параметры Yellow MACD fast EMA period Yellow MACD slow EMA period Blue MACD fast EMA period Blue MACD slow EMA period
FREE
Affine Chart
Oleg Pechenezhskiy
The indicator plots an affine chart for the current instrument by subtracting the trend component from the price. When launched, creates a trend line in the main window. Position this line in the desired direction. The indicator plots an affine chart according to the specified trend. Input parameters Maximum number of pictured bars - the maximum number of displayed bars. Trend line name - name of the trend line. Trend line color - color of the trend line. Black candle color - color of a bullis
FREE
This utility allows you to check and improve your binary options trading skills. This is an indicator, not an Expert Advisor. Therefore, you do not need to remove your active EA from the chart. Inputs Expiry, min - option expiration time; InfoPanel background color - info panel background color; InfoPanel text color - info panel text color; InfoPanel text fontsize - info panel font size.
FREE
Pairs Trade
Oleg Pechenezhskiy
The Pairs Trade indicator is a utility for semi-automatic pair trading. It allows combining the charts of two arbitrary instruments, even if the schedules of their trading sessions are different. It displays a spread chart in the form of a histogram with an overlaying moving average. It calculates the swap that will be charged for the synthetic position (in the deposit currency). It is possible to set a level for automatic opening of a synthetic position on the spread chart (analogous to the 'se
This indicator calculates the aggregate position of all long positions and the aggregate position of all short positions on the current symbol. The aggregate position is displayed on the chart as a horizontal line. When the line is hovered, a tooltip with the volume of the aggregate position appears. If the total number of positions in the terminal changes, the aggregate position is recalculated. Input parameters BuyLine color - line color of the aggregate long position; BuyLine width - line w
Trading Lines
Oleg Pechenezhskiy
This utility is an Expert Advisor for semi-automatic trading within a price channel. It enters the market when the price crosses the channel boundary. Trend lines with a special type of description should mark the boundaries of the price channel. Trader is responsible for creating and aligning such trade lines on the required chart. The lines should be placed according to the same rules the "buy limit" and "sell limit" pending orders are placed. A trend line with a description of type "buy x" (w
Colored Channels
Oleg Pechenezhskiy
This program is for traders who plot price channels on charts. You just need to specify the width of the channel in the description of the trend line. Enter the "Description" field in the trend line properties and type  canal: xxxxx  without a space, where xxxxx is the width of the channel in pips. Channel color is set automatically depending on the channel width. The middle line of the channel is also automatically drawn. If the channel width is set to a positive number, the channel is drawn ab
Gann Lines Driver
Oleg Pechenezhskiy
С этим драйвером вы можете превратить трендовую линию в линию Ганна, поместив значение угла в виде NxM в ее описании, например 4x1, где N - это количество поинтов, а M - количество таймфреймов на текущем графике. Драйвер автоматически отображает значение угла в виде метки у правого конца линии. По умолчанию, размер поинта равен размеру пипса, но в настройках вы можете сами указать подходящий вам размер поинта. Вы можете комбинировать этот индикатор с индикатором  Colored Channels , разделяя проб
Profit Meter
Oleg Pechenezhskiy
5 (1)
Эта утилита поможет вам рассчитать прибыль в валюте депозита, если цена пройдет от своего текущего значения к значению, указанному горизонтальной линией ProfitMeter. При запуске индикатора эта линия автоматически создается на уровне текущего значения цены. Линию следует выбрать и переместить на нужный вам уровень. Расчетное значение прибыли при входе в рынок минимально возможным лотом отображается в правом нижнем углу окна графика. Входные параметры Style of ProfitMeter Color of ProfitMeter Widt
Quantized Trend
Oleg Pechenezhskiy
This utility automatically draws the trend channel on the price chart. For the time interval from the specified date to the current bar, the drawn channel is almost optimal. Placing the beginning of the channel at a more distant historical price extremum, you get a visualization of a longer-term trend. Channel slope is not a continuous value, but takes one of discrete values (in AxB format, where A is the number of price points (points), and B is the number of timeframes). This program works ONL
Filtro:
zainul134
44
zainul134 2022.12.13 07:27 
 

Thanks for the indicator Oleg. Indicator good at indicating volatile markets.

Erdinç Yıldız
539
Erdinç Yıldız 2017.06.26 23:33 
 

El usuario no ha dejado ningún comentario para su valoración

Respuesta al comentario