• Información general
  • Comentarios (12)
  • Discusión (31)
  • Novedades

Support and Resistance

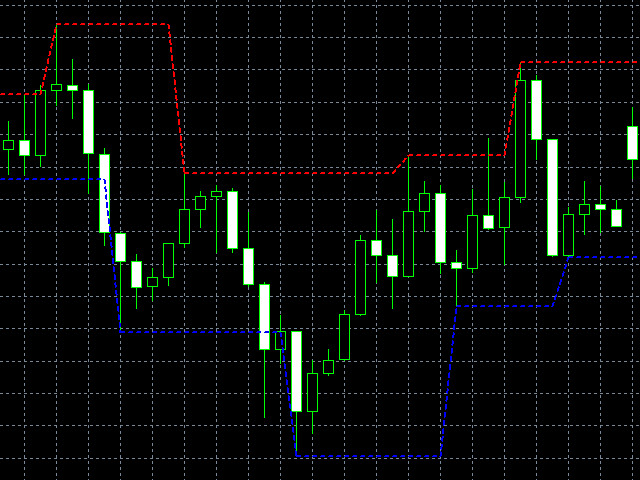
Support & Resistance indicator is a modification of the standard Bill Williams' Fractals indicator.

The indicator works on any timeframes. It displays support and resistance levels on the chart and allows setting stop loss and take profit levels (you can check the exact value by putting the mouse cursor over the level).

  • Blue dashed lines are support level.
  • Red dashed lines are resistance levels.

If you want, you can change the style and color of these lines.

If the price approaches a support level, the activity of seller decreases and the activity of buyers increases. If the price approaches a resistance level, the activity of buyers decreases and the activity of sellers increases.

Note, that when the price breaks through a support level, it may become a resistance level; and when the price breaks through a resistance level, it may become a support level.

Productos recomendados
Owl Smart Levels MT5
Sergey Ermolov
4.07 (28)
Versión MT4  |  FAQ El Indicador Owl Smart Levels es un sistema comercial completo dentro de un indicador que incluye herramientas de análisis de mercado tan populares como los fractales avanzados de Bill Williams , Valable ZigZag que construye la estructura de onda correcta del mercado y los niveles de Fibonacci que marcan los niveles exactos de entrada. en el mercado y lugares para tomar ganancias. Descripción detallada de la estrategia Instrucciones para trabajar con el indicador Asesor de c
Este es un indicador MTF de niveles de soporte y resistencia basado en los   extremos del indicador Advanced ZigZag Dynamic   y / o   Extended Fractals   con etiquetas de precio (se puede deshabilitar). Se pueden seleccionar TF más altos para el modo MTF. De forma predeterminada, los niveles se generan en función de los puntos indicadores de ZigZag. Los puntos indicadores de fractales también se pueden usar junto con ZigZag o en su lugar. Para simplificar el uso y ahorrar tiempo de CPU, el cálcu
This indicator studies price action as an aggregation of price and time vectors, and uses the average vector to determine the direction and strength of the market. This indicator highlights the short-term directionality and strength of the market, and can be used to capitalize from short-term price movements by trading breakouts or binary options   [ Installation Guide | Update Guide | Troubleshooting | FAQ | All Products ] Find market direction easily Confirm with breakouts or other indicators
El Capturador de Tendencias: La Estrategia del Capturador de Tendencias con Indicador de Alerta es una herramienta versátil de análisis técnico que ayuda a los traders a identificar las tendencias del mercado y los posibles puntos de entrada y salida. Presenta una Estrategia dinámica del Capturador de Tendencias, adaptándose a las condiciones del mercado para una clara representación visual de la dirección de la tendencia. Los traders pueden personalizar los parámetros para que se ajusten a su
FREE
The Penta-O is a 6-point retracement harmonacci pattern which usually precedes big market movements. Penta-O patterns can expand and repaint quite a bit. To make things easier this indicator implements a twist: it waits for a donchian breakout in the right direction before signaling the trade. The end result is an otherwise repainting indicator with a very reliable trading signal. The donchian breakout period is entered as an input. [ Installation Guide | Update Guide | Troubleshooting | FAQ | A
Important Lines
Terence Gronowski
4.86 (21)
Indicador de líneas importantes (M1 - M15) Este indicador muestra Líneas pivote, Día anterior alta y baja, Cierre día anterior y el mínimo y máximo de la hora anterior. Simplemente tiene que arrastrar ese único indicador al diagrama para tener todas esas líneas importantes. Puede evitar cargar muchos indicadores individuales. ¿Por qué ciertas líneas son tan importantes cuando se comercia? El día a día, alto y bajo: estos son observados por los comerciantes que comercian en un gráfico diario.
FREE
Follow The Line MT5
Oliver Gideon Amofa Appiah
4.52 (29)
This indicator obeys the popular maxim that: "THE TREND IS YOUR FRIEND" It paints a GREEN line for BUY and also paints a RED line for SELL. (you can change the colors). It gives alarms and alerts of all kinds. IT DOES NOT REPAINT and can be used for all currency pairs and timeframes. Yes, as easy and simple as that. Even a newbie can use it to make great and reliable trades. NB: For best results, get my other premium indicators for more powerful and reliable signals. Get them here: https://www.m
FREE
This indicator obeys the popular maxim that: "THE TREND IS YOUR FRIEND" It paints a Blue line for BUY and also paints a RED line for SELL. (you can change the colors). It gives alarms and alerts of all kinds. IT DOES NOT REPAINT COLOR and can be used for all currency pairs and timeframes. Yes, as easy and simple as that. Even a newbie can use it to make great and reliable trades. MetaTrader 4 Version    
Double HMA MTF for MT5
Pavel Zamoshnikov
4 (4)
This is an advanced multi-timeframe version of the popular Hull Moving Average (HMA) Features Two lines of the Hull indicator of different timeframes on the same chart. The HMA line of the higher timeframe defines the trend, and the HMA line of the current timeframe defines the short-term price movements. A graphical panel with HMA indicator data from all timeframes at the same time . If the HMA switched its direction on any timeframe, the panel displays a question or exclamation mark with a tex
LT Rainbow Trend
Thiago Duarte
5 (1)
Do you, like me, like to trade with the trend? Then this indicator will help you! Rainbow Trend is a trend indicator, which uses several Moving Averages on the chart. It measures different trend strenght zones for different periods: very long term, long term, mid term, short term and very short term. Each zone has its color, and it is possible to have sound alert when the prices leaves a zone and enters another. Its configuration is very simple. If you find any bug or have any suggestions, conta
Best SAR MT5
Ashkan Hazegh Nikrou
4.33 (3)
Descripción :  nos complace presentar nuestro nuevo indicador gratuito basado en uno de los indicadores profesionales y populares en el mercado de divisas (PSAR). Este indicador es una nueva modificación del indicador Parabolic SAR original. En el indicador pro SAR puede ver el cruce entre puntos y el gráfico de precios. el cruce no es una señal, pero habla sobre el final del potencial de movimiento, puede comenzar a comprar con un nuevo punto azul y colocar un límite de pérdidas un atr antes
FREE
Ultimate Supply Demand MT5
Ramon Sobrevals Arce
5 (4)
After working during many months, with the help of Neural Networks, we have perfected the ultimate tool you are going to need for identifying key price levels (Supports and Resistances) and Supply and Demand zones. Perfectly suitable to trigger your trades, set up your future actions, decide your Take Profit and Stop Loss levels, and confirm the market direction. Price will always move between those levels, bouncing or breaking; from one zone to another, all the remaining movements are just mark
El indicador   "Haven Key Levels PDH PDL"   ayuda a los traders a visualizar los niveles clave en el gráfico. Marca automáticamente los siguientes niveles: DO (Daily Open)   — nivel de apertura del día. NYM (New York Midnight)   — nivel de medianoche en Nueva York. PDH (Previous Day High)   — máximo del día anterior. PDL (Previous Day Low)   — mínimo del día anterior. WO (Weekly Open)   — nivel de apertura de la semana. MO (Monthly Open)   — nivel de apertura del mes. PWH (Previous Week High)  
FREE
Pivot Point Fibo RSJ es un indicador que rastrea las líneas de soporte y resistencia del día utilizando las tasas de Fibonacci. Este espectacular indicador crea hasta 7 niveles de soporte y resistencia a través del Pivot Point utilizando las tasas de Fibonacci. Es fantástico cómo los precios respetan cada nivel de este soporte y resistencia, donde es posible percibir posibles puntos de entrada / salida de una operación. Características Hasta 7 niveles de soporte y 7 niveles de resistencia Es
FREE
Trend Lines Supports and Resistances is an indicator that analyses the market structure, identifies Pivot Points, displays active Support/Resistance zones and trend levels. Main Features: Defining and displaying Pivot Points. Analyse Pivot Points to build and display trend lines. Setting up visual display of trend lines. Setting up trend lines broken notifications. Analyse Pivot Points to define and display support and resistance levels. Setting up visual display of support and resistance leve
Your Trend Friend
Luigi Nunes Labigalini
5 (1)
The trend is your friend! Look at the color of the indicator and trade on that direction. It does not  repaint. After each candle is closed, that's the color of the trend. You can focus on shorter faster trends or major trends, just test what's most suitable for the symbol and timeframe you trade. Simply change the "Length" parameter and the indicator will automatically adapt. You can also change the color, thickness and style of the lines. Download and give it a try! There are big movements w
Bounce Zone MT5
Nguyen Thanh Cong
4.43 (7)
Introduction The Bounce Zone indicator is a cutting-edge non-repainting technical tool built to identify key areas on the price chart where market sentiment is likely to cause a significant price reversal. Using advanced algorithms and historical price data analysis, this indicator pinpoints potential bounce zones. Combined with other entry signal, this indicator can help forex traders place the best trades possible Signal A possible buy signal is generated when price is in the green zone an
FREE
Trading Utility for Forex Currency Pairs Only not for Gold  Functions Auto Lot Calculation based on Risk Auto stoploss  Auto TakeProfit Breakeven Auto Close Half % Close in percentage with respect to the PIPs Pending Orders BuyLimit Sell Limit with distances BuyStop Sell Stop    with distances Trading Informations Risk in percentage For Multiple trades Combine Takeprofit and Combine Stoplosses
KT Horizontal Lines MT5
KEENBASE SOFTWARE SOLUTIONS
In MetaTrader, plotting multiple   horizontal lines   and then tracking their respective price levels can be a hassle. This indicator automatically plots multiple horizontal lines at equal intervals for setting price alerts, plotting support and resistance levels, and other manual purposes. This indicator is suitable for Forex traders who are new and looking for chances to make quick profits from buying and selling. Horizontal lines can help traders find possible areas to start trading when the
Noize Absorption Index - is the manual trading system that measures the difference of pressure between bears forces and bulls forces. Green line - is a noize free index that showing curent situation. Zero value of index shows totally choppy/flat market.Values above zero level shows how powerfull bullish wave is and values below zero measures bearish forces.Up arrow appears on bearish market when it's ready to reverse, dn arrow appears on weak bullish market, as a result of reverse expectation.
¡El nivel Premium es un indicador único con más del 80% de precisión de predicciones correctas! ¡Este indicador ha sido probado por los mejores especialistas en comercio durante más de dos meses! ¡El indicador del autor no lo encontrarás en ningún otro lugar! ¡A partir de las capturas de pantalla, puede ver por sí mismo la precisión de esta herramienta! 1 es ideal para operar con opciones binarias con un tiempo de vencimiento de 1 vela. 2 funciona en todos los pares de divisas, acciones, m
Mine Farm is one of the most classic and time-tested scalping strategies based on the breakdown of strong price levels. Mine Farm is the author's modification of the system for determining entry and exit points into the market... Mine Farm - is the combination of great potential with reliability and safety. Why Mine Farm?! - each order has a short dynamic Stop Loss - the advisor does not use any risky methods (averaging, martingale, grid, locking, etc.) - the advisor tries to get the most
Ice up
Ignacio Agustin Mene Franco
Ice Up .  es un indicador donde cumple la funcion profesional de un zigzag junto con soporte y resistencia  perfecto para agarrar tendencias largas y cortas .  en la nueva version de Ice mejora al %100 los pivots .  sirve para toda las temporalidades  sirve para forex y indices sinteticos , y si el broker tiene tambien crypto .  funciona para todo los pares de fores y indices sinteticos . 
WanaScalper
Isaac Wanasolo
1 (1)
A scalping indicator based on mathematical patterns, which on average gives signals with relatively small SL, and also occasionally helps to catch big moves in the markets (more information in the video) This indicator has three main types of notifications: The first type warns of a possible/upcoming signal on the next bar The second type indicates the presence of a ready signal to enter the market/open a position The third type is for SL and TP levels - you will be notified every time price re
El indicador DYJ BoS identifica y marca automáticamente los elementos esenciales de los cambios en la estructura del mercado, incluidos: Ruptura de estructura (BoS): se detecta cuando el precio realiza un movimiento significativo, rompiendo un punto de estructura anterior. Marca posibles líneas de tendencia alcista y líneas de tendencia bajista (UP & DN, es decir, nuevos máximos y nuevos mínimos continuos), y una vez que el precio rompe estas líneas, marca flechas rojas (BEAR) y verdes (BULL)
Flow Bookmap
Thalles Nascimento De Carvalho
Flow Bookmap: Visualiza el Flujo de Mercado y Protege tus Operaciones ️ ¿QUIERES DOMINAR EL MERCADO CON INFORMACIÓN PRECISA SOBRE COMPRADORES Y VENDEDORES? Flow Bookmap es la herramienta definitiva para traders que buscan entender el comportamiento del mercado en profundidad. Transforma los datos del flujo de órdenes en una interfaz intuitiva en el gráfico de MT5, destacando áreas de interés crítico para tomar decisiones rápidas y seguras. ¿Cómo Funciona? Flow Bookmap interpreta la int
MSnR Lines
Pierre Paul Amoussou
MSnR Lines es un indicador personalizado diseñado para mostrar niveles de soporte y resistencia en un gráfico. Estos niveles se basan en la teoría de soporte y resistencia de Malasia, que define los niveles no como áreas, sino como niveles de precio específicos derivados de los picos y valles del gráfico de líneas. Características: Tres tipos de niveles: A-Level, V-Level y Nivel de brecha. Indicación de frescura para los niveles: los niveles frescos son más significativos que los niveles no fres
Green Power
Ignacio Agustin Mene Franco
Pack Black Card  indicador 5/3 Green power cuenta con la estrategia de ropturas high y low  dando la señal con el punto rojo o verde  el punto rojo para short y el punto verde para long ,  perfecto para los mercados de forex y los mercados de indices sinteticos ,  funciona para todas las temporalidades  sirve para hacer scalping y intradiario !  Ideal para los mercados Crash y boom !!
SolarTrade Suite Financial Indicator: Jupiter Market Indicator - ¡Su guía confiable en el mundo de los mercados financieros! Este es un indicador de tendencia que utiliza algoritmos especiales innovadores y avanzados para calcular su valor, y también tiene un diseño agradable a la vista. Es muy fácil entender las lecturas de este indicador: color azul - compra, rojo - venta. Vea nuestros otros productos de la serie SolarTrade Suite en la parte inferior de la descripción. ¿Quiere navegar con
The indicator detects and displays М. Gartley's Butterfly pattern. The pattern is plotted by the extreme values of the ZigZag indicator (included in the resources, no need to install). After detecting the pattern, the indicator notifies of that by the pop-up window, a mobile notification and an email. The pattern and wave parameters are displayed on the screenshots. The default parameters are used for demonstration purposes only in order to increase the amount of detected patterns. Parameters z
Los compradores de este producto también adquieren
Trend Screener Pro MT5
STE S.S.COMPANY
4.89 (72)
Desbloquee el poder del comercio de tendencias con el indicador Trend Screener: ¡su solución definitiva para el comercio de tendencias impulsada por lógica difusa y un sistema multidivisa!Mejore su comercio de tendencias con Trend Screener, el revolucionario indicador de tendencias impulsado por lógica difusa. Es un poderoso indicador de seguimiento de tendencias que combina más de 13 herramientas y funciones premium y 3 estrategias comerciales, lo que lo convierte en una opción versátil para co
Golden Trend Indicator MT5
Noha Mohamed Fathy Younes Badr
4.86 (14)
Golden Trend indicator  is The best indicator for predicting trend movement this indicator never lags and never repaints and never back paints    and give  arrow buy and sell    before the candle appear  and it will help you and  will make your trading decisions clearer its work on all currencies and  gold and crypto and all time frame This unique  indicator uses very secret algorithms to catch the  trends, so you can trade using this indicator and see the trend clear on charts  manual guide and
FX Volume MT5
Daniel Stein
4.82 (17)
FX Volume: Experimente el Verdadero Sentimiento del Mercado desde la Perspectiva de un Bróker Resumen Rápido ¿Desea llevar su estrategia de trading a otro nivel? FX Volume ofrece información en tiempo real sobre cómo los traders minoristas y los brókers están posicionados, mucho antes de que aparezcan informes retrasados como el COT. Ya sea que busque beneficios consistentes o simplemente quiera una ventaja más profunda en los mercados, FX Volume le ayuda a identificar desequilibrios important
FX Power MT5 NG
Daniel Stein
5 (10)
FX Power: Analiza la Fuerza de las Divisas para Decisiones de Trading Más Inteligentes Descripción General FX Power es tu herramienta esencial para comprender la fuerza real de las principales divisas y el oro en cualquier condición de mercado. Al identificar divisas fuertes para comprar y débiles para vender, FX Power simplifica las decisiones de trading y descubre oportunidades de alta probabilidad. Ya sea que quieras seguir las tendencias o anticipar reversiones utilizando valores extremos
Quantum TrendPulse
Bogdan Ion Puscasu
5 (13)
Presentamos   Quantum TrendPulse   , la herramienta de trading definitiva que combina el poder de   SuperTrend   ,   RSI   y   Stochastic   en un indicador integral para maximizar su potencial de trading. Diseñado para traders que buscan precisión y eficiencia, este indicador le ayuda a identificar tendencias del mercado, cambios de impulso y puntos de entrada y salida óptimos con confianza. Características principales: Integración con SuperTrend:   siga fácilmente la tendencia predominante del
IX Power MT5
Daniel Stein
4.83 (6)
IX Power: Descubre perspectivas de mercado para índices, materias primas, criptomonedas y forex Descripción general IX Power es una herramienta versátil diseñada para analizar la fortaleza de índices, materias primas, criptomonedas y símbolos de forex. Mientras que FX Power ofrece la máxima precisión para pares de divisas mediante el uso de datos de todos los pares disponibles, IX Power se centra exclusivamente en los datos del mercado del símbolo subyacente. Esto convierte a IX Power en una e
FX Levels MT5
Daniel Stein
5 (2)
FX Levels: Zonas de Soporte y Resistencia con Precisión Excepcional para Todos los Mercados Resumen Rápido ¿Busca una manera confiable de identificar niveles de soporte y resistencia en cualquier mercado — ya sean divisas, índices, acciones o materias primas? FX Levels combina el método tradicional “Lighthouse” con un enfoque dinámico vanguardista, ofreciendo una precisión casi universal. Gracias a nuestra experiencia real con brokers y a las actualizaciones automáticas diarias más las de tiem
TPSpro RFI Levels MT5
Roman Podpora
4.53 (19)
INSTRUCCIONES       RUSO   -   ING        Se   recomienda utilizar con un indicador.       -       TPSpro   TENDENCIA PRO -   Versión MT5 Un elemento clave en el trading son las zonas o niveles desde los que se toman las decisiones de compra o venta de un instrumento de trading. A pesar de los intentos de los principales actores de ocultar su presencia en el mercado, inevitablemente dejan rastros. Nuestra tarea era aprender a identificar estos rastros e interpretarlos correctamente. Funciones p
TPSproTREND PrO MT5
Roman Podpora
4.47 (17)
TPSpro TREND PRO  - is a trend indicator that automatically analyzes the market and provides information about the trend and each of its changes, as well as giving signals for entering trades without redrawing! The indicator uses each candle, analyzing them separately. referring to different impulses - up or down impulse. Exact entry points into transactions for currencies, crypto, metals, stocks, indices!  ИНСТРУКЦИЯ RUS         INSTRUCTIONS  ENG       R ecommended to use with an indicator   -
RelicusRoad Pro MT5
Relicus LLC
4.78 (18)
Ahora $ 147 (aumentando a $ 499 después de algunas actualizaciones) - Cuentas ilimitadas (PC o Mac) Manual de usuario de RelicusRoad + Videos de capacitación + Acceso al grupo privado de Discord + Estado VIP UNA NUEVA MANERA DE VER EL MERCADO RelicusRoad es el indicador comercial más poderoso del mundo para divisas, futuros, criptomonedas, acciones e índices, y brinda a los comerciantes toda la información y las herramientas que necesitan para mantenerse rentables. Brindamos análisis técnico
Support And Resistance Screener está en un indicador de nivel para MetaTrader que proporciona múltiples herramientas dentro de un indicador. Las herramientas disponibles son: 1. Cribador de estructura de mercado. 2. Zona de retroceso alcista. 3. Zona de retroceso bajista. 4. Puntos pivotes diarios 5. Puntos de pivote semanales 6. Puntos Pivotes mensuales 7. Fuerte soporte y resistencia basado en patrón armónico y volumen. 8. Zonas de nivel de banco. OFERTA POR TIEMPO LIMITADO: El indicador de so
Bill Williams Advanced
Siarhei Vashchylka
5 (9)
Bill Williams Advanced is designed for automatic chart analysis using Bill Williams' "Profitunity" system. The indicator analyzes four timeframes at once. Manual (Be sure to read before purchasing) Advantages 1. Automatically analyzes the chart using the "Profitunity" system of Bill Williams. The found signals are placed in a table in the corner of the screen. 2. Equipped with a trend filter based on the Alligator indicator. Most of the system signals are recommended to be used only according t
Este tablero muestra los últimos   patrones armónicos   disponibles para los símbolos seleccionados, por lo que ahorrará tiempo y será más eficiente /   versión MT4 . Indicador gratuito:   Basic Harmonic Pattern Columnas del indicador Symbol:   aparecerán los símbolos seleccionados Trend :   alcista o bajista Pattern :   tipo de patrón (gartley, mariposa, murciélago, cangrejo, tiburón, cifrado o ABCD) Entry :   precio de entrada SL:   precio de stop loss TP1:   1er precio de toma de beneficios
Ante todo, vale la pena enfatizar que esta Herramienta de Trading es un Indicador No Repintado, No Redibujado y No Retrasado, lo que la hace ideal para el trading profesional. Curso en línea, manual del usuario y demostración. El Indicador de Conceptos de Acción del Precio Inteligente es una herramienta muy potente tanto para traders nuevos como experimentados. Combina más de 20 indicadores útiles en uno solo, combinando ideas avanzadas de trading como el Análisis del Trader del Círculo Interi
Este es un genial indicador para MT5 que ofrece señales precisas para entrar en una transacción sin redibujar. Se puede aplicar a cualquier activo financiero: fórex, criptomonedas, metales, acciones, índices. Nos dará valoraciones bastante precisas y nos dirá cuándo es mejor abrir y cerra una transacción. Eche un vistazo  al vídeo  (6:22), ¡contiene un ejemplo de procesamiento de una sola señal que ha amortizado el indicador! La mayoría de los tráders mejoran sus resultados comerciales durante l
FX Dynamic: Rastrea la volatilidad y las tendencias con un análisis ATR personalizable Descripción general FX Dynamic es una herramienta potente que emplea los cálculos de Average True Range (ATR) para brindar a los traders información incomparable sobre la volatilidad diaria e intradía. Al establecer umbrales de volatilidad claros —por ejemplo, 80%, 100% y 130%— puedes identificar rápidamente oportunidades de beneficio o recibir alertas cuando el mercado excede sus rangos habituales. FX Dynam
Gold Stuff mt5
Vasiliy Strukov
4.92 (173)
Gold Stuff mt5: un indicador de tendencia diseñado específicamente para el oro, también se puede usar en cualquier instrumento financiero. El indicador no se vuelve a dibujar ni se retrasa. El marco de tiempo recomendado es H1. IMPORTANTE! Póngase en contacto conmigo inmediatamente después de la compra para obtener instrucciones y bonificación!   Puede obtener una copia gratuita de nuestro indicador Strong Support y Trend Scanner, por favor envíe un mensaje privado. ¡a mí! PARÁMETROS Draw Ar
Introduciendo       Quantum Breakout PRO   , el innovador indicador MQL5 que está transformando la forma en que comercia con Breakout Zones. Desarrollado por un equipo de comerciantes experimentados con experiencia comercial de más de 13 años,       Desglose cuántico PRO       está diseñado para impulsar su viaje comercial a nuevas alturas con su innovadora y dinámica estrategia de zona de ruptura. El indicador de ruptura cuántica le dará flechas de señal en las zonas de ruptura con 5 zonas ob
Matrix Arrow Indicator MT5
Juvenille Emperor Limited
5 (13)
Matrix Arrow Indicator MT5   es una tendencia única 10 en 1 que sigue un indicador   100% sin repintado   de marcos temporales múltiples que se puede usar en todos los símbolos/instrumentos:   divisas ,   materias primas ,   criptomonedas ,   índices ,   acciones .  Matrix Arrow Indicator MT5  determinará la tendencia actual en sus primeras etapas, recopilando información y datos de hasta 10 indicadores estándar, que son: Índice de movimiento direccional promedio (ADX) Índice de canales de prod
Easy Breakout MT5
Mohamed Hassan
5 (3)
After your purchase, feel free to contact me for more details on how to receive a bonus indicator called VFI, which pairs perfectly with Easy Breakout for enhanced confluence!     Easy Breakout MT5   is a powerful price action trading system built on one of the most popular and widely trusted strategies among traders: the   Breakout strategy ! This indicator delivers crystal-clear Buy and Sell signals based on breakouts from key support and resistance zones. Unlike typical breakout indicators
Gartley Hunter Multi
Siarhei Vashchylka
5 (9)
Gartley Hunter Multi - An indicator for searching for harmonic patterns simultaneously on dozens of trading instruments and on all possible timeframes. Manual (Be sure to read before purchasing) | Version for MT4 Advantages 1. Patterns: Gartley, Butterfly, Shark, Crab. Bat, Alternate Bat, Deep Crab, Cypher 2. Simultaneous search for patterns on dozens of trading instruments and on all possible timeframes 3. Search for patterns of all possible sizes. From the smallest to the largest 4. All fou
Royal Scalping Indicator M5
Vahidreza Heidar Gholami
5 (6)
Royal Scalping Indicator is an advanced price adaptive indicator designed to generate high-quality trading signals. Built-in multi-timeframe and multi-currency capabilities make it even more powerful to have configurations based on different symbols and timeframes. This indicator is perfect for scalp trades as well as swing trades. Royal Scalping is not just an indicator, but a trading strategy itself. Features Price Adaptive Trend Detector Algorithm Multi-Timeframe and Multi-Currency Trend Low
Este es posiblemente el indicador de reconocimiento automático de formación de precios más completo que puede encontrar para la plataforma MetaTrader. Detecta 19 patrones diferentes, toma las proyecciones de Fibonacci tan en serio como usted, muestra la zona de reversión potencial (PRZ) y encuentra niveles adecuados de stop-loss y take-profit. [ Guía de instalación | Guía de actualización | Solución de problemas | FAQ | Todos los productos ] Detecta 19 formaciones de precios armónicos diferen
Este panel descubre y muestra las zonas de   Oferta   y   Demanda   en el gráfico, tanto en modo scalping como a largo plazo, dependiendo de su estrategia de trading para los símbolos seleccionados. Además, el modo de escáner del tablero le ayuda a comprobar todos los símbolos deseados de un vistazo y no perder ninguna posición adecuada /   Versión MT4 Indicador gratuito:   Basic Supply Demand Características Le permite ver las oportunidades de negociación en   múltiples pares de divisas ,
QM Pattern Scanner MT5
Reza Aghajanpour
5 (4)
Contact me  to send you instruction and add you in group. QM (Quasimodo) Pattern is based on Read The Market(RTM) concepts. The purpose of this model is to face the big players of the market (financial institutions and banks), As you know in financial markets, big traders try to fool small traders, but RTM prevent traders from getting trapped. This style is formed in terms of price candles and presented according to market supply and demand areas and no price oscillator is used in it. RTM conc
Auto Order Block with break of structure based on ICT and Smart Money Concepts (SMC) Futures Break of Structure ( BoS )             Order block ( OB )            Higher time frame Order block / Point of Interest ( POI )    shown on current chart           Fair value Gap ( FVG ) / Imbalance   -  MTF      ( Multi Time Frame )    HH/LL/HL/LH  -  MTF      ( Multi Time Frame )  Choch  MTF      ( Multi Time Frame )  Volume Imbalance     ,  MTF          vIMB Gap’s Power of 3 Equal High / Low’s  
Volumatic VIDyA MT5
Duc Hoan Nguyen
5 (1)
Special offer : ALL TOOLS , just $35 each! New tools   will be   $30   for the   first week   or the   first 3 purchases !  Trading Tools Channel on MQL5 : Join my MQL5 channel to update the latest news from me Volumatic VIDYA (Variable Index Dynamic Average) es un indicador avanzado diseñado para rastrear tendencias y analizar la presión de compra-venta en cada fase de una tendencia. Utilizando el Promedio Dinámico de Índice Variable (Variable Index Dynamic Average) como técnica principal de s
Dark Absolute Trend   is an Indicator for intraday trading. This Indicator is based on   Trend Following  strategy but use also candlestick patterns and Volatility. We can enter in good price with this Indicator, in order to follow the main trend on the current instrument. It is advised to use low spread ECN brokers. This Indicator does   Not repaint   and   N ot lag . Recommended timeframes are M5, M15 and H1. Recommended working pairs: All. I nstallation and  Update Guide   -  Troubleshooting
CONTACT US  after purchase to get the Indicator Manual. Try Now—Limited 50% Discount for First 10 Buyers! Download the  Metatrader 4 Version Due to regulatory restrictions, our service is unavailable in certain countries such as India, Pakistan, and Bangladesh. William Delbert Gann (W.D. Gann) was an exceptional market analyst, whose trading technique was based on a complex blend of mathematics, geometry, astrology, and ancient mathematics which proved to be extremely accurate. A Note from t
Suleiman Levels
Suleiman Alhawamdah
5 (2)
Nota importante: La imagen que se muestra en las capturas de pantalla es de mis 2 indicadores, el indicador "Niveles de Suleimán" y el indicador "RSI Trend V". Recomendé usarlo junto con el indicador "RSI Trend V1", especialmente para confirmar y coincidir con la nube de colores y para las señales de flechas, además de la importancia del indicador Fibonacci y sus niveles destacados adjuntos: https://www.mql5.com/en/market/product/132080 El indicador "Niveles de Suleimán" es una herramienta de a
Otros productos de este autor
DeMarker Mod
Pavel Gotkevitch
4 (2)
В стандартном индикаторе DeMarker используется простая скользящая средняя - Simple Moving Average, что несколько ограничивает возможности этого индикатора. В представленном индикаторе DeMarker Mod добавлен выбор из четырех скользящих средних - Simple, Exponential, Smoothed, Linear weighted, что позволяет существенно расширить возможности данного индикатора.   Параметры стандартного индикатора DeMarker: ·         period  - количество баров, используемых для расчета индикатора;   Параметры индикат
FREE
Bulls Power Mod
Pavel Gotkevitch
3 (1)
Only Exponential Moving Average at Close Price is used in standard Bulls Power limiting the possibilities of that indicator to some extent. Bulls Power Mod enables you to select from four Moving Averages and seven applied prices, thus greatly expanding the indicator's functionality.
FREE
Bears Power Mod
Pavel Gotkevitch
3 (1)
Only Exponential Moving Average at Close Price is used in standard Bears Power limiting the possibilities of that indicator to some extent. Bears Power Mod enables you to select from four Moving Averages and seven applied prices, thus greatly expanding the indicator's functionality.
FREE
MAPC
Pavel Gotkevitch
3 (1)
MAPC (Moving Average Percent's Change) shows the Moving Average's percent change from one period to another selected period allowing you to track the smoothed price change rate. MAPC is calculated according to the following equation: MAPC[i] = 100 * (MA[i] - MA[i - n]) / MA[i],  where: MA[i] - current Moving Average value;   MA[i - n] - value of the Moving Average that is n periods away from the current Moving Average value. Input Parameters Period - Moving Average period; Method - smoothing me
FREE
MA Crossing
Pavel Gotkevitch
MA Crossing displays two moving averages on the chart painting their crossing points in different colors - blue (buy) and red (sell). The indicator clearly defines the trend direction and power and simplifies the perception of market signals. The indicator may be useful in the strategies involving two moving averages' crossing method. The indicator's input parameters allow you to select the following settings for each moving average: period (Fast Period, Slow Period); smoothing period (Simple, E
Vates
Pavel Gotkevitch
4.2 (5)
Vates is a Latin word meaning a prophet. Vates is a multicurrency trend Expert Advisor that can run on any type real accounts, on any timeframe, with any initial deposit, with a fixed or varying lot size, with four and five-digit quotes, with brokers offering different order filling types. A distinctive feature of the EA is its stability and reliability. The results of Expert Advisor testing in the Strategy Tester in four modes (two main modes – normal and with a delay, and two additional modes
Grab
Pavel Gotkevitch
The Grab indicator combines the features of both trend indicators and oscillators. This indicator is a convenient tool for detecting short-term market cycles and identifying overbought and oversold levels. A long position can be opened when the indicator starts leaving the oversold area and breaks the zero level from below. A short position can be opened when the indicator starts leaving the overbought area and breaks the zero level from above. An opposite signal of the indicator can be used for
CCI Modified
Pavel Gotkevitch
The standard Commodity Channel Index (CCI) indicator uses a Simple Moving Average, which somewhat limits capabilities of this indicator. The presented CCI Modified indicator features a selection of four moving averages - Simple, Exponential, Smoothed, Linear weighted, which allows to significantly extend the capabilities of this indicator. Parameter of the standard Commodity Channel Index (CCI) indicator period - the number of bars used for the indicator calculations; apply to - selection from
Unda
Pavel Gotkevitch
The Unda indicator determines the trend direction and strength, as well as signals about trend changes. The indicator uses price extremums for the previous periods and calculates the ratio between the current price and extremums. Therefore, the only parameter is Period (default = 13), which sets the number of bars to determine extremums. The higher the Period, the less the number of signals about trend changes, but the greater the indicator delay. Uptrends are shown by blue color of the indicato
K Channel
Pavel Gotkevitch
K_Channel is a technical indicator defining the current Forex market status - trend or flat. The indicator works on any timeframe. H1 and higher timeframes are recommended though to minimize false signals. The indicator is displayed as lines above and below EMA. Average True Range (ATR) is used as bands' width. Therefore, the channel is based on volatility. This version allows you to change all the parameters of the main Moving Average. Unlike Bollinger Bands that applies the standard deviation
D Channel
Pavel Gotkevitch
D-Channel is a technical indicator defining the current Forex market status - trend or flat. The indicator is based on DEMA (Double Exponential Moving Average). The advantage of DEMA is that it eliminates false signals at the saw-toothed price movement and allows saving a position at a strong trend. The indicator can work on any timeframe, though H1 and higher timeframes are recommended to minimize false signals. The indicator displays a channel as lines located above and below the average line.
Stips
Pavel Gotkevitch
Stips is a histogram indicator that determines trend direction and strength, as well as trend changes. The indicator can be used as a normal oscillator, i.e. analyze its trend change signals (crossing the zero line), as well as divergence and exit from overbought and oversold zones. The indicator uses extreme prices of previous periods and calculates the ratio between the current price and extreme values. Therefore its only parameter is Period (default is 13), which sets the number of bars to de
F Channel
Pavel Gotkevitch
F-Channel is a technical indicator defining the current Forex market status - trend or flat. The indicator is based on FRAMA (Fractal Adaptive Moving Average). The FRAMA follows strong trend movements and slows down significantly during price consolidation. The indicator is able to work on any timeframes, but H1 and higher timeframes are recommended to minimize false signals. The indicator displays a channel as lines located above and below the middle line. The upper and lower lines can serve as
Labor
Pavel Gotkevitch
Labor is a technical analysis indicator defining trend direction and power, as well as signaling a trend change. The indicator is based on a modified EMA (Exponential Moving Average) with an additional smoothing filter. The indicator works on any timeframe. The uptrend is shown as a blue line, while a downtrend - as a red one. Close a short position and open a long one if the line color changes from red to blue. Close a long position and open a short one if the line color changes from blue to re
P Channel
Pavel Gotkevitch
P-Channel is a technical indicator determining the current Forex market status - trend or flat. The indicator is able to work on any timeframes, but H1 and higher timeframes are recommended to minimize false signals. The indicator displays a channel as lines located above and below the middle line. The upper and lower lines can serve as the resistance and support levels. Sell when the price reaches the upper line, and buy when the price reaches the lower line. It is recommended to use a small st
FRAMA Crossing
Pavel Gotkevitch
The FRAMA Crossing indicator displays on a chart two FRAMAs (Fractal Adaptive Moving Average) and paints their crossing areas in different colors – blue (buy) and red (sell). FRAMA follows strong trend movements and slows down significantly during price consolidation. The indicator clearly defines the trend direction and power and simplifies the perception of market signals. The indicator can work on any timeframes may be useful in the strategies involving two moving averages' crossing method. T
CCI Crossing
Pavel Gotkevitch
The CCI Crossing indicator displays the intersection of two CCI (Commodity Channel Index) indicators - fast and slow - in a separate window. The intersection area is filled in blue, when the fast CCI is above the slow CCI. The intersection area is filled in red, when the fast CCI is below the slow CCI. This indicator is a convenient tool for measuring the deviations of the current price from the statistically average price and identifying overbought and oversold levels. The indicator can work on
Dash
Pavel Gotkevitch
Dash is a histogram indicator, which measures the rate of price change and determines the overbought and oversold levels. The indicator uses price extremums for the previous periods and calculates the ratio between the current price and extremums. Therefore, the only parameter is Period , which sets the number of bars to determine extremums. A long position can be opened when the red lines of the indicator start leaving the oversold area and break the -1 level upwards. A short position can be op
Surge
Pavel Gotkevitch
The Surge indicator combines the features of trend indicators and oscillators. The indicator measures the rate of price change and determines the overbought and oversold market levels. The indicator can be used on all timeframes and is a convenient tool for detecting short-term market cycles. The indicator uses price extremums for the previous periods and calculates the ratio between the current price and extremums. Therefore, the only parameter is Period, which sets the number of bars to determ
DEMA Crossing
Pavel Gotkevitch
The DEMA Crossing indicator displays the intersection of two DEMA (Double Exponential Moving Average) - fast and slow. The intersection area is filled in blue, when the fast DEMA is above the slow DEMA. The intersection area is filled in red, when the fast DEMA is below the slow DEMA. The advantage of the DEMA moving average is that it eliminates false signals at the saw-toothed price movement and allows saving a position at a strong trend. The indicator clearly defines the trend direction and p
Trend Sight
Pavel Gotkevitch
The Trend Sight indicator shows the Moving Average's percent change from the current bar to the other selected bar allowing you to track the smoothed price change rate, as well as trend strength and change. The uptrend is shown as a blue indicator line, while a downtrend is displayed in red. Close a short position and open a long one if the line color changes from red to blue. Close a long position and open a short one if the line color changes from blue to red. You should use a tight stop loss,
Trend Sign
Pavel Gotkevitch
The Trend Sign indicator is a modification of the MACD indicator (Moving Average Convergence Divergence), which allows determining the direction and strength of the trend, as well as a trend change. The indicator is based on two moving averages - fast and slow, and it can work on any timeframe. Uptrends are shown by blue color of the indicator line, downtrends by the red color. Close a short position and open a long one if the line color changes from red to blue. Close a long position and open a
DEMA Trend
Pavel Gotkevitch
The DEMA Trend indicator is based on two DEMA (Double Exponential Moving Average) - fast and slow. The advantage of the DEMA moving average is that it eliminates false signals at the saw-toothed price movement and allows saving a position at a strong trend. The indicator allows determining the direction and strength of the trend, and it can work on any timeframe. Uptrends are shown by blue color of the indicator line, downtrends by the red color. Close a short position and open a long one if the
T Channel
Pavel Gotkevitch
T-Channel is a technical indicator defining the current Forex market status - trend or flat. The indicator is based on TEMA (Triple Exponential Moving Average). The advantage of the TEMA is that it provides a smaller delay than a moving average with a single or double smoothing. The indicator is able to work on any timeframes, but H1 and higher timeframes are recommended to minimize false signals. The indicator displays a channel as lines located above and below the middle line. The upper and lo
TEMA Trend
Pavel Gotkevitch
The TEMA Trend indicator is based on two TEMA (Triple Exponential Moving Average) - fast and slow. The advantage of the TEMA is that it provides a smaller delay than a moving average with a single or double smoothing. The indicator allows determining the direction and strength of the trend, and it can work on any timeframe. Uptrends are shown by blue color of the indicator line, downtrends by the red color. Close a short position and open a long one if the line color changes from red to blue. Cl
TrendDetect
Pavel Gotkevitch
The Trend Detect indicator combines the features of both trend indicators and oscillators. This indicator is a convenient tool for detecting short-term market cycles and identifying overbought and oversold levels. A long position can be opened when the indicator starts leaving the oversold area and breaks the zero level from below. A short position can be opened when the indicator starts leaving the overbought area and breaks the zero level from above. An opposite signal of the indicator can b
Trade Helper
Pavel Gotkevitch
The Trade Helper indicator is a modification of the Trade Assistant indicator (by Andriy Moraru). The Trade Helper multitimeframe indicator is a good assistant for traders, useful as a filter in most trading strategies. This indicator combines the tactics of Elder's Triple Screen in a single chart, which lies in entering a trade when the same trend is present on three adjacent timeframes. The indicator operation is based on the principle of determining the trend on the three selected timeframes
Lotus
Pavel Gotkevitch
Lotus indicator combines the features of both trend indicators and oscillators allowing you to track the smoothed price change rate, as well as trend strength and change. The uptrend is shown as a green indicator line, while a downtrend is displayed in red. A long position can be opened when the indicator breaks the zero level from below. A short position can be opened when the indicator breaks the zero level from above. An opposite signal of the indicator can be used for exiting positions. You
DEMA Cross DEMA Cross - это мультивалютный трендовый советник, работающий на реальных счетах любого типа, на любом временном интервале, с любым начальным депозитом, с постоянным или изменяющимся размером лота, с четырех- и с пятизначными котировками, а также с брокерами, использующими различный тип заливки ордеров. Отличительной особенностью советника является его стабильность и, что особенно важно, его достоверность. Результаты проверки советника в тестере стратегий в 4-х режимах (2 основных
Filtro:
Mauro Giuseppe Tondo
1990
Mauro Giuseppe Tondo 2022.09.18 23:01 
 

El usuario no ha dejado ningún comentario para su valoración

Pavel Gotkevitch
30415
Respuesta del desarrollador Pavel Gotkevitch 2022.09.19 10:40
What do you mean "no"?
The Support & Resistance indicator is a graphic modification of the standard Fractals indicator by Bill Williams.
Do you personally dislike Bill Williams?
Otherwise, explain and prove your inappropriate "no"!
MSosnovski
16
MSosnovski 2022.02.18 20:20 
 

El usuario no ha dejado ningún comentario para su valoración

FMATRADER
14
FMATRADER 2021.04.04 02:32 
 

El usuario no ha dejado ningún comentario para su valoración

Valentin Butorin
4125
Valentin Butorin 2020.07.23 14:20 
 

El usuario no ha dejado ningún comentario para su valoración

Detleff Böhmer
2863
Detleff Böhmer 2020.03.20 10:40 
 

El usuario no ha dejado ningún comentario para su valoración

johnpaul80
67
johnpaul80 2019.07.28 13:02 
 

El usuario no ha dejado ningún comentario para su valoración

Goncalo Barata
435
Goncalo Barata 2019.05.11 13:34 
 

El usuario no ha dejado ningún comentario para su valoración

sunnychow
9051
sunnychow 2019.01.12 16:16 
 

El usuario no ha dejado ningún comentario para su valoración

[Eliminado] 2019.01.07 17:40 
 

El usuario no ha dejado ningún comentario para su valoración

Eduardo Alves Neto
167
Eduardo Alves Neto 2018.03.05 04:16 
 

El usuario no ha dejado ningún comentario para su valoración

Aleksandr Tamonin
4107
Aleksandr Tamonin 2018.01.17 11:47 
 

El usuario no ha dejado ningún comentario para su valoración

Gennadiy Voltornist
11909
Gennadiy Voltornist 2017.11.26 19:16 
 

El usuario no ha dejado ningún comentario para su valoración

Daniil Gorbunov
95
Daniil Gorbunov 2017.11.15 15:33 
 

El usuario no ha dejado ningún comentario para su valoración

Daniel Andrejczuk
5596
Daniel Andrejczuk 2017.11.08 12:15 
 

El usuario no ha dejado ningún comentario para su valoración

Andrey Litvichenko
7583
Andrey Litvichenko 2017.10.19 13:24 
 

El usuario no ha dejado ningún comentario para su valoración

Ali irwan
5136
Ali irwan 2017.07.20 07:15 
 

El usuario no ha dejado ningún comentario para su valoración

Forex Team Team
232
Forex Team Team 2017.04.11 03:45 
 

El usuario no ha dejado ningún comentario para su valoración

Alexander Baluev
147
Alexander Baluev 2017.03.01 17:23 
 

El usuario no ha dejado ningún comentario para su valoración

Nork
6192
Nork 2016.03.28 03:18 
 

El usuario no ha dejado ningún comentario para su valoración

Rodrigo da Silva Boa
7136
Rodrigo da Silva Boa 2015.12.09 06:09 
 

El usuario no ha dejado ningún comentario para su valoración

Respuesta al comentario
Versión 1.2 2022.03.24
The indicator is optimized for new versions of MT5.
Versión 1.1 2020.03.25
Улучшена стабильность и скорость работы индикатора.