• Información general
  • Comentarios (75)
  • Discusión (428)
  • Novedades

Cumulative Delta MT5

4.53

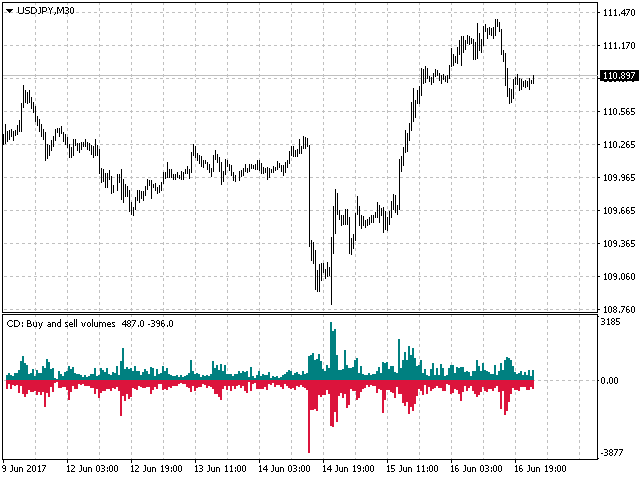
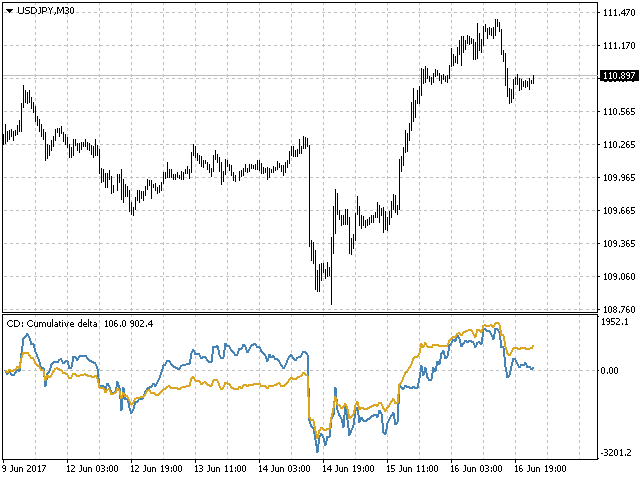
The indicator analyzes the volume scale and splits it into two components - seller volumes and buyer volumes, and also calculates the delta and cumulative delta.

The indicator does not flicker or redraw, its calculation and plotting are performed fairly quickly, while using the data from the smaller (relative to the current) periods.

The indicator operation modes can be switched using the Mode input variable:

  • Buy - display only the buyer volumes.
  • Sell - display only the seller volumes.
  • BuySell - display only the buyer and seller volumes in two separate scales.
  • Delta - the mode of difference (delta) between the buyer volumes and seller volumes.
  • CumDelta - cumulative delta mode.
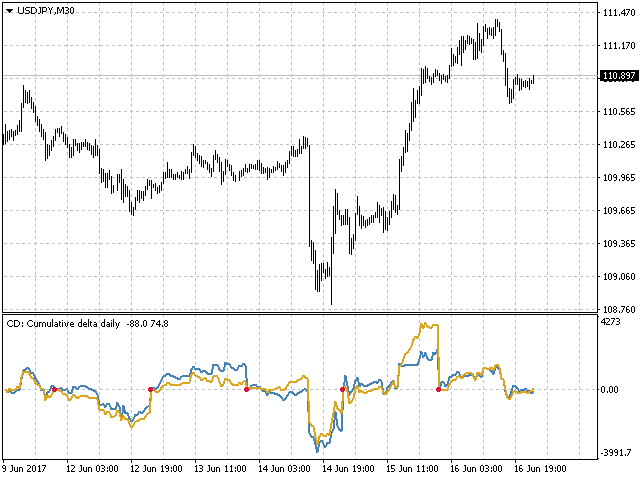
  • CumDeltaDaily - cumulative delta mode with zeroing the balance at the beginning of each day.
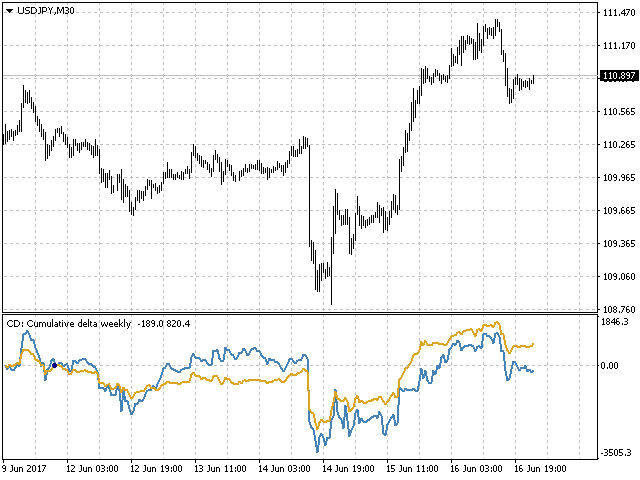
  • CumDeltaWeekly - cumulative delta mode with zeroing the balance at the beginning of each week.
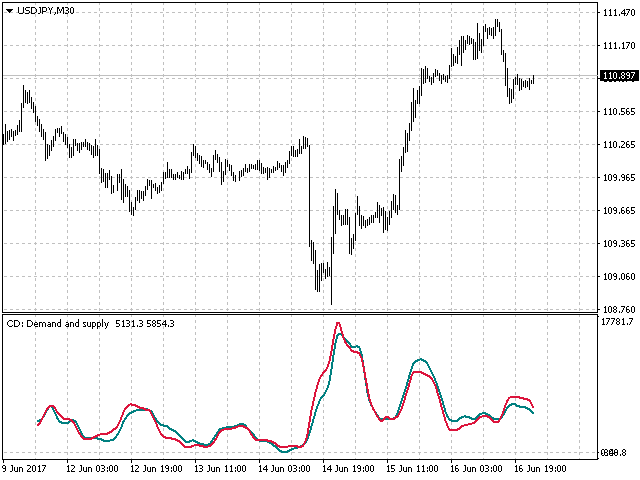
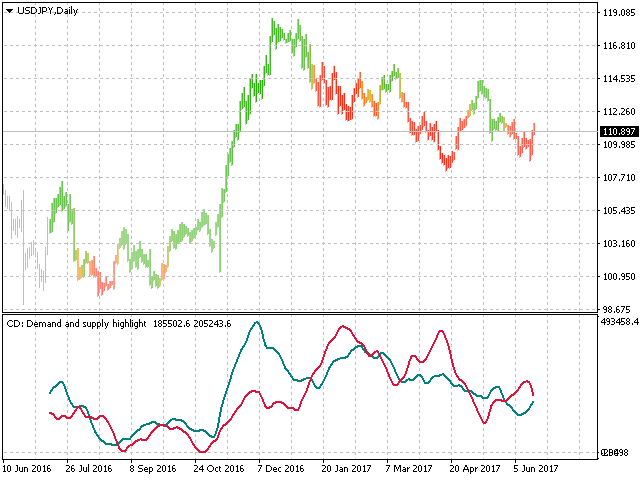
  • DemandAndSupply - display the supply and demand diagram.


Full recalculation of data is performed once per minute, when a new candle opens on the M1 timeframe, or in case of a user activity, namely, when scrolling the chart deeper into the history, when changing the time scale of the chart or when changing the current timeframe.

By default, the initial reference point is the very first candle from the left border of the chart window. The reference point can be changed using the BarsLimit input variable.

The indicator works with both real volumes and tick volumes. The required scale can be selected in the indicator properties using the Volumes input variable, which sets the Tick or Real modes.

In case the data from any of the volume scales or the data on any of the periods required in calculations is missing, the indicator generates a corresponding message.

Comentarios 20
ThienGia
47
ThienGia 2024.06.12 15:41 
 

thanks u

Rodrigo De Paula
570
Rodrigo De Paula 2024.05.31 21:58 
 

Boa tarde! Aprecio bastante seu indicador e gostaria de testar o buffer no mode DemandAndSupplyRatio, mas não consigo encontrar ele para simular no testador de estratégias. Estou usando o seguinte código abaixo para testar e dá erros: "handleCumul=iCustom(_Symbol,_Period,"Market/Cumulative Delta MT5.ex5",5,0,0,0,0,0,0,9);" Poderia me ajudar, por favor?

Patrice Assi
78
Patrice Assi 2024.05.06 03:58 
 

Seems very good. Earl entry. Thank you

Productos recomendados
What is this indicator? This indicator is the MACD (Moving Average Convergence/Divergence) supporting Virtual Trading mode of  Knots Compositor . When the mode is turned on, the indicator will be recalculated based on the displayed candlesticks. When the mode is turned off, the indicator will be recalculated based on the original chart candlesticks. Types of the applied price - Close - Open - High - Low - Median Price (HL/2) - Typical Price (HLC/3) - Weighted Price (HLCC/4) KC-Indicators
FREE
LT Donchian Channel
Thiago Duarte
4.8 (5)
Donchian Channel is an indicator created by Richard Donchian. It is formed by taking the highest high and the lowest low of the last specified period in candles. The area between high and low is the channel for the chosen period. Its configuration is simple. It is possible to have the average between the upper and lower lines, plus you have alerts when price hits one side. If you have any questions or find any bugs, please contact me. Enjoy!
FREE
Follow The Line MT5
Oliver Gideon Amofa Appiah
4.52 (29)
This indicator obeys the popular maxim that: "THE TREND IS YOUR FRIEND" It paints a GREEN line for BUY and also paints a RED line for SELL. (you can change the colors). It gives alarms and alerts of all kinds. IT DOES NOT REPAINT and can be used for all currency pairs and timeframes. Yes, as easy and simple as that. Even a newbie can use it to make great and reliable trades. NB: For best results, get my other premium indicators for more powerful and reliable signals. Get them here: https://www.m
FREE
Important Lines
Terence Gronowski
4.86 (21)
Indicador de líneas importantes (M1 - M15) Este indicador muestra Líneas pivote, Día anterior alta y baja, Cierre día anterior y el mínimo y máximo de la hora anterior. Simplemente tiene que arrastrar ese único indicador al diagrama para tener todas esas líneas importantes. Puede evitar cargar muchos indicadores individuales. ¿Por qué ciertas líneas son tan importantes cuando se comercia? El día a día, alto y bajo: estos son observados por los comerciantes que comercian en un gráfico dia
FREE
BoxInside MT5
Evgeny Shevtsov
5 (3)
This indicator calculates the volume profile and places labels that correspond to the VAH, VAL and POC levels, for each candle individually. Indicator operation features The indicator works on the timeframes from M3 to MN, but it uses the history data of smaller periods: M1 - for periods from M3 to H1, M5 - for periods from H2 to H12, M30 - for the D1 period, H4 - for the W1 period, D1 - for the MN period. The color and location of the VAL, VAH and POC labels on the current candle are consider
FREE
Market Profile 3 ForexArby com
Hussien Abdeltwab Hussien Ryad
3.83 (12)
Market Profile 3 MetaTrader 5 indicator  version 4.70— is a classic Market Profile implementation that can show the price density over time, outlining the most important price levels, value area, and control value of a given trading session. This indicator can be attached to timeframes between M1 and D1 and will show the Market Profile for daily, weekly, monthly, or even intraday sessions. Lower timeframes offer higher precision. Higher timeframes are recommended for better visibility. It is als
FREE
Value Chart Candlesticks
Flavio Javier Jarabeck
4.7 (10)
The idea of a Value Chart indicator was presented in the very good book I read back in 2020 , " Dynamic Trading Indicators: Winning with Value Charts and Price Action Profile ", from the authors Mark Helweg and David Stendahl. The idea is simple and the result is pure genius: Present candlestick Price analysis in a detrended way! HOW TO READ THIS INDICATOR Look for Overbought and Oversold levels. Of course, you will need to test the settings a lot to find the "correct" one for your approach.
FREE
This indicator is especially for the binary trading. Time frame is 1 minutes and exp time 5 or 3 minutes only. You must be use martingale 3 step. So you must put lots size is 10 % at most. You should use Mt2 trading platform to connect with my indicator to get more signal without human working. This indicator wining rate is over 80% but you may get 100% of profit by using martingale 3 step. You should use MT2 Trading Platform to connect meta trader platform and binary platform . You can get mt2
FREE
Aggression Volume
Flavio Javier Jarabeck
4.14 (14)
Aggression Volume Indicator is the kind of indicator that is rarely found in the MQL5 community because it is not based on the standard Volume data provided by the Metatrader 5 platform. It requires the scrutiny of all traffic Ticks requested on the platform... That said, Aggression Volume indicator requests all Tick Data from your Broker and processes it to build a very special version of a Volume Indicator, where Buyers and Sellers aggressions are plotted in a form of Histogram. Additionally,
FREE
Free automatic Fibonacci is an indicator that automatically plots a Fibonacci retracement based on the number of bars you select on the BarsToScan setting in the indicator. The Fibonacci is automatically updated in real time as new highest and lowest values appears amongst the selected bars. You can select which level values to be displayed in the indicator settings. You can also select the color of the levels thus enabling the trader to be able to attach the indicator several times with differe
FREE
El Capturador de Tendencias: La Estrategia del Capturador de Tendencias con Indicador de Alerta es una herramienta versátil de análisis técnico que ayuda a los traders a identificar las tendencias del mercado y los posibles puntos de entrada y salida. Presenta una Estrategia dinámica del Capturador de Tendencias, adaptándose a las condiciones del mercado para una clara representación visual de la dirección de la tendencia. Los traders pueden personalizar los parámetros para que se ajusten a s
FREE
Weis Waves
Flavio Javier Jarabeck
2.83 (18)
The original author is David Weis, an expert in the Wyckoff Method. The Weis Wave is a modern adaptation of the 1930's Wyckoff Method, another expert in Tape Reading techniques and Chart Analysis. Weis Waves takes market volume and stacks it into waves according to price conditions giving the trader valuable insights about the market conditions. If you want to learn more about this subject you can find tons of videos in YouTube. Just look for "The Wickoff Method", "Weis Wave" and "Volume Spread
FREE
Dual RSI
Paul Conrad Carlson
3 (1)
Indicator alerts for Dual Relative strength index rsi. Large rsi preset at 14 is below 30 small rsi preset at 4 is below 10 for buy bullish signals . Large rsi preset are 14 is above 70 small rsi preset at 4 is above 90 for sell bearish signals . Includes mobile and terminal alerts. draws lines when alerts. This indicator can help identify extremes and then the tops or bottoms of those extremes .
FREE
This indicator sums up the difference between the sells aggression and the buys aggression that occurred in each Candle, graphically plotting the waves of accumulation of the aggression volumes.   Through these waves an exponential average is calculated that indicates the direction of the business flow. Note: This indicator DOES NOT WORK for Brokers and/or Markets WITHOUT the type of aggression (BUY or SELL).   Be sure to try our Professional version with configurable features and alerts:  Agr
FREE
Are you tired of drawing trendlines every time you're analyzing charts? Or perhaps you would like more consistency in your technical analysis. Then this is for you. This indicator will draw trend lines automatically when dropped on a chart. How it works Works similar to standard deviation channel found on mt4 and mt5. It has 2 parameters: 1. Starting Bar 2. Number of bars for calculation The   starting bar   is the bar which drawing of the trend lines will begin, while the   number of bars for c
FREE
High Low Open Close
Alexandre Borela
4.97 (37)
Si te gusta este proyecto, deja una revisión de 5 estrellas. Seguir en instagram: borelatech Este indicador dibuja los precios abiertos, altos, bajos y finales para los especificados período y se puede ajustar para una zona horaria específica. Estos son niveles importantes considerados por muchos institucionales y profesionales comerciantes y puede ser útil para que usted sepa los lugares donde podrían ser más activo. Los períodos disponibles son: Día previo. Semana anterior. Mes anteri
FREE
Waves Sizer
Flavio Javier Jarabeck
3.67 (6)
Wyckoff fans, enjoy! Ideally to be used with the Weis Waves indicator, but it can be easily used alone, the Waves Sizer puts the range (in resulting Price movement) done by the Price on its market swings. You can control how accurate or loose will be the swings. This tool is very helpful for visually know how much the Price has traveled in your Timeframe. This way you can confront this level of effort with the resulting Volume, etc... Weis Waves indicator: https://www.mql5.com/en/market/pro
FREE
Rainbow MT5
Jamal El Alama
4 (1)
Description : Rainbow MT5 is a technical indicator based on Moving Average with period 34 and very easy to use. When price crosses above MA and MA changes color to green, then this is a signal to buy. When price crosses below MA and MA changes color to red, then this is a signal to sell. The Expert advisor ( Rainbow EA MT5 ) based on Rainbow MT5 indicator is now available here . MT4 version is available here .
FREE
This indicator will mirror the assets in use in another metatrader, being able to choose the timeframe and a template. This is the Metatrader 5 Client, it needs the Metatrader 4 or 5 Server versions: Metatrader 4 Mirror Chart Server:   https://www.mql5.com/en/market/product/88644 Metatrader 5 Mirror Chart Server: https://www.mql5.com/en/market/product/88652 Details of how it works in the video.
FREE
Indicador Heiken Ashi MT5 Mejore su análisis técnico con el indicador Heiken Ashi MT5. Esta poderosa herramienta transforma los datos de precios estándar en velas más suaves y orientadas a la tendencia, facilitando la identificación de tendencias del mercado y posibles puntos de inversión. Características principales: Identificación clara de tendencias: Distinga visualmente entre tendencias alcistas y bajistas con diferentes colores de velas. Reducción del ruido: Filtre las fluctuaciones de pre
FREE
Expansoes M
Marcus Vinicius Da Silva Miranda
The M Extensions are variations of the Golden Ratio (Fibonacci Sequence). It is the World's first technique developed for Candle Projections. Advantages: Easy to plot. Candle anchoring; High and accurate precision as support and resistance; Excellent Risk x Return ratio; Works in any timeframe; Works in any asset / market.   The M Extensions are classified into: M0: Zero point (starting candle) RC: Initial candle control region M1: Extension region 1 M2: Extension region 2 M3: Extension r
FREE
This is a buyer and seller aggression indicator that analyzes the shape of each candle and project this data in a histogram form. There are 4 histograms in one. On the front we have two: Upper - Buyer force. Lower - Seller force. At the background we also have two histogram, both with same color. They measure the combined strenght of buyers and sellers. This histograms can be turned off in Input Parameters. It is also possible to have the real or tick volume to help on this force measurement. IN
FREE
El indicador identifica cuando ocurre una divergencia entre el precio y un indicador u oscilador. Identifica divergencias tanto regulares como ocultas. Combinado con sus propias reglas y técnicas, este indicador le permitirá crear (o mejorar) su propio sistema poderoso. Características Puede detectar divergencias para los siguientes osciladores / indicadores:       MACD, OsMA, estocásticos, RSI, CCI, RVI, Awesome, ADX, ATR, OBV, índice compuesto, MFI y Momentum. Solo se puede seleccionar un os
FREE
Automatic Trendlines
Pasi Hakamaki
4.63 (41)
El indicador dibuja líneas de tendencia en el gráfico. Este indicador tiene seis entradas. El usuario puede especificar etiquetas alternativas para ambas líneas. Si se utilizan varias instancias del indicador, las etiquetas deben ser diferentes. El usuario puede establecer el ancho y el color de las líneas y la profundidad, lo que especifica qué picos significativos deben usarse. Por ejemplo, Depth = 10 establece líneas de tendencia utilizando los picos y valles actuales que tienen al menos 10 b
FREE
What is this indicator? This indicator is the RSI (Relative Strength Index) supporting Virtual Trading mode of  Knots Compositor . When the mode is turned on, the indicator will be recalculated based on the displayed candlesticks. When the mode is turned off, the indicator will be recalculated based on the original chart candlesticks. Types of the applied price - Close - Open - High - Low - Median Price (HL/2) - Typical Price (HLC/3) - Weighted Price (HLCC/4) KC-Indicators -   KC-MA   (M
FREE
Micro  Demo  ******************* Секундные графики в Meta Trader 5 ********************** Более точного инструмента для входа в сделку вы не найдёте. Платная полная версия:  Micro "Second charts" В демоверсии секундные периоды сменяются случайным образом через случайные интервалы времени. Отсутствует автоматическая настройка периодов бесплатных индикаторов.   Входные параметры: Displayed bars - отображаемые бары Step of price levels, pp, 0-off - шаг отрисовки ценовых уровней, пункты Scale
FREE
Mitimom
Danil Poletavkin
The indicator is based on Robert Miner's methodology described in his book "High probability trading strategies" and displays signals along with momentum of 2 timeframes. A Stochastic oscillator is used as a momentum indicator. The settings speak for themselves period_1 is the current timeframe, 'current' period_2 is indicated - the senior timeframe is 4 or 5 times larger than the current one. For example, if the current one is 5 minutes, then the older one will be 20 minutes The rest of the
FREE
Tapeworm
Nikolay Mitrofanov
The indicator converts two moving averages into histograms and paints their intersection area. There is a shift trick setting, it is used to smooth the result of calculations. You can see the changes if you reduce this parameter to 1 (minimum value). Available averages: MA Simple MA Exponential MA LinearWeighted MA Smoothed DEMA TEMA and RSI - as a bonus By default, the fast MA is displayed at the top of the histogram, and the slow one at the bottom. You can swap them if you like. shi
FREE
Show Pips for MT5
Roman Podpora
4.63 (19)
Este indicador de información será útil para quienes quieran estar siempre al tanto de la situación actual de la cuenta. -   Indicadores más útiles El indicador muestra datos como ganancias en puntos, porcentaje y moneda, así como el diferencial del par actual y el tiempo hasta que la barra se cierra en el período de tiempo actual. Hay varias opciones para colocar la línea de información en el gráfico: A la derecha del precio (corre detrás del precio); Como comentario (en la esquina superior
FREE
Coral Indi
Dinh Duong Luong
Coral trend is   a trend-following indicator that is widely popular among FOREX traders . It is usually used as a confluence with other indicators. It uses combinations of moving averages with complex smoothing formulas! It has two configurable parameters: Coefficient   - smoothing ratio (*) Applied price Calculation: Coral = (-0.064) * B6 + 0.672 * B5 - 2.352 * B4 + 2.744 * B3
FREE
Los compradores de este producto también adquieren
TPSproTREND PrO MT5
Roman Podpora
4.9 (10)
TPSpro TREND PRO  - is a trend indicator that automatically analyzes the market and provides information about the trend and each of its changes, as well as giving signals for entering trades without redrawing! The indicator uses each candle, analyzing them separately. referring to different impulses - up or down impulse. Exact entry points into transactions for currencies, crypto, metals, stocks, indices!  Version MT4               DETAILED DESCRIPTION               R ecommended to use with an
TPSpro RFI Levels MT5
Roman Podpora
4.75 (12)
INSTRUCCIONES       RUSO   -   ING        Se   recomienda utilizar con un indicador.       -       TPSpro   TENDENCIA PRO -   Versión MT5 Un elemento clave en el trading son las zonas o niveles desde los que se toman las decisiones de compra o venta de un instrumento de trading. A pesar de los intentos de los principales actores de ocultar su presencia en el mercado, inevitablemente dejan rastros. Nuestra tarea era aprender a identificar estos rastros e interpretarlos correctamente. Funciones p
Quantum TrendPulse
Bogdan Ion Puscasu
5 (1)
Presentamos   Quantum TrendPulse   , la herramienta de trading definitiva que combina el poder de   SuperTrend   ,   RSI   y   Stochastic   en un indicador integral para maximizar su potencial de trading. Diseñado para traders que buscan precisión y eficiencia, este indicador le ayuda a identificar tendencias del mercado, cambios de impulso y puntos de entrada y salida óptimos con confianza. Características principales: Integración con SuperTrend:   siga fácilmente la tendencia predominante del
FX Levels es un indicador de soporte y resistencia excepcionalmente preciso que fusiona el método Lighthouse tradicional con un enfoque dinámico innovador, funcionando a la perfección en todos los símbolos de negociación. Esto incluye pares de divisas, índices, acciones o materias primas. FX Levels identifica puntos de reversión y los muestra en el gráfico, que pueden utilizarse idealmente como objetivos de beneficios en sus actividades de negociación. En el desarrollo de FX Levels, hemos utili
Atbot
Zaha Feiz
4.89 (38)
AtBot: Cómo funciona y cómo usarlo ### Cómo funciona El indicador "AtBot" para la plataforma MT5 genera señales de compra y venta utilizando una combinación de herramientas de análisis técnico. Integra la Media Móvil Simple (SMA), la Media Móvil Exponencial (EMA) y el índice de Rango Verdadero Promedio (ATR) para identificar oportunidades de trading. Además, puede utilizar velas Heikin Ashi para mejorar la precisión de las señales. Deja una reseña después de la compra y recibe un regalo especia
Gold Stuff mt5
Vasiliy Strukov
4.92 (171)
Gold Stuff mt5: un indicador de tendencia diseñado específicamente para el oro, también se puede usar en cualquier instrumento financiero. El indicador no se vuelve a dibujar ni se retrasa. El marco de tiempo recomendado es H1. IMPORTANTE! Póngase en contacto conmigo inmediatamente después de la compra para obtener instrucciones y bonificación!   Puede obtener una copia gratuita de nuestro indicador Strong Support y Trend Scanner, por favor envíe un mensaje privado. ¡a mí! PARÁMETROS Draw
Trend Screener Pro MT5
STE S.S.COMPANY
4.88 (66)
Desbloquee el poder del comercio de tendencias con el indicador Trend Screener: ¡su solución definitiva para el comercio de tendencias impulsada por lógica difusa y un sistema multidivisa!Mejore su comercio de tendencias con Trend Screener, el revolucionario indicador de tendencias impulsado por lógica difusa. Es un poderoso indicador de seguimiento de tendencias que combina más de 13 herramientas y funciones premium y 3 estrategias comerciales, lo que lo convierte en una opción versátil para co
Este tablero muestra los últimos   patrones armónicos   disponibles para los símbolos seleccionados, por lo que ahorrará tiempo y será más eficiente /   versión MT4 . Indicador gratuito:   Basic Harmonic Pattern Columnas del indicador Symbol:   aparecerán los símbolos seleccionados Trend :   alcista o bajista Pattern :   tipo de patrón (gartley, mariposa, murciélago, cangrejo, tiburón, cifrado o ABCD) Entry :   precio de entrada SL:   precio de stop loss TP1:   1er precio de toma de benefici
Atomic Analyst MT5
Issam Kassas
4.32 (19)
En primer lugar, vale la pena enfatizar que este Indicador de Trading no repinta, no redibuja y no se retrasa, lo que lo hace ideal tanto para el trading manual como para el automatizado. Manual del usuario: configuraciones, entradas y estrategia. El Analista Atómico es un Indicador de Acción del Precio PA que utiliza la fuerza y el impulso del precio para encontrar una mejor ventaja en el mercado. Equipado con filtros avanzados que ayudan a eliminar ruidos y señales falsas, y aumentan el poten
Primero que todo, vale la pena enfatizar que este Sistema de Trading es un Indicador No Repintado, No Redibujado y No Retrasado, lo que lo hace ideal tanto para el trading manual como para el automatizado. Curso en línea, manual y descarga de ajustes preestablecidos. El "Sistema de Trading Inteligente MT5" es una solución completa de trading diseñada para traders nuevos y experimentados. Combina más de 10 indicadores premium y presenta más de 7 estrategias de trading robustas, lo que lo convie
FX Power MT5 NG
Daniel Stein
5 (7)
Obtenga su actualización diaria del mercado con detalles y capturas de pantalla a través de nuestro Morning Briefing aquí en mql5 y en Telegram ! FX Power MT5 NG es la nueva generación de nuestro popular medidor de fuerza de divisas, FX Power. ¿Y qué ofrece este medidor de fuerza de nueva generación? Todo lo que le encantaba del FX Power original PLUS Análisis de fuerza de ORO/XAU Resultados de cálculo aún más precisos Períodos de análisis configurables individualmente Límite de cálculo persona
FX Volume MT5
Daniel Stein
4.93 (14)
Obtenga su actualización diaria del mercado con detalles y capturas de pantalla a través de nuestro Morning Briefing aquí en mql5 y en Telegram ! FX Volume es el PRIMER y ÚNICO indicador de volumen que proporciona una visión REAL del sentimiento del mercado desde el punto de vista de un bróker. Proporciona una visión impresionante de cómo los participantes institucionales del mercado, como los brokers, están posicionados en el mercado Forex, mucho más rápido que los informes COT. Ver esta info
Matrix Arrow Indicator MT5
Juvenille Emperor Limited
5 (13)
Matrix Arrow Indicator MT5   es una tendencia única 10 en 1 que sigue un indicador   100% sin repintado   de marcos temporales múltiples que se puede usar en todos los símbolos/instrumentos:   divisas ,   materias primas ,   criptomonedas ,   índices ,   acciones .  Matrix Arrow Indicator MT5  determinará la tendencia actual en sus primeras etapas, recopilando información y datos de hasta 10 indicadores estándar, que son: Índice de movimiento direccional promedio (ADX) Índice de canales de prod
ATrend
Zaha Feiz
4.83 (6)
ATREND: Cómo Funciona y Cómo Usarlo #### Cómo Funciona El indicador "ATREND" para la plataforma MT5 está diseñado para proporcionar a los traders señales de compra y venta robustas mediante una combinación de metodologías de análisis técnico. Este indicador utiliza principalmente el Rango Verdadero Promedio (ATR) para medir la volatilidad, junto con algoritmos de detección de tendencias para identificar posibles movimientos del mercado. Deja un mensaje después de la compra y recibe un regalo es
Presentamos el Indicador de Scalping Gold Blitz, la herramienta definitiva para hacer scalping con oro en los marcos de tiempo M1, M5 y M15. Desarrollado utilizando redes neuronales AI avanzadas, este indicador sin repintado asegura rentabilidad constante y resultados de trading superiores. Diseñado para precisión y eficiencia, el Indicador de Scalping Gold Blitz está optimizado para ofrecer los mejores resultados en el marco de tiempo M15. Características Principales: Redes Neuronales AI Av
Introduciendo       Quantum Breakout PRO   , el innovador indicador MQL5 que está transformando la forma en que comercia con Breakout Zones. Desarrollado por un equipo de comerciantes experimentados con experiencia comercial de más de 13 años,       Desglose cuántico PRO       está diseñado para impulsar su viaje comercial a nuevas alturas con su innovadora y dinámica estrategia de zona de ruptura. El indicador de ruptura cuántica le dará flechas de señal en las zonas de ruptura con 5 zonas
PZ Swing Trading MT5
PZ TRADING SLU
5 (4)
Swing Trading es el primer indicador diseñado para detectar oscilaciones en la dirección de la tendencia y posibles oscilaciones de reversión. Utiliza el enfoque de intercambio de línea de base, ampliamente descrito en la literatura comercial. El indicador estudia varios vectores de precios y tiempos para rastrear la dirección de la tendencia agregada y detecta situaciones en las que el mercado está sobrevendido o sobrecomprado y listo para corregir. [ Guía de instalación | Guía de actualización
Este es un genial indicador para MT5 que ofrece señales precisas para entrar en una transacción sin redibujar. Se puede aplicar a cualquier activo financiero: fórex, criptomonedas, metales, acciones, índices. Nos dará valoraciones bastante precisas y nos dirá cuándo es mejor abrir y cerra una transacción. Eche un vistazo  al vídeo  (6:22), ¡contiene un ejemplo de procesamiento de una sola señal que ha amortizado el indicador! La mayoría de los tráders mejoran sus resultados comerciales durante l
Ante todo, vale la pena enfatizar que esta Herramienta de Trading es un Indicador No Repintado, No Redibujado y No Retrasado, lo que la hace ideal para el trading profesional. Curso en línea, manual del usuario y demostración. El Indicador de Conceptos de Acción del Precio Inteligente es una herramienta muy potente tanto para traders nuevos como experimentados. Combina más de 20 indicadores útiles en uno solo, combinando ideas avanzadas de trading como el Análisis del Trader del Círculo Inte
ICT, SMC, SMART MONEY CONCEPTS, SMART MONEY, Smart Money Concept, Support and Resistance, Trend Analysis, Price Action, Market Structure, Order Blocks, BOS/CHoCH,   Breaker Blocks ,  Momentum Shift,   Supply&Demand Zone/Order Blocks , Strong Imbalance,   HH/LL/HL/LH,    Fair Value Gap, FVG,  Premium  &   Discount   Zones, Fibonacci Retracement, OTE, Buy Side Liquidity, Sell Side Liquidity, BSL/SSL Taken, Equal Highs & Lows, MTF Dashboard, Multiple Time Frame, BigBar, HTF OB, HTF Market Structure
¡La mejor solución para cualquier operador novato o experto! Este indicador es una herramienta única, de alta calidad y asequible porque hemos incorporado una serie de características propias y una nueva fórmula. ¡Con sólo UN gráfico puede leer la Fuerza de la Divisa para 28 pares de Divisas! Imagínese cómo mejorará su operativa porque podrá señalar el punto exacto de activación de una nueva tendencia o de una oportunidad de scalping. Manual del usuario: haga   clic aquí Ese es el primero
AT Forex Indicator MT5
Marzena Maria Szmit
5 (5)
The AT Forex Indicator MT5 is a sophisticated trading tool designed to provide traders with a comprehensive analysis of multiple currency pairs. This powerful indicator simplifies the complex nature of the forex market, making it accessible for both novice and experienced traders. AT Forex Indicator uses advanced algorithms to detect trends, patterns and is an essential tool for traders aiming to enhance their forex trading performance. With its robust features, ease of use, and reliable signal
Italo Trend Indicator MT5
Italo Santana Gomes
4.9 (10)
BUY INDICATOR AND GET EA FOR FREE AS A BONUS + SOME OTHER GIFTS! ITALO TREND INDICATOR  is the best trend indicator on the market, the Indicator works on all time-frames and assets, indicator built after 7 years of experience on forex and many other markets. You know many trend indicators around the internet are not complete, does not help, and it's difficult to trade, but the Italo Trend Indicator is different , the Italo Trend Indicator shows the signal to buy or sell, to confirm the signal t
Ahora $ 147 (aumentando a $ 499 después de algunas actualizaciones) - Cuentas ilimitadas (PC o Mac) Manual de usuario de RelicusRoad + Videos de capacitación + Acceso al grupo privado de Discord + Estado VIP UNA NUEVA MANERA DE VER EL MERCADO RelicusRoad es el indicador comercial más poderoso del mundo para divisas, futuros, criptomonedas, acciones e índices, y brinda a los comerciantes toda la información y las herramientas que necesitan para mantenerse rentables. Brindamos análisis téc
Blahtech Supply Demand MT5
Blahtech Limited
4.54 (13)
Was: $299  Now: $99   Supply Demand uses previous price action to identify potential imbalances between buyers and sellers. The key is to identify the better odds zones, not just the untouched ones. Blahtech Supply Demand indicator delivers functionality previously unavailable on any trading platform. This 4-in-1 indicator not only highlights the higher probability zones using a multi-criteria strength engine, but also combines it with multi-timeframe trend analysis, previously confirmed swings
Este es posiblemente el indicador de reconocimiento automático de formación de precios más completo que puede encontrar para la plataforma MetaTrader. Detecta 19 patrones diferentes, toma las proyecciones de Fibonacci tan en serio como usted, muestra la zona de reversión potencial (PRZ) y encuentra niveles adecuados de stop-loss y take-profit. [ Guía de instalación | Guía de actualización | Solución de problemas | FAQ | Todos los productos ] Detecta 19 formaciones de precios armónicos difer
** All Symbols x All Timeframes scan just by pressing scanner button ** *** Contact me  to send you instruction and add you in "123 scanner group" for sharing or seeing experiences with other users. After 17 years of experience in the markets and programming, Winner indicator is ready. I would like to share with you! Introduction The 123 Pattern Scanner indicator with a special enhanced algorithm is a very repetitive common pattern finder with a high success rate . Interestingly, this Winner in
Black Dragon indicator mt5
Ramil Minniakhmetov
4.82 (56)
El indicador de detección de tendencias complementará cualquier estrategia y también se puede utilizar como una herramienta independiente. Ventajas Fácil de usar, no sobrecarga el gráfico con información innecesaria; Puede usarse como filtro para cualquier estrategia; Tiene niveles integrados de soporte y resistencia dinámicos, que se pueden usar tanto para obtener ganancias como para establecer límites de pérdidas; El indicador no cambia de color después de que se cierra la vela;  Funciona
IX Power MT5
Daniel Stein
4.17 (6)
IX Power   lleva por fin la insuperable precisión de FX Power a los símbolos que no son de Forex. Determina con exactitud la intensidad de las tendencias a corto, medio y largo plazo de tus índices, acciones, materias primas, ETF e incluso criptodivisas favoritas. Puede   analizar todo lo   que su terminal le ofrece. Pruébalo y experimenta cómo   tu timing mejora significativamente   a la hora de operar. Características principales de IX Power Resultados de cálculo 100% precisos y sin rep
Quantum Trend Sniper
Bogdan Ion Puscasu
4.71 (49)
Introduciendo       Indicador Quantum Trend Sniper   , el innovador indicador MQL5 que está transformando la forma en que identificas y negocias los cambios de tendencia. Desarrollado por un equipo de comerciantes experimentados con experiencia comercial de más de 13 años,       Indicador de francotirador de tendencia cuántica       está diseñado para impulsar su viaje comercial a nuevas alturas con su forma innovadora de identificar cambios de tendencia con una precisión extremadamente alta.
Otros productos de este autor
Clusters Chart MT4
Evgeny Shevtsov
5 (6)
The indicator displays volume clusters or volume profiles to choose from. Input variables StepPoint  - cluster step in points, if the value is zero, the step is assigned automatically. AssociatedTimeframe  - binding the indicator to the specified timeframe of the chart, if the value is equal to Current, the indicator works on all timeframes. ClustersVolume  - volume in clusters: All  - all volume. Active  - active volume (which produced the price movement). ClustersAsDelta  - difference betw
AnyProfile MT5
Evgeny Shevtsov
5 (17)
The indicator displays market profiles of any duration in any place on the chart. Simply create a rectangle on the chart and this rectangle will be automatically filled by the profile. Change the size of the rectangle or move it - the profile will automatically follow the changes. Operation features The indicator is controlled directly from the chart window using the panel of buttons and fields for entering parameters. In the lower right corner of the chart window there is a pop-up "AP" but
Clusters Chart MT5
Evgeny Shevtsov
5 (6)
The indicator displays volume clusters or volume profiles to choose from. For trading symbols which contain the tape of deals, the indicator can perform calculations based on the tape of deals. Input variables StepPoint  - cluster step in points, if the value is zero, the step is assigned automatically. HistoryTicks  - size of tick history (for VolumeType in the mode TimeAndSales). AssociatedTimeframe  - binding the indicator to the specified timeframe of the chart, if the value is equal to
The balance of supply and demand is a simple and effective market analysis method. The supply and demand diagram can show you in advance, even before the trend reversal, where the supply ends and the demand is already emerging, where the demand ends and the supply is emerging, while substantially increasing the probability of making a deal in the right direction and with a high profit factor. Indicator signals The indicator uses the price/volume values to generate signals: ED – excess demand.
The balance of supply and demand is a simple and effective market analysis method. The supply and demand diagram can show you in advance, even before the trend reversal, where the supply ends and the demand is already emerging, where the demand ends and the supply is emerging, while substantially increasing the probability of making a deal in the right direction and with a high profit factor. Indicator Signals The indicator uses the price/volume values to generate signals: ED – excess demand.
Smart Depth Of Market
Evgeny Shevtsov
4.25 (16)
The indicator displays the orders book, as well as increases its depth, remembering the location of orders that have gone beyond the current "window" view. Indicator capability Display the levels of open positions. Simulation of placing/cancelling/editing pending orders directly in the displayed orders book. Indicator features The orders book display works only on those trading symbols for which it is broadcast by the broker. To reset the information about the rows that were recorded in the
FREE
BoxProfile MT5
Evgeny Shevtsov
4.5 (10)
The indicator displays volume profiles based on the nesting principle. Profiles periods are pre-set so that each subsequent profile has a length twice as long as the length of the previous profile. In addition to profiles, the indicator displays volume clusters sorted by color, depending on the volume they contain. Indicator operation features The indicator works on typical timeframes from M5 to MN, but for calculations uses historical data from smaller timeframes: M1 - for timeframes from M5
FREE
Cumulative Delta MT4
Evgeny Shevtsov
4.93 (27)
The indicator analyzes the volume scale and splits it into two components - seller volumes and buyer volumes, and also calculates the delta and cumulative delta. The indicator does not flicker or redraw, its calculation and plotting are performed fairly quickly, while using the data from the smaller (relative to the current) periods. The indicator operation modes can be switched using the Mode input variable: Buy - display only the buyer volumes. Sell - display only the seller volumes. BuySell -
FREE
Market Marker MT4
Evgeny Shevtsov
5 (8)
The indicator displays peak levels of activity formed by the maximum volume, tracks the correlation of the candles on all timeframes (from the highest to the lowest one). Each volume level is a kind of key trading activity. The most important cluster is inside a month, week, day, hour, etc. Indicator operation features A volume level receives Demand status if the nearest volume level located to the left and above has been broken upwards. A volume level receives Supply status if the nearest vol
BoxInside MT5
Evgeny Shevtsov
5 (3)
This indicator calculates the volume profile and places labels that correspond to the VAH, VAL and POC levels, for each candle individually. Indicator operation features The indicator works on the timeframes from M3 to MN, but it uses the history data of smaller periods: M1 - for periods from M3 to H1, M5 - for periods from H2 to H12, M30 - for the D1 period, H4 - for the W1 period, D1 - for the MN period. The color and location of the VAL, VAH and POC labels on the current candle are consider
FREE
BoxProfile MT4
Evgeny Shevtsov
4.92 (12)
The indicator displays volume profiles based on the nesting principle. Profiles periods are pre-set so that each subsequent profile has a length twice as long as the length of the previous profile. In addition to profiles, the indicator displays volume clusters sorted by color, depending on the volume they contain. Indicator operation features The indicator works on typical timeframes from M5 to MN, but for calculations uses historical data from smaller timeframes: M1 - for timeframes from M5
FREE
FORTS Trading Data
Evgeny Shevtsov
5 (1)
The indicator has been designed for use on FORTS, but it can also work on other markets, at brokers broadcasting the required data. A peculiarity of these data is that they cannot be requested from the broker's server as a section of history, but can only be obtained for the current moment. The indicator periodically requests the broker, collects to a file and displays the following history from the stored file: The weighted average price. The volume of buy pending orders. The volume of sell pen
FREE
BoxChart MT5
Evgeny Shevtsov
5 (7)
The market is unfair if only because 10% of participants manage 90% of funds. An ordinary trader has slim changes to stand against these "vultures". This problem can be solved. You just need to be among these 10%, learn to predict their intentions and move with them. Volume is the only preemptive factor that faultlessly works on any timeframe and symbol. First, the volume appears and is accumulated, and only then the price moves. The price moves from one volume to another. Areas of volume accumu
The indicator refers to the means of probabilistic analysis. Prediction is performed by the Monte Carlo method together with a mathematical model of a neuron. But, the modeling of samples for this method is made not artificially, but comes from the original "nature", that is, from history. The number of samples and the detail of their modeling is achieved using the lower (relative current) timeframe. Indicator algorithm : In general terms, the algorithm boils down to the fact that the ind
BoxInside MT4
Evgeny Shevtsov
4.86 (7)
This indicator calculates the volume profile and places labels that correspond to the VAH, VAL and POC levels, for each candle individually. Indicator operation features The indicator works on the timeframes from M5 to MN, but it uses the history data of smaller periods: M1 - for periods from M5 to H1, M5 - for the H4 period, M30 - for the D1 period, H4 - for the W1 period, D1 - for the MN period. The color and location of the VAL, VAH and POC labels on the current candle are considered to be
FREE
AnyProfile MT4
Evgeny Shevtsov
5 (25)
The indicator displays market profiles of any duration in any place on the chart. Simply create a rectangle on the chart and this rectangle will be automatically filled by the profile. Change the size of the rectangle or move it - the profile will automatically follow the changes. Operation features The indicator is controlled directly from the chart window using the panel of buttons and fields for entering parameters. In the lower right corner of the chart window there is a pop-up "AP" butt
The utility refers to probabilistic analysis tools, in particular the Monte Carlo method. The Monte Carlo method is defined as the simulation of processes in purpose to evaluate their probabilistic characteristics and apply them to the solvable task. Operation features The simulation uses a tick model with the subsequent transformation to the candles form, as a model as close as possible to the real market process. The utility generates a stream of a random tick sequence until a result with th
BoxChart MT4
Evgeny Shevtsov
4.5 (6)
The market is unfair if only because 10% of participants manage 90% of funds. An ordinary trader has slim changes to stand against these "vultures". This problem can be solved. You just need to be among these 10%, learn to predict their intentions and move with them. Volume is the only preemptive factor that faultlessly works on any timeframe and symbol. First, the volume appears and is accumulated, and only then the price moves. The price moves from one volume to another. Areas of volume accumu
Dynamic POC MT5
Evgeny Shevtsov
5 (1)
The indicator calculates volume profiles dynamically and displays the result as VAL, VAH and POC curves. Indicator features The indicator uses the historical data of the lower (relative to the current) timeframes for calculations: M1 - for timeframes up to H1, M5 - for timeframe H1, M15 - for timeframe H4, H1 - for timeframe D1, H4 - for timeframe W1, D1 - for timeframe MN. The color of the DPOC curve sections is determined by comparing the volume of the POC levels of all profiles that make u
Time And Sales Delta
Evgeny Shevtsov
5 (2)
The indicator displays the delta and the cumulative delta based on the "Time & Sales" deals list data. In addition to the standard timeframes, the indicator displays data regarding the seconds timeframes (S5, S10, S15, S20, S30) to choose from. Using the rectangle, user can select an arbitrary area in the indicator subwindow to view the ratio of the volumes of deals of buyers and sellers within this area. Indicator features: The indicator works correctly only on those trading symbols for whi
The indicator calculates volume profiles dynamically and displays the result as VAL, VAH and POC curves. Indicator features The indicator uses the historical data of the lower (relative to the current) timeframes for calculations: M1 - for timeframes up to H1, M5 - for timeframe H1, M15 - for timeframe H4, H1 - for timeframe D1, H4 - for timeframe W1, D1 - for timeframe MN. The color of the DPOC curve sections is determined by comparing the volume of the POC levels of all profiles that make up
Neural Predictor MT4
Evgeny Shevtsov
2 (1)
The indicator refers to the means of probabilistic analysis. Prediction is performed by the Monte Carlo method together with a mathematical model of a neuron. But, the modeling of samples for this method is made not artificially, but comes from the original "nature", that is, from history. The number of samples and the detail of their modeling is achieved using the lower (relative current) timeframe. Indicator algorithm : In general terms, the algorithm boils down to the fact that the ind
Market Marker MT5
Evgeny Shevtsov
3.8 (5)
The indicator displays peak levels of activity formed by the maximum volume, tracks the correlation of the candles on all timeframes (from the highest to the lowest one). Each volume level is a kind of key trading activity. The most important cluster is inside a month, week, day, hour, etc. Indicator operation features A volume level receives Demand status if the nearest volume level located to the left and above has been broken upwards. A volume level receives Supply status if the nearest vol
The utility refers to probabilistic analysis tools, in particular the Monte Carlo method. The Monte Carlo method is defined as the simulation of processes in purpose to evaluate their probabilistic characteristics and apply them to the solvable task. Operation features The simulation uses a tick model with the subsequent transformation to the candles form, as a model as close as possible to the real market process. The utility generates a stream of a random tick sequence until a result with t
The utility displays the order book, as well as increases its depth, remembering the location of applications that have gone beyond the current "window" view. With the utility user can perform quick trading actions in one click - placing/cancelling/editing of explicit and hidden orders, and also opening/editing positions. Utility features The orders book display works only on those trading symbols for which it is broadcast by the broker. To reset the information about the rows that were record
Filtro:
Rafal Krzysztof Manuszewski
2159
Rafal Krzysztof Manuszewski 2024.10.05 16:50 
 

ok

Francisco Gomes Da Silva
94603
Francisco Gomes Da Silva 2024.09.02 18:09 
 

El usuario no ha dejado ningún comentario para su valoración

uhhhjake
46
uhhhjake 2024.07.17 15:57 
 

Indicator is useful but it repaints even though the description explicitly states otherwise. If you use the supply and demand curves you can see the last 2 to 3 bars repainting on every candle. Especially if you are looking at transitions from buyer to sell control or vice versa. The histogram is the easiest to see this. A candle might close as one that had sellers in control then after the next candle close it will show buyers in control. Conceptually makes no sense. Would be fantastic if that aspect could be fixed considering if this inidicator was giving a true representation of buyer and seller volume those numbers would be fixed and not subject to repainting.

ThienGia
47
ThienGia 2024.06.12 15:41 
 

thanks u

Rodrigo De Paula
570
Rodrigo De Paula 2024.05.31 21:58 
 

Boa tarde! Aprecio bastante seu indicador e gostaria de testar o buffer no mode DemandAndSupplyRatio, mas não consigo encontrar ele para simular no testador de estratégias. Estou usando o seguinte código abaixo para testar e dá erros: "handleCumul=iCustom(_Symbol,_Period,"Market/Cumulative Delta MT5.ex5",5,0,0,0,0,0,0,9);" Poderia me ajudar, por favor?

Evgeny Shevtsov
70344
Respuesta del desarrollador Evgeny Shevtsov 2024.06.01 01:59
Olá.
A aba "Comentários" não se destina à condução de diálogos.
Repita sua pergunta na aba "Discussões" e então poderemos conversar.
Patrice Assi
78
Patrice Assi 2024.05.06 03:58 
 

Seems very good. Earl entry. Thank you

Cfu2021
14
Cfu2021 2024.03.04 22:35 
 

It looks like a good indicator, but it works on one minute chart only. Did I set correctly?

Evgeny Shevtsov
70344
Respuesta del desarrollador Evgeny Shevtsov 2024.03.05 05:46
Please duplicate your question on the "Comments" tab so that we can conduct a dialogue in the order of question-answer-question-answer ...
Yuriy Volkov
18
Yuriy Volkov 2024.01.22 09:29 
 

Здравствуйте. Очень хороший индикатор, то что нужно, к тому же бесплатный. Но сегодня после обновления терминала, перестал работать, по всем инструментам и таймфреймам, пробовал "баловаться" настройками, ничего не меняется, не пойму почему...??? Подскажите, плиз.Показывает как на скринах https://drive.google.com/file/d/1lPjr_A-F2xWsFDJCtX93Z2XQ_Q8xZIsz/view?usp=sharing, https://drive.google.com/file/d/1w4JtNCObuhqO1cSZlbGudn4hq-gi_N6l/view?usp=sharing https://drive.google.com/file/d/1w4JtNCObuhqO1cSZlbGudn4hq-gi_N6l/view?usp=drive_link

Evgeny Shevtsov
70344
Respuesta del desarrollador Evgeny Shevtsov 2024.01.22 09:34
Здравствуйте.
Проблема не только у Вас и не только этому индикатору - пока что ожидайте.
Поскольку вкладка "Отзывы" не предназначена (не подразумевает) ведение диалогов, то вопросы лучше задавать на вкладке "Обсуждение", ну или мне лично.
Igor Vnk
71
Igor Vnk 2023.12.23 13:54 
 

Евгений, добрый день! Большое спасибо за Вашу работу. Применяю Ваш индикатор в стратегии внутридневной торговли наиболее ликвидными акциями на MOEX. В стратегии используется режим Delta и появление (закрытие) ReversBar. Очень было бы полезно внести в индикатор Alert (push, звук) на событие -"закрытие ReversBar" с учетом знака. Заранее спасибо.

4280
14
4280 2023.11.21 21:36 
 

buenas muchas gracias en principio por el desarrollo de indicadores de esta clase... en mi experiencia complementa a mi analisis diario pero hace unos dias estoy teniendo inconvenientes con la visualizacion del mismo ya que no se genera en temporalidades mayores a la de 1 minuto, esto ocurre en activos de futuros como lo son el MES y el MGC micros. no ocurre lo mismo en MCL por ejemplo.

Evgeny Shevtsov
70344
Respuesta del desarrollador Evgeny Shevtsov 2023.11.22 10:43
Hola.
El hecho es que la pestaña "Reseñas" no es adecuada para mantener diálogos según el principio pregunta/respuesta/pregunta/respuesta, etc.
Si tiene alguna pregunta o algún problema que requiera comunicarse con el desarrollador (es decir, yo), escríbame un mensaje (personal o en la pestaña "Comentarios").
Oleos
29
Oleos 2023.10.23 18:17 
 

Хотелось бы видеть столбцы гистограммы отдельно, т.е. чередуясь, а не в одном столбце покупки и продажи. Может быть такая функция есть в настройках, но я не увидел.

Имелось ввиду, если большее кол-во продавцов, то один красный столбец ВНИЗ, на разницу. Если больше бло покупателей - один зеленый столбец вверх и так чередуясь.

Evgeny Shevtsov
70344
Respuesta del desarrollador Evgeny Shevtsov 2023.10.23 18:40
Честно говоря, я не понял, что значит "в одном столбце покупки и продажи".
Но, тем не менее, там есть входная переменная DsDrawing, и возможно именно это Вы и имели ввиду.
Лобчевский Алексеевич
40
 

К сожалению нет пользы.Автор может спорить,но я сомневаюсь что автор может на примере показать как он благодаря индикатору выполняет прибыльные селки.

Evgeny Shevtsov
70344
Respuesta del desarrollador Evgeny Shevtsov 2023.08.17 22:16
Автор (то есть я) не занимается трейдингом, и нисколько не стесняется об этом говорить.
Но, скажем так, моя квалификация достаточна, чтобы я мог создать продукты, которые имеются на моей витрине.
))
joseverasay
284
joseverasay 2023.06.29 03:11 
 

Muy útil gracias

flavio85 Santos
36
flavio85 Santos 2023.05.21 21:50 
 

funciona muito bem e com diversas formas de visualização

agjunior
14
agjunior 2023.04.27 03:27 
 

the best indicator i've seen here, very useful

dmlopes
31
dmlopes 2023.04.10 12:50 
 

Very good indicator. It helps you to evaluate and understand the market movements.

Igor Ronchi
69
Igor Ronchi 2023.01.24 10:19 
 

I loved that indicator, Can you send me how you calc the volume of buy and sell ?

Evgeny Shevtsov
70344
Respuesta del desarrollador Evgeny Shevtsov 2023.01.24 11:35
Hello.
See my message number #280 of 08.01.2023.
It is written in Russian, but I think this is not a problem, there is a translator there.
spongehack
44
spongehack 2022.11.17 19:35 
 

Ótima ferramenta para acompanhar os movimentos de grandes volumes de mercado, tanto de venda e de compra...Parabéns

rsanchesb
14
rsanchesb 2022.11.12 18:52 
 

I am receiving error: 2022.11.12 14:49:39.849 Custom Indicator loading of Cumulative Delta MT5 (ITUB4_4TICKS,M1) from C:\Users\rsanc\AppData\Roaming\MetaQuotes\Terminal\xxxxxx\MQL5\Indicators\Market\Cumulative Delta MT5.ex5 failed [538] 2022.11.12 14:49:39.849 Cumulative Delta MT5 invalid license (538) How come is it showing 'invalid licence" if its written as FREE indicator ???

Franklin Delano
97
Franklin Delano 2022.09.15 19:40 
 

Excelente indicador. Mostra o real movimento de compras e vendas.

Respuesta al comentario
Versión 3.5 2024.04.18
A new mode “InCandles” has been added to the list of modes of the input variable “HistoryLoadMode”, in which the duration of the history is set by the number of candles.
The number of candles, in turn, is set via the input variable “HistoryCandles” (if the value is zero, the number of candles is counted from the left side of the chart window).
Versión 3.4 2024.01.27
The new input variable "PriceCurveWithCumDelta" turns on/off the display of the price curve in the cumulative delta display mode.
The indicator is compiled in MT5 build 4153.
Versión 3.3 2023.11.03
Two new modes have been added to the list of modes of the input variable "CumDeltaDrawing" :
- "AsHistogramOfDiffWithPrice",
- "AsColoredHistogramOfDiffWithPrice",
which displays the difference between the cumdelta curve and the price curve.
Versión 3.2 2023.05.22
The input variable “HistoryLoadMode”, as a drop-down menu, sets the history loading mode in several options:

1. “FromSpecifiedTime” - by the start date/time specified in the input variable “HistoryStartTime”.
2. “InMonths” - by the number of months (from the beginning of the month) specified in the input variable “HistoryMonths” (value 0 means from the beginning of the current month).
3. “InWeeks” - by the number of weeks (from the beginning of the week) specified in the input variable “HistoryWeeks” (value 0 means from the beginning of the current week).
4. “InDays” - by the number of days (from the beginning of the day) specified in the input variable “HistoryDays” (value 0 means from the beginning of the current day).
5. “InHours” - by the number of hours (from the beginning of the hour) specified in the input variable “HistoryHours” (value 0 means from the beginning of the current hour).

With the advent of the input variable “HistoryLoadMode”, the input variable “BarsLimit” have been abolished as unnecessary.

When calling the indicator from outside, use the input variable “RecalculationTiming” with a negative value (any value), which specify to the indicator that it was called from outside.
Versión 3.1 2022.11.30
The indicator is recompiled in MT5 build 3521.
Versión 3.0 2022.08.20
The new "Relative volume" mode has been added to the list of modes of the input variable "Mode".
To control this mode, the input variable "RvPeriod" has been additionally created, which sets the calculation period.
Versión 2.9 2022.05.29
In this version, an attempt has been made to eliminate the error "cannot set millisecond timer” that occurs when the indicator is called from the outside.

A new input variable “Timing” has also been added, which sets the frequency of recalculation in milliseconds.
When calling the indicator from outside (from another indicator or from EA), the value of this input variable must be set to zero.

The indicator is compiled in MT5 build 3311.
Versión 2.8 2022.05.10
The indicator is recompiled in MT5 build 3285.
Versión 2.7 2022.04.12
The input variable Volumes has been renamed to VolumesType.

The new input variable VolumesMode switches the method of decomposition of candles volumes into buyers and sellers volumes :
- All - the whole volume is involved in decomposition.
- Active - only the volume that produced the movement is involved in decomposition.

The indicator is compiled in MT5 build 3249.
Versión 2.6 2021.09.23
The indicator is recompiled in MT5 build 3041.
Versión 2.5 2021.04.17
A new DemandAndSupplyDifference mode has been added to the list of modes of the input Mode variable, which displays the difference between the DemandAndSupply curves.
A new AsColoredHistogram mode has been added to the list of modes of the input variable CumDeltaDrawing, where the values of the histogram columns above and below zero are displayed in different colors.
The indicator is compiled in MT5 build 2875.
Versión 2.4 2020.12.08
The input variable CumDeltaDrawing switches the way the cumulative delta is displayed - either as a curve or as a histogram.
The indicator is compiled in MT5 build 2715.
Versión 2.3 2020.12.03
The indicator is recompiled in MT5 build 2715.
Versión 2.2 2020.10.20
The indicator is recompiled in MT5 build 2650.
Versión 2.1 2020.08.17
Displaying the values of the demand and supply curves in Mode=DemandAndSupply is converted to percentages. The 100% reference value is the largest value of the demand curve (or supply curve), that is located on the right-to-left side of the last candle and up to the left border of the chart window, or that is located on the right-to-left side of the last candle and the amount specified in the input variable BarsLimit.

A full recalculation (in any mode) the indicator still performs once a minute, at the moment when a new candle appears on the M1 timeframe, and regardless of which timeframe is selected in the input variable Timeframe.
Versión 2.0 2020.08.02
Using the input variable Timeframe, user can select the timeframe that the indicator will work with directly, which allows to place multiple instances of the indicator in the same chart window, but with results from different timeframes displayed.
Using the input variable DsSmoothing user can enable or disable curves smoothing for the DemandAndSupply and DemandAndSupplyRatio modes.
Using the input variable DsPeriod user can set the period (if the value is zero, the period is assigned automatically) for calculating curves for the DemandAndSupply and DemandAndSupplyRatio modes.
Versión 1.9 2020.07.12
The indicator is recompiled in MT5 build 2530.
Versión 1.8 2019.07.14
Added a new feature DemandAndSupplyRatio that displays the ratio between demand and supply curves.
Versión 1.7 2019.03.28
The function of tint the reverse bar is now also work in Delta mode.
Versión 1.6 2018.12.14
In the mode Delta there are two display options that can be selected using the optional input variable DeltaDrawing:
UpOnly - the columns of the histogram are directed only upwards, regardless of the delta sign.
UpAndDown - the columns of the histogram are directed depending on the delta sign.
Versión 1.5 2018.11.13
Added alerts for modes Delta, BuyAndSellVolumes, DemandAndSupply.
Alerts are triggered when the levels AlertLevelForDemand and AlertLevelForSupply are reached by the value on the current candle.
Versión 1.4 2017.12.27
Fixed calculation of cumulative volume period in the DemandAndSupply mode for financial symbols having an additional short trading day.
Versión 1.3 2017.06.23
Added new DemandAndSupply mode, which is displayed as a demand and supply diagram with two lines.
The green line shows demand, the red line shows supply.
The mode can be additionally managed using the DsContrast input variable:
DsContrast = 0 - no candlestick coloring,
DsContrast > 1 - coloring candlesticks,
DsContrast < -1 - reverse coloring.
Versión 1.2 2017.04.14
No significant changes have been made. The indicator code has been slightly optimized in order to reduce the number of excessive cyclic calculations and, as a consequence, to reduce the load on the terminal.
Versión 1.1 2017.03.28
In the CumDelta, CumDeltaDaily and CumDeltaWeekly modes, a price line based on Close prices of candles is scaled and displayed in the indicator window, in parallel with the cumulative delta line.