Linear Regression Angle
- Indicadores
- Vladimir Komov
- Versión: 2.0
- Actualizado: 28 noviembre 2021
- Activaciones: 5
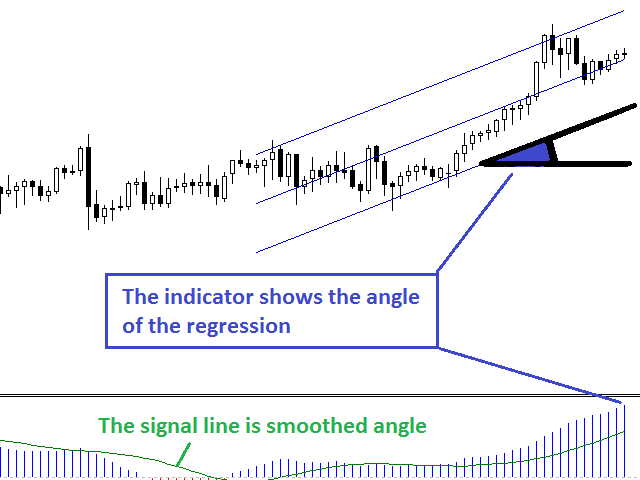
Linear Regression Angle is a directional movement indicator which defines a trend at the moment of its birth, and additionally defines trend weakening. The indicator calculates the angle of the linear regression channel and displays it in a separate window in the form of histogram. The signal line is a simple average of the angle.
The angle is the difference between the right and left edges of regression (in points), divided by its period.
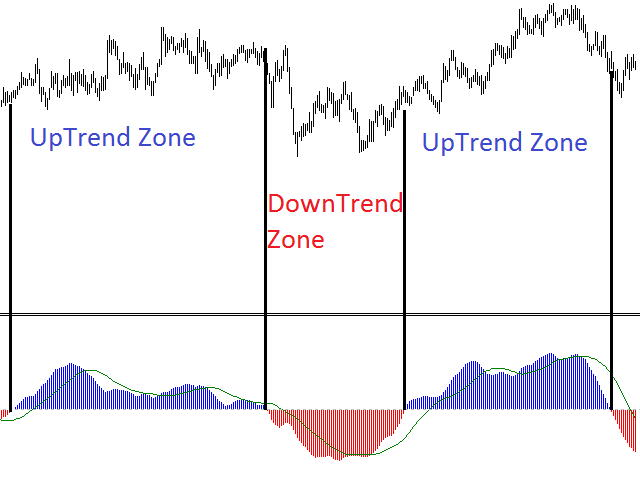
The angle value above 0 indicates an uptrend. The higher the value, the stronger the trend. A value below 0 indicates a downtrend. The lower the value, the stronger the downtrend.
Benefits
- Stable trend recognition from its emergence up to the completion.
- Defining areas where the trend is weakening, and areas where the directional movement is resumed.
- It works on any instrument.
- It works on all timeframes.
- No repaints, no recalculation.
Parameters
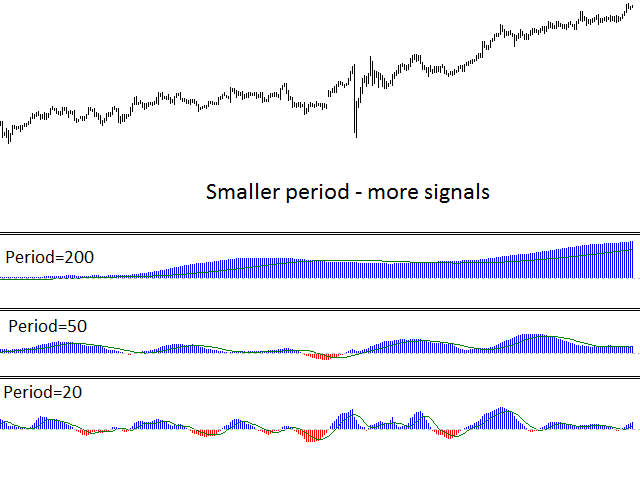
- Regression Period - linear regression calculation period. The longer the period, the more stable it is, but the longer the delay is.
- SmoothPeriod - smoothing period.
Use
Linear Regression Angle can be used in several ways.
- As a trend indication: if the histogram is positive, the trend is growing, a negative value is a signe of a downtrend.
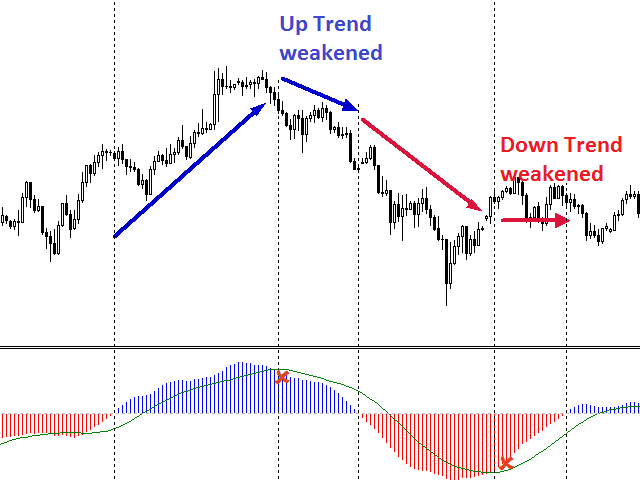
- To assess the trend strength: when the histogram is positive and above its signal line value - the uptrend is gaining momentum. If the histogram is below the signal line, but is greater than zero, the uptrend is weakening. When the histogram is negative and its value is below the signal line - the downtrend is gaining momentum. If the histogram is above the signal line, but is below zero, the downward trend is weakening.
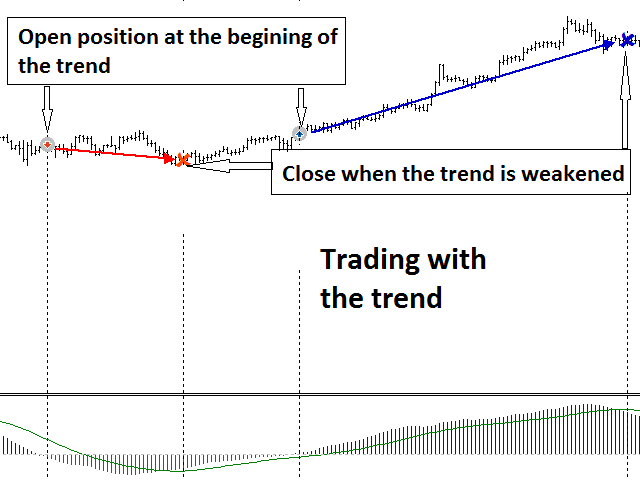
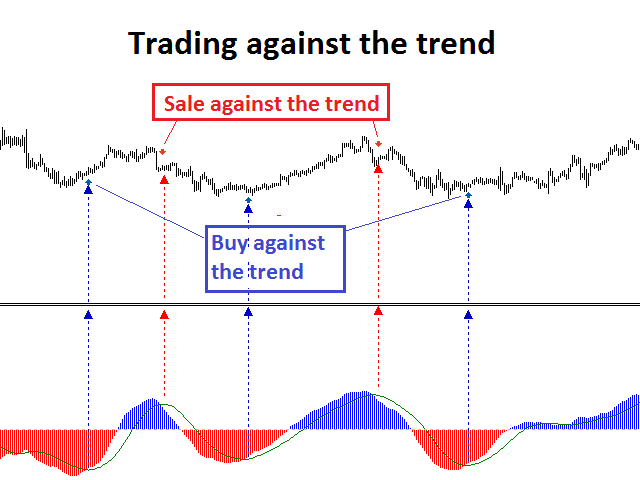
- For signal generation: trend following buy/sell when the histogram crosses the zero level; buying against the downtrend at the intersection of the signal line from the bottom up in the red zone, also in this case this is a signal to close a short position; selling against the uptrend at the intersection of the signal line from top to bottom with the uptrend, also in this is a signal to close a long position.
Features
The smaller the Regression Period value, the more often the indicator will produce trend change signals.
The smaller the smoothing period SmoothPeriod, the more often the indicator will generate trens weakening signals.
Limit: SmoothPeriod < Regression Period.

