Forex Dead Line
- Indicadores
- Mikhail Kontsevoy
- Versión: 1.1
- Actualizado: 17 noviembre 2021
- Activaciones: 5
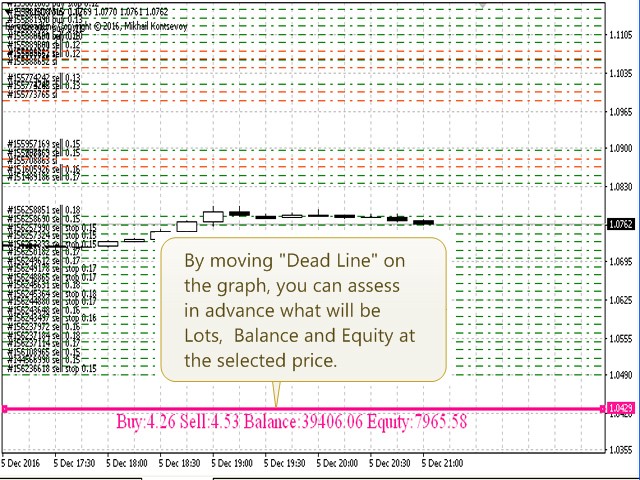
The indicator can help traders to assess in advance the number of Lots, Balance and Equity, if the price deviates from the current levels. The indicator will be useful for those who trade using grid strategies or Martingale.
Features
The indicator belongs to the category of risk management. It will be useful for the traders who usually have a lot of open orders on one instrument. The indicator helps to assess in advance the account change that would happen in case of possible price change from the current value to a threshold. It also recalculates swap, lock, pending orders, take profit and stop loss. The indicator works on all timeframes and currency pairs. The indicator automatically recalculates account parameters based in case new orders could appear on a selected level.
Note:
- The indicator assesses the state of the account only connected with one selected symbol.
- The calculation results are approximate, if the account deposit currency is not included in the currency pair on which the indicator is running.
Parameters
- clr - the color of the text and of "Dead Line".
- style - the style of the "Dead Line".
- width - the width of the "Dead Line".
- font_size - font size.
- suffix - additional symbol. Some brokers may use suffixes for symbol names (eg, EURUSDm)