Elastic Stretched mt5
- Indicadores
- Enrico Mariani
- Versión: 1.0
- Activaciones: 5
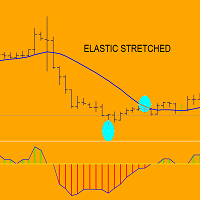
Think to an elastic: when you stretched it and then you release…it returns to its state of rest.
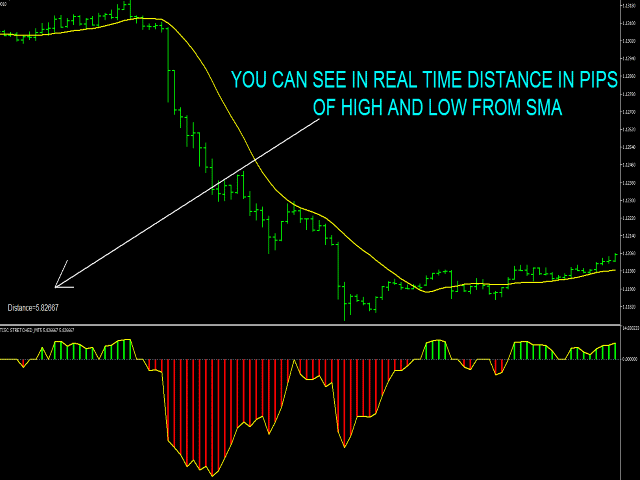
ELASTIC STRETCHED indicator display in real time distance of any bar:when price is above sma,indicator diplay distance in pips of HIGH from sma....when price is below sma,indicator display distance in pips of LOW from sma.
When price goes far from its sma during (for example) downtrend ,can happen two things: A) price returns to sma (reaction) and goes up OR B) price goes in trading range....but in any case price does not down!
I like also MULTI TIME FRAME...so..in order to trading with very low risk we must do the following:
open higher time frame and see in history the elastic band (for example 1H chart)
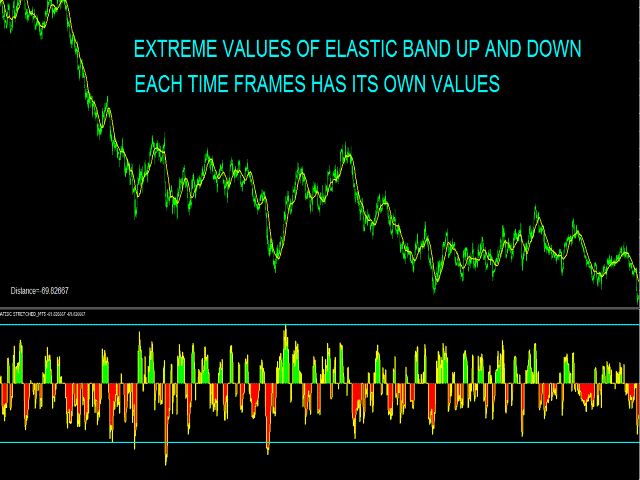
you must draw one to three orizontal lines where there are extreme values (go to indicator input LEVELS and write extreme values)
first alert (example) downtrend: price touches extreme values
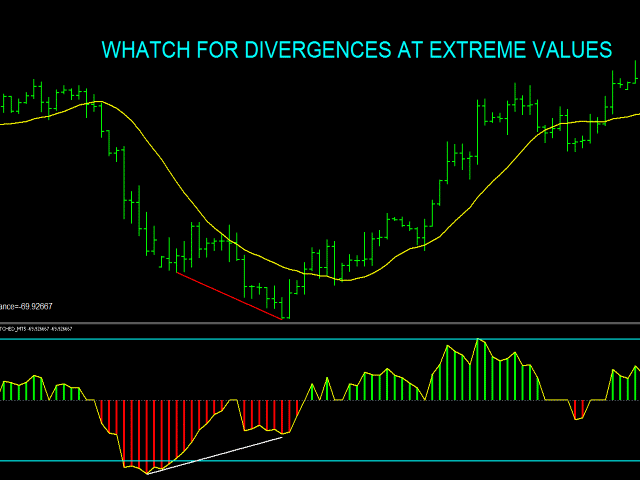
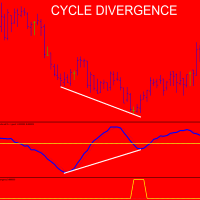
second alert: divergence of price and indicator on 1H chart (price goes down BUT indicator goes up)
after and only after these two important conditions we open lower time frame (for example 5 min chart) and see for:
1) extreme values and another divergence on lower time frame
OR
2) price pattern such as 123 high/low or stocastic divergence or divergence of your favorite indicator.
Why we need pattern confirmation or double elastic stretched on higher/lower time frame? because price may be goes down/up for long time during downtrend/uptrend...so we need good probability for inversion of price that returns on its sma.
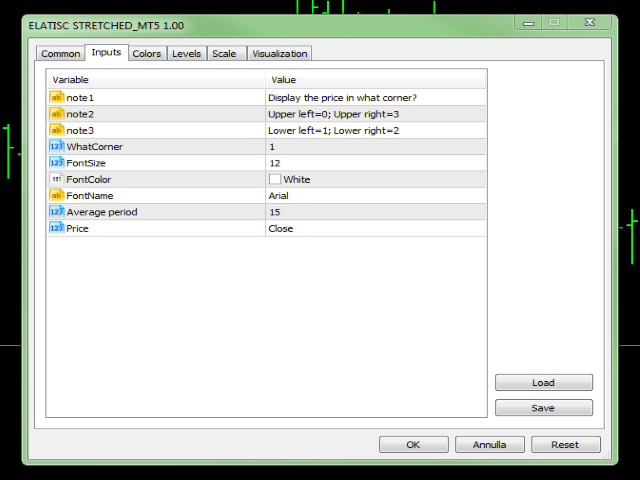
I use 15 sma or 21 sma on every time frame but you can use/select what you want in input window.
You can select also in which corner display distance in pips:
Upper left=0; Lower left=1; Lower right=2 ; Upper right=3
