FiboPlusTrend MT5
- Indicadores
- Sergey Malysh
- Versión: 2.1
- Actualizado: 27 junio 2017
- Activaciones: 5
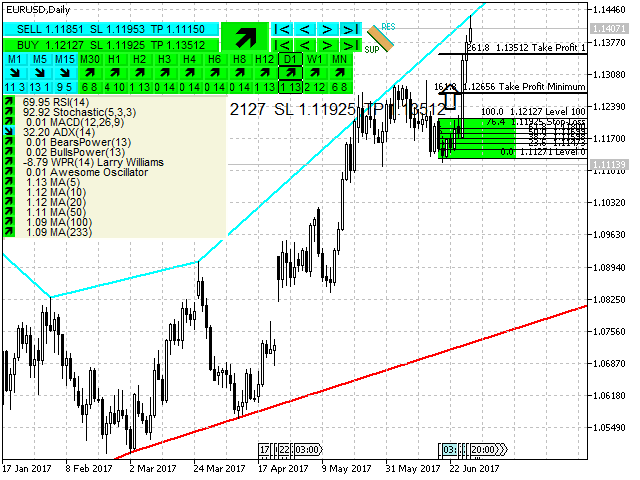
La generación y acompañamiento automáticos de los niveles de Fibonacci para la venta y la compra con respecto a cuaquier instrumento (símbolo) y en cualquier período del gráfico.
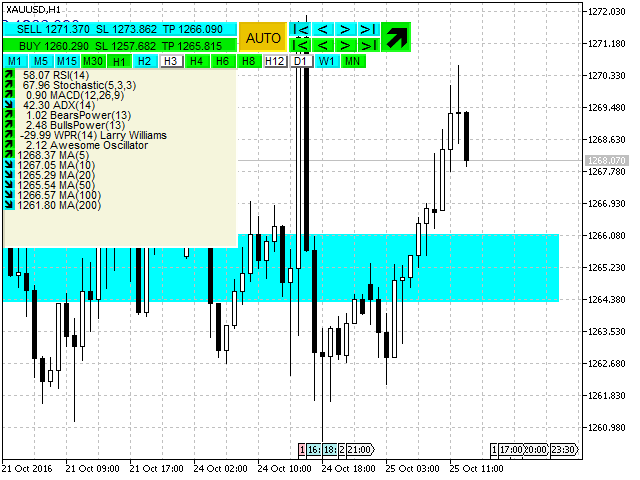
FiboPlusTrend demuestra:
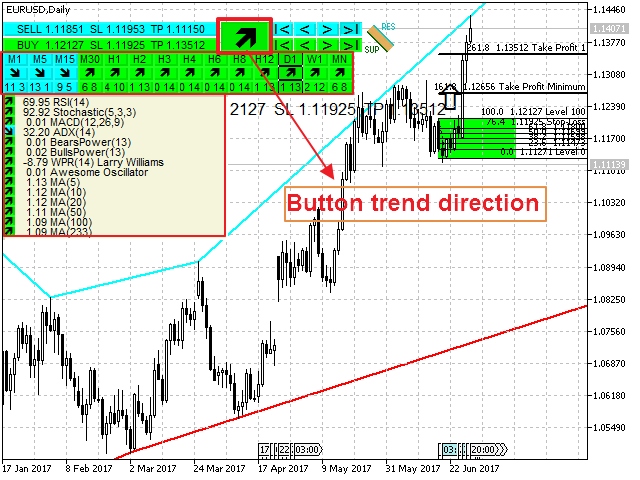
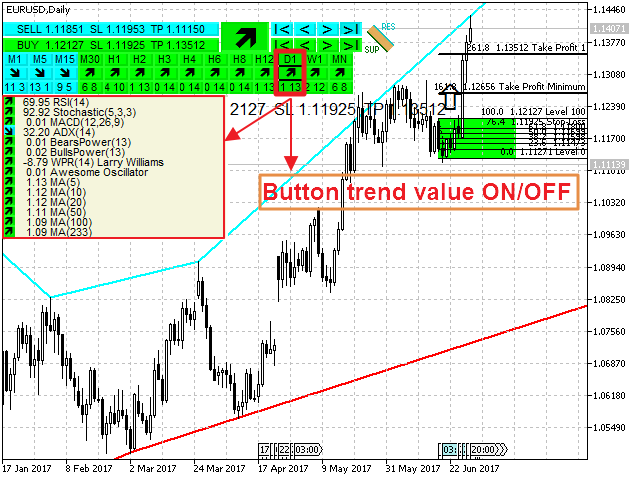
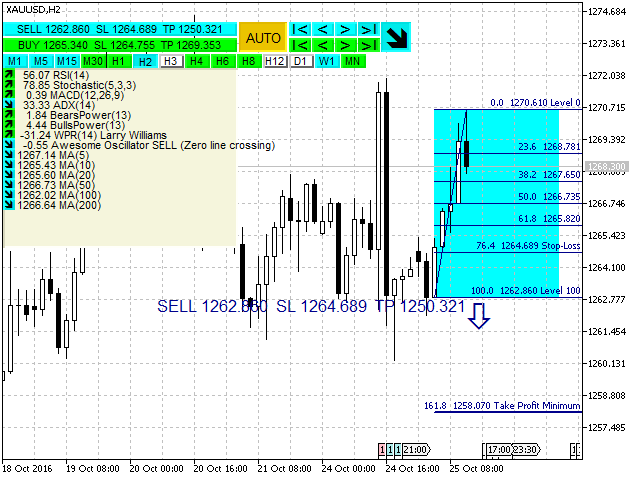
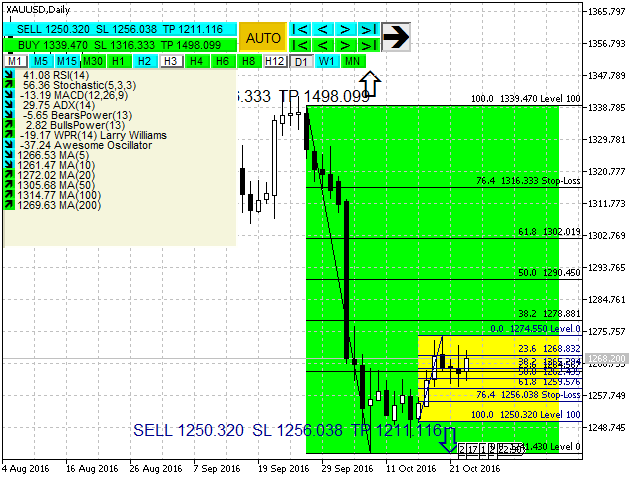
- la tendencia en todos los marcos de tiempo y los valores indicadores.
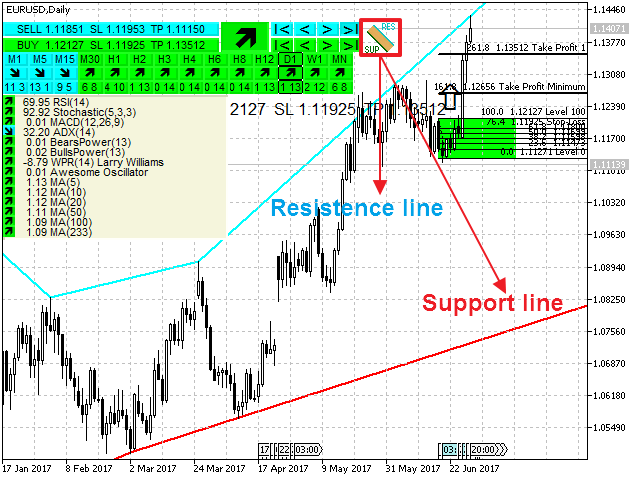
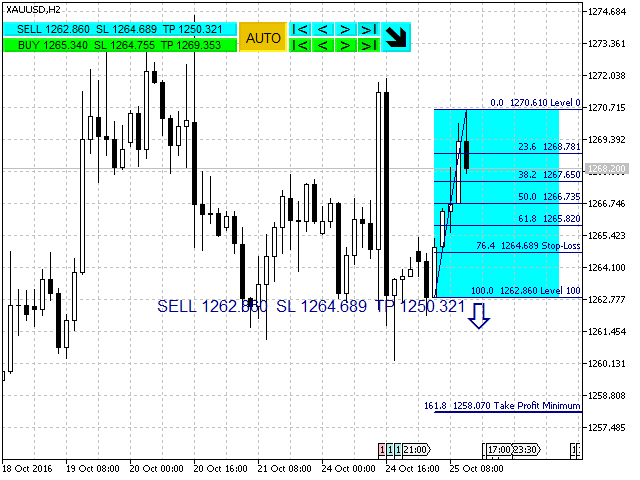
- los niveles de Fibonacci de movimientos probables del precio hacia arriba o hacia abajo.
- los puntos de entrada están marcados con íconos “flecha arriba”, “flecha abajo”, la información está doblada con botones SELL, BUY.
- área rectangular está limitada por los niveles de 0 a 100. El comercio de un nivel a otro (no hay tendencia).
Características
- cálculo de la tendencia de los indicadores (RSI, Stochastic, MACD, ADX, BearsPower, BullsPower, WPR, AO, MA - 5, 10, 20, 50, 100, 200).
- pronóstico del movimiento del precio, punto de entrada en el mercado, stop loss y take profit para órdenes.
- sistema de comercio hecho.
- los botones de control permiten elegir una de las opciones de Fibonacci.
- ocultar la opción de venta o de compra.
- ver otros períodos del gráfico.
- las teclas “+” “-“ aumentan, disminuyen el gráfico, calculando auntomáticamente los niveles.
- cualesquiera niveles de Fibonacci.
- cualquier solución de colores.
- traslado de botones a un lugar cómodo en el gráfico.
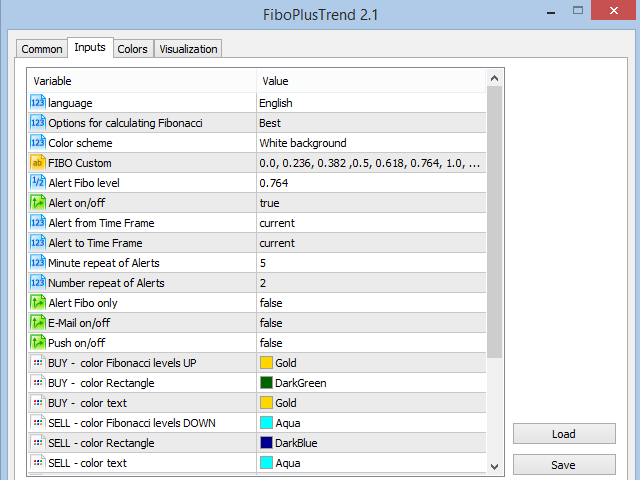
Parámetros
- Language (Russian, English, Deutsch, Espanol, Portugues)
- Opciones de la superposición de los niveles de Fibonacci:
- Best - según las velas del mismo color hasta la primera vela de color contrario,
- Standard - generación de estándar,
- debt of flow - deuda de flujo del Market Maker obtenida al activar las deformaciones serias del mercado
- Esquema de colores (colores preestablecidos):
- White background - para el fono blanco.
- Black background - para el fono negro
- Custom background - configuraciones de usuario de todos los colores.
- FIBO Custom (significado de los niveles separados con «,»)
- customcolors: configuraciones de usuario de colores
- coordinatesX, Y buttons to snap pixels (coordenadas Х, Y para atar los botones al gráfico)
Botones
- SELL. Opción de entrada en el mercado para la venta. Presionando el botón SELL, ocultará/verá los niveles de Fibonacci para la venta.
- |< La primera opción de entrada en el mercado para la venta.
- < La opción anterior de entrada en el mercado para la venta.
- > La opción siguiente de entrada en el mercado para la venta.
- >| La última opción de entrada en el mercado para la venta + acompañamiento automático.
- BUY. Opción de entrada en el mercado para la compra. Presionando el botón BUY, ocultará/verá los niveles de Fibonacci para la compra.
- |< La primera opción de entrada en el mercado para la compra.
- < La opción anterior de entrada en el mercado para la compra.
- > La opción siguiente de entrada en el mercado para la compra.
- >| La última opción de entrada en el mercado para la compra+ acompañamiento automático.
- AUTO. Cálculo y acompañamiento automáticos en el mercado de los niveles nuevos de Fibonacci para la compra y venta.
- La imagen de la tendencia actual. Al pulsar los cueros / muestra la tendencia en todos los plazos
-
M1, M5, M15, M30, H1, H2, H3, H4, H6, H8, H12, D1, W1, MN. Los valores de botones deseados indicadores marco temporal.
Sistema de comercio sobre la base del indicador FiboPlusTrend
- Venta. La vela se cerró más bajo del nivel 100, stop loss - más alto del nivel 76.4, take profit minimum 161.8, take profit 1 - 261.8, take profit 2 - 423.6.
- Compra. La vela se cerró por arriba del nivel 100, stop loss - más bajo del nivel 76.4, take profit minimum 161.8, take profit 1 - 261.8, take profit 2 - 423.6.
- Compra/Venta en el área rectangular limitada con los niveles de 0 a 100. El comercio de un nivel a otro (no hay tendencia).
- Opción "debt of flow". FiboPlusTrend
genera los niveles "debt of flow" del Market Maker, el precio con una probabilidad considerable volverá a estos niveles.
El comercio del nivel 100 al take profit 1 - 50, take profit 2 - 33. La segunda opción del trabajo, la instalación de órdenes de límite en los niveles del 50% y del 33% según la tendencia.
Se recomienda a renovar los datos (presionando sucesivamente los períodos M1, M5, M15, M30, H1, H2, H3, H4, H6, H8, H12, D1, W1, MN) antes de utilizar el indicador en el gráfico corriente del instrumento.


Hi,
I am still new to trading so I would be grateful if you could tell me how I should decide whether to take the Buy or Sell trade...because both are coming up on the chart with their own SL and TP levels...thanks...Samit