Easy RR Monitor Panel
- Utilidades
- Wang Yu
- Versión: 1.1
- Actualizado: 21 noviembre 2021
- Activaciones: 5
如果产品有任何问题或者您需要在此产品上添加功能,请联系我
Contact/message me if you encounter any issue using the product or need extra feature to add on the base version.
There are two critical components in a profitable trading system. One is entry (placing an order) and another one is exit (closing an order). You can exit by time: closing order after London Close, for example. You can also exit by position: closing an order when price reaches a certain support/resistance level.
Easy RR Monitor Panel is an intuitive, and handy graphical tool to help you to:
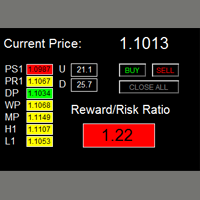
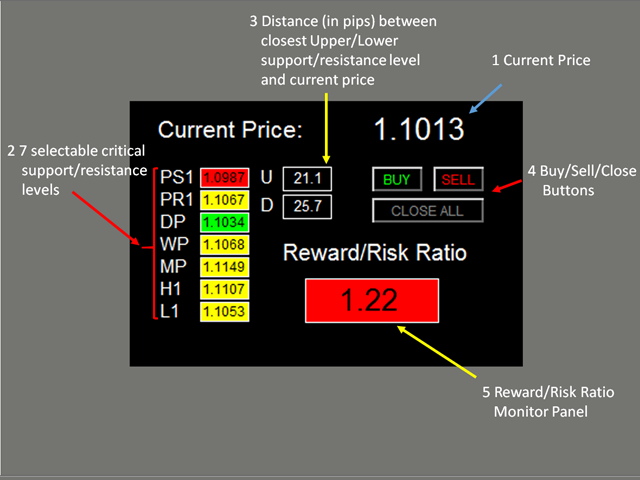
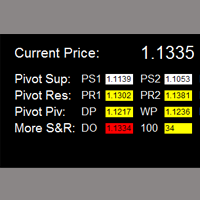
- Locate and highlight the closest upper and lower support/resistance level (among the seven critical support/resistance levels, which are pivot S1, pivot R1, daily pivot, weekly pivot, monthly pivot, previous daily high and previous daily low) to the current price. See the screenshot.
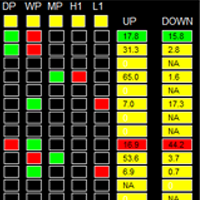
- Find the profitable RR ratio entry level with highlight by calculating and comparing the distance between the upper level closest to the current price and distance between the lower level closest to the current price. See the screenshot.
- Click the buy/sell button to place buy and/or sell order with TP and SL set at the above level, which gives you a good RR ratio.
Features
- Users are able to select support and resistance levels for RR ratio generating
- Adjustable indicator panel position
Inputs
- Magic Number
- Lot Size
- Use Pivot Support
- Use pivot support for RR ratio calculation
- Same rule applied to the following six support/resistance levels
- Use Pivot Resistance
- Use Daily Pivot
- Use Weekly Pivot
- Use Monthly Pivot
- Use Previous Daily High
- Use Previous Daily Low
- X_axis: dashboard x position
- Y_axis: dashboard y position
Dashboard Objects
See the screenshot:
- Current Price
- Seven selectable critical support/resistance levels: a) selected levels will be repainted to be yellow; non-selected levels will be repainted to be white; b) the closest upper level will be repainted to be green; the closest lower level will be repainted to be red
- Pivot S1
- Pivot R1
- Daily Pivot
- Weekly Pivot
- Monthly Pivot
- Previous Daily High
- Previous Daily Low
- Distance (in pips) between the closest Upper/Lower support/resistance level and the current price
- If the price goes beyond above all selected levels, 'U' cell will display 'NA'
- If the price goes beyond below all selected levels, 'D' cell will display 'NA'
- Buy/Sell/Close buttons:
- Click buy/sell button to place buy and/or sell order with TP and SL set at the above level
- Click close button to close all orders with the magic number used in this EA
- Reward/Risk Ratio Panel
- Number indicates the Reward/Risk Ratio. If the price goes beyond above/below all selected levels, the panel displays 'NA'
- If (current price - closest lower level) > (closest upper level - current price), the panel will be repainted to be red
- If (closest upper level - current price) > (current price - closest lower level), the panel will be repainted to be green
The demo version of the product is available here.
If you have any customized request and/or suggestion, please feedback to me.
