• Información general
  • Comentarios (17)
  • Discusión (91)
  • Novedades

MIDAS Trading Tools

4.67

The introduction of the MIDAS Trading Tools indicator represents the culmination of my trading expertise and innovative application. By incorporating new concepts and collaborating with fellow traders like Robert Young (US), we have enriched and enhanced this indicator. In the sections below, you'll find detailed descriptions of the variables comprising this indicator.

MIDAS which is an acronym for Market Interpretation/Data Analysis System is the innovative work of the late technical analyst Paul Levine. Levine strongly believed that the dynamic interplay of support and resistance and accumulation and distribution are the ultimate determinants of price behavior. After examining and rejecting all of the standard technical analysis techniques for determining support and resistance, he came up with a new approach - MIDAS!

MIDAS Trading Tools consists of two standalone indicators tailored for different market environments:

1. MIDAS Support/Resistance Curves: Unveils potent support and resistance levels while providing a method to assess the relative strength of a prevailing trend.
2. MIDAS Top-Bottom Finder Algorithm: Monitors the available "fuel" within an accelerating trend to anticipate potential tops or bottoms based on cumulative volume.

Basic Strategy & Concept

1. Identify a trend in any market.
2. Attach MIDAS Trading Tools to your chart.

3. Click on the red vertical line and drag it to a recommended anchor point ◆.
4. Activate the Buy/Sell Alert System by clicking the circled button in the top right corner. White = OFF / Blue = ON.
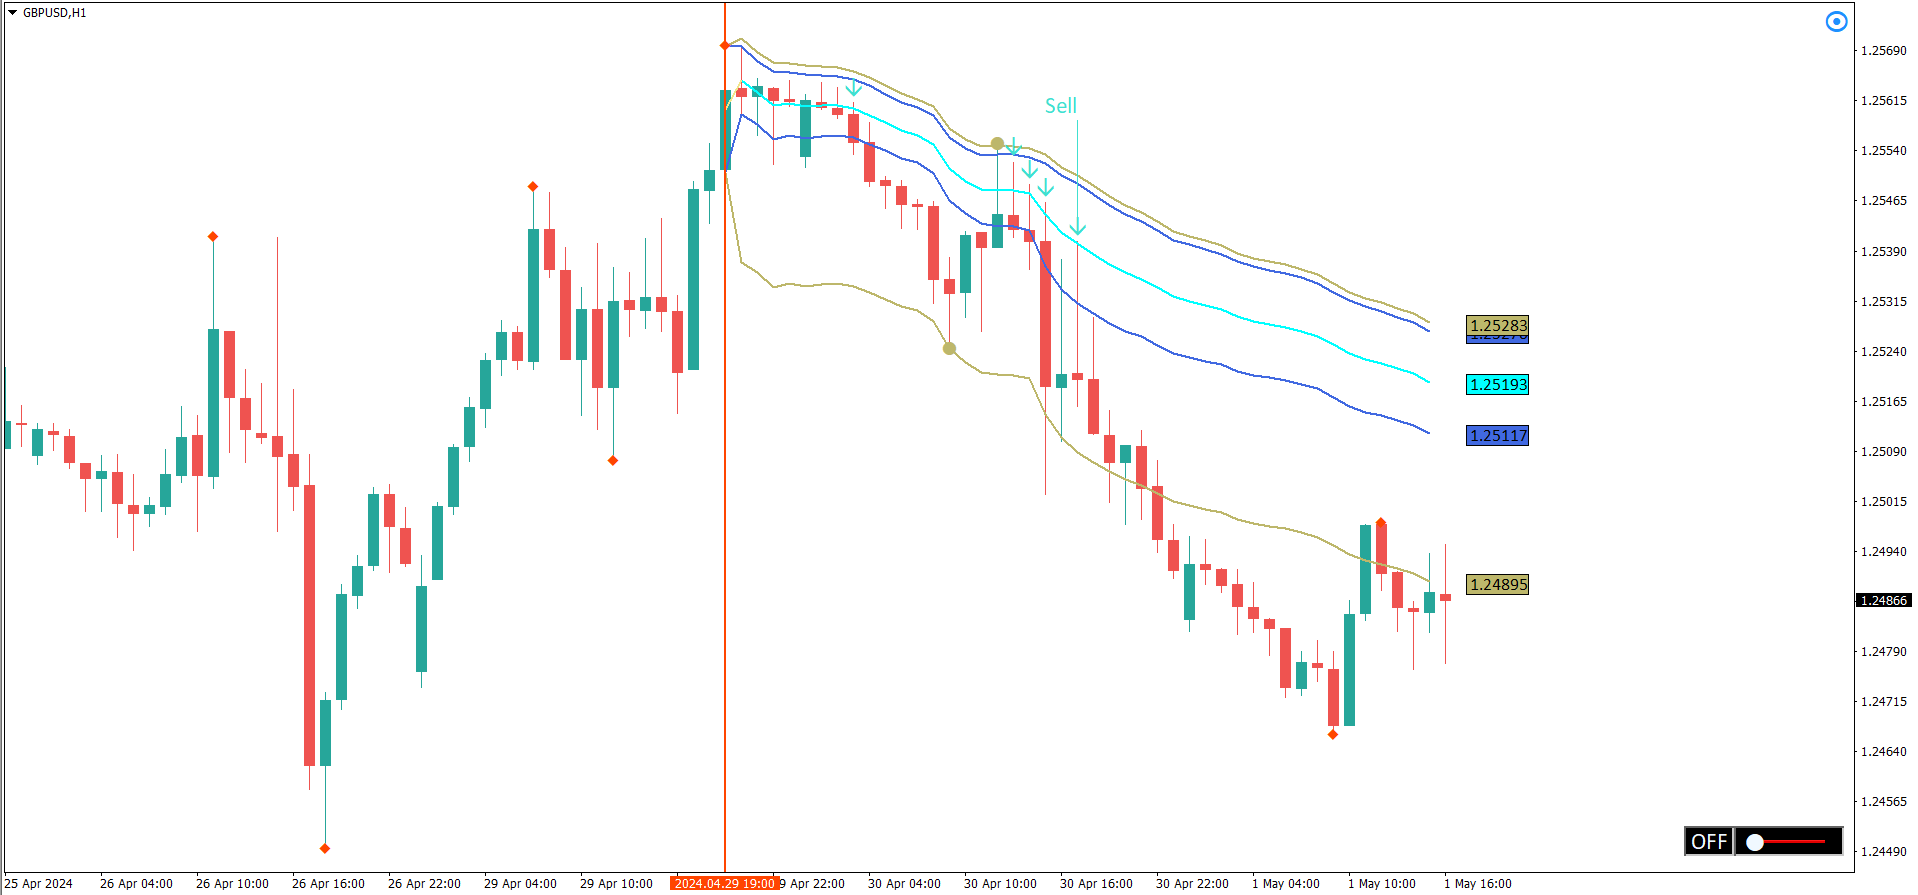
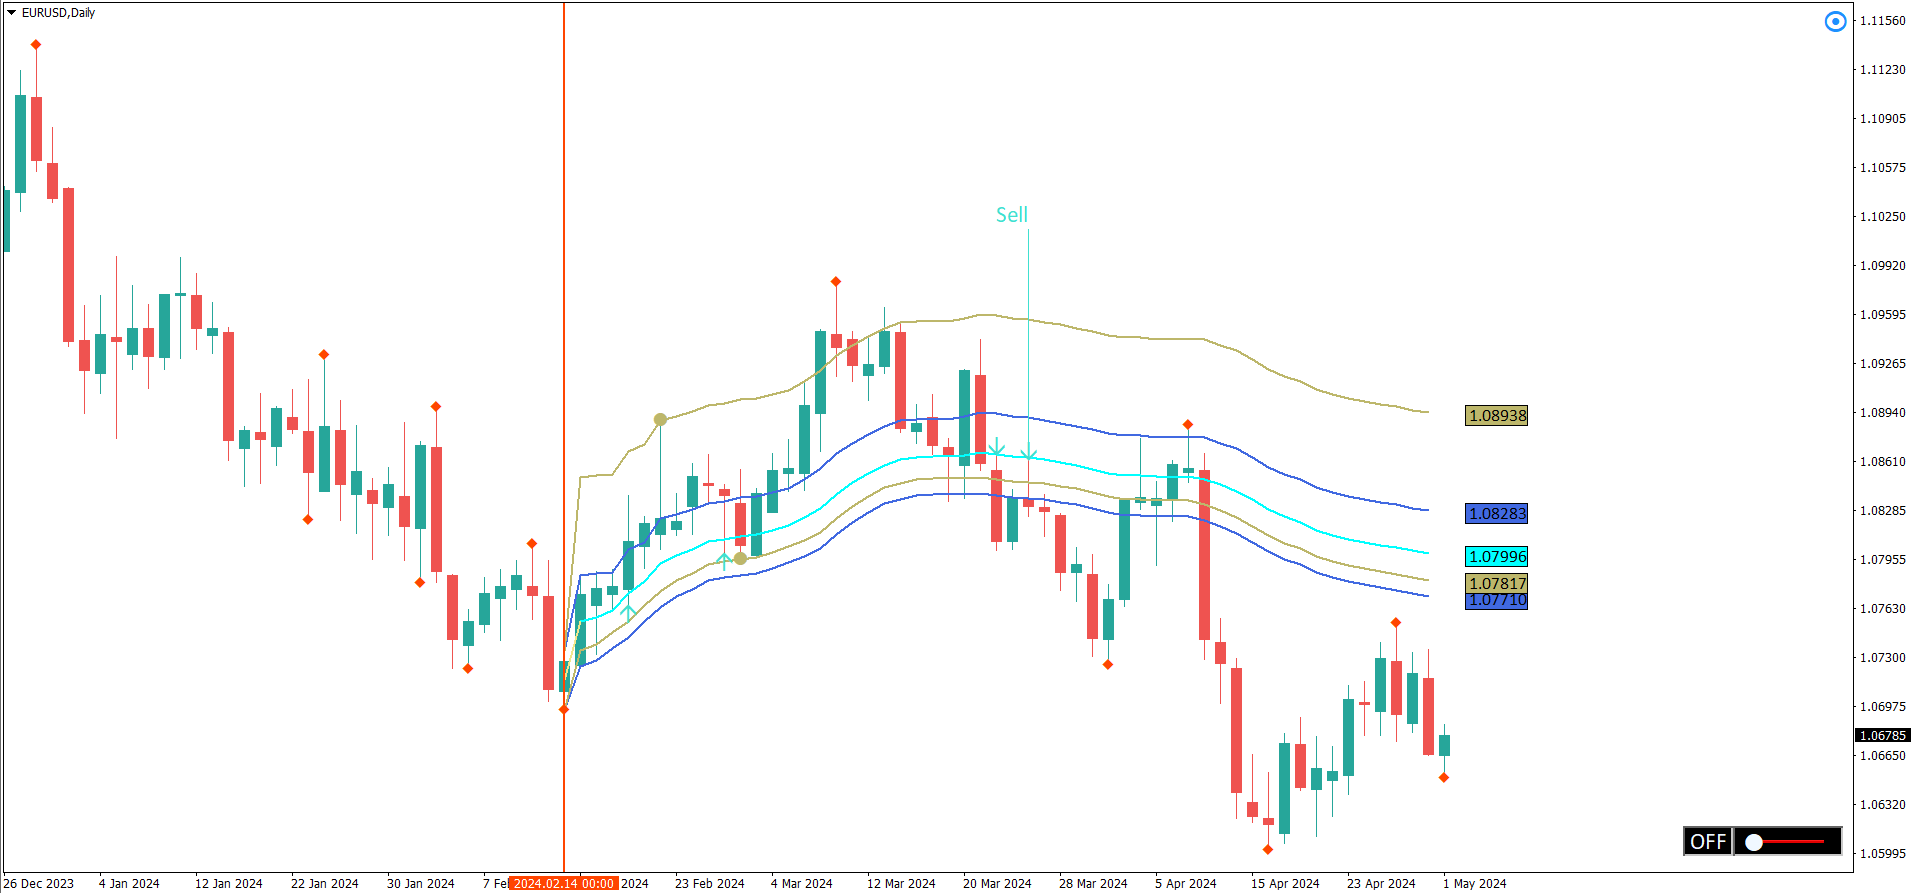
5. Wait for the price to retract to the MIDAS Support/Resistance curve, signaling a buy or sell opportunity.
6. Enter the market when a signal is generated, ensuring a minimum risk-to-reward ratio of 1:1+.
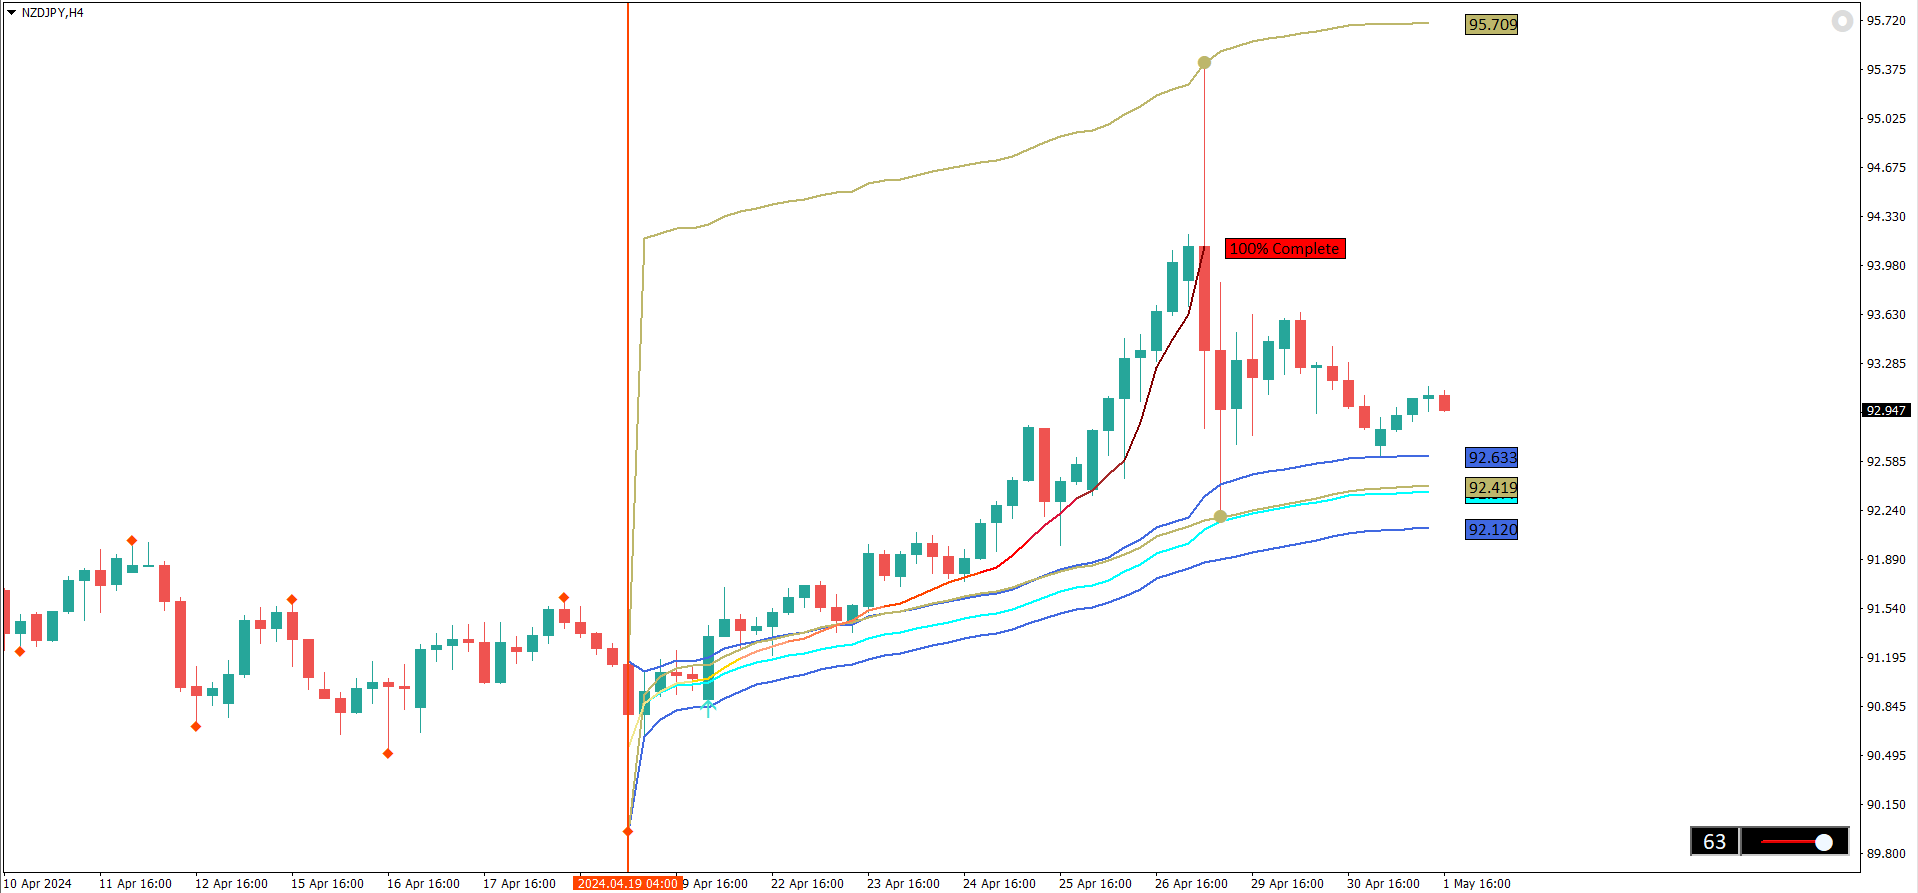
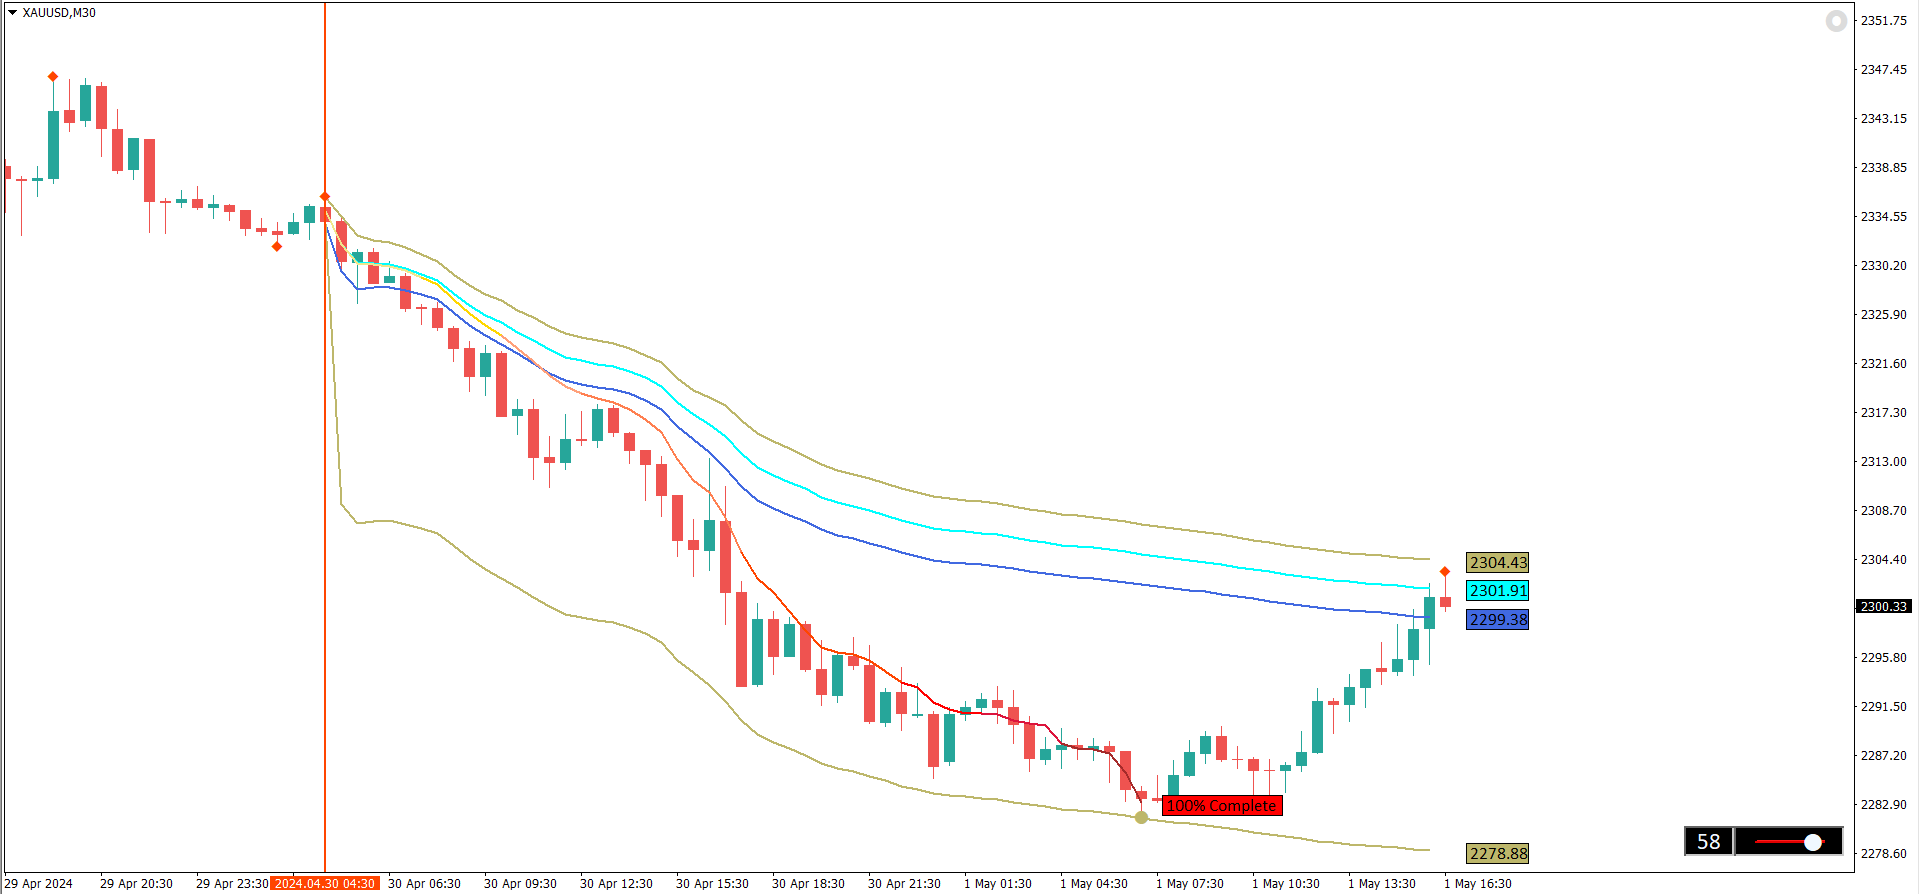
7. If the price accelerates away before fully retracing to the MIDAS Curve, launch and adjust the Top-Bottom Finder to the current pullback(s) by manipulating the cumulative volume in the bottom right corner to predict potential tops or bottoms.
8. When the Top-Bottom Finder reaches 100%, a retracement to the MIDAS Support/Resistance curve becomes probable.


For those new to the MIDAS Trading System and eager to explore the powerful trading methodology pioneered by the late Paul Levine, I suggest delving into "MIDAS Technical Analysis: A VWAP Approach to Trading and Investing in Today's Markets." The authors guide you through the fascinating MIDAS universe, elucidating its variations with abundant charts and examples. Start by perusing the introductory chapters, then dive into the practical, profit-oriented Chapter 8 to apply these principles firsthand.

Parameters

  • Show Recommended Anchor Points: True/False
  • Show Displacement Curves: Yes/No
  • Top-Bottom Finder Fuel Step (Cumulative Volume): 5
  • Show Signal: Yes/No
  • Show Signal for...: All/Retracement/Break
  • Signal Color: Yellow
  • Pop-Up Alert: Yes/No
  • Pop-Up Alert Sound: ok.wav
  • Push Notification: Yes/No
  • Email Message: Yes/No


Comentarios 17
Epsilon Hogas
1518
Epsilon Hogas 2022.06.16 05:22 
 

Its a good indicator for identifying pullback buy position, thank you

Dapo01
366
Dapo01 2022.05.11 21:12 
 

Very effective Indicator for predicting price reversal. It is quite precise. Very supportive telegram group. Great trade with precise entry today. Highly recommended.

Irfan
595
Irfan 2022.05.11 18:20 
 

It is really a very effective trading tool. Also great support and guidance from the author.

Productos recomendados
VR Cub
Vladimir Pastushak
VR Cub es un indicador para obtener puntos de entrada de alta calidad. El indicador fue desarrollado para facilitar los cálculos matemáticos y simplificar la búsqueda de puntos de entrada a una posición. La estrategia comercial para la cual se diseñó el indicador ha demostrado su eficacia durante muchos años. La simplicidad de la estrategia comercial es su gran ventaja, que permite que incluso los operadores novatos negocien con éxito con ella. VR Cub calcula los puntos de apertura de posiciones
Mr Beast Cobertura
Luis Mariano Vazquez Marcos
Mr Beast Super Hedge Asesor experto diseñado para trabajar encerrando el precio entre 2 valores hasta que rompa en una dirección tanto de compra como de venta. Este robot de trading de Forex ha sido desarrollado por MRBEAST como una herramienta para facilitar el trading intradía. Tenga en cuenta que el uso de este robot implica ciertos riesgos y no garantiza ganancias consistentes en el mercado de divisas. El robot de trading se basa en algoritmos y estrategias que he diseñado, los cuales se han
Black series MT4
Dmitriy Kashevich
1 (1)
Black series MT4 - The indicator is designed for trading on binary options with Timeframe M1-M5-M15 Multicurrency (Works on cryptocurrency and currency pairs) The signal appears when the candle opens Up to 90% correct signals There is no signal redrawing at all Can be used with other indicators. Good for scalping! In Settings there is: -Indicator working methods -I Allert Arrow color Red signal down Blue signal up Also watch the video how the indicator works and signals
Reversal Pattern Pro
Boonyapagorn Rodvattanajinda
Reversal Patterns Pro Reversal Patterns Pro is a Price Action (PA) analytical tool that scans the reversal patterns.  - Finds and marks the most dependable Japanese candlestick patterns in real-time. - Supports all time frames (Best for Scalping) - Doesn't repaint making it an exceptional indicator for Expert Advisors. Input parameters : - Support & Resistance Mode ( true or false ) for enabling advanced filtering - Donchian Period - RSI Period - RSI Oversold Level - RSI Overbought Level - 
Once Per Day
Phowpinyo Shimbhanao
The Once Per Day EA is a powerful and intelligent trading system designed for the EURUSD pair on a 5-minute time frame. This EA boasts an impressive array of 30 different entry strategies , each meticulously chosen based on historical statistics to match the current market conditions. This dynamic approach ensures that the EA can adapt and overcome market fluctuations, allowing it to achieve remarkable consistency. Backtested over a period of more than 7 years, the Once Per Day EA has demonstrat
Introduction to X3 Chart Pattern Scanner X3 Cherart Pattern Scanner is the non-repainting and non-lagging indicator detecting X3 chart patterns including Harmonic pattern, Elliott Wave pattern, X3 patterns, and Japanese Candlestick patterns. Historical patterns match with signal patterns. Hence, you can readily develop the solid trading strategy in your chart. More importantly, this superb pattern scanner can detect the optimal pattern of its kind. In addition, you can switch on and off individu
Transsion
Tatiana Savkevych
A trend indicator is a hybrid of several indicators that process data sequentially with signaling a trend change. Advanced net price action calculation to find LH and HL breakouts. Finishing the indicator data will give you excellent pivot points in the market. LH and HL signals can also be used for breakouts of the training. The indicator has proven itself well in a strategy based on impulse levels and false breakouts. When a breakout occurs, it indicates a strong reversal. A good filter for mo
Auto Levels
Yaroslav Varankin
Auto Level this tool is able to determine the levels of support and resistance. search and display when the price has broken through the level and when it pushed off from it. the indicator can be useful if you use resistance support levels in your trading. or the highs and lows of the price, then it will greatly simplify your work and help you more quickly and more accurately determine the rebound or breakdown of the current trend or tendencies level. blue line bottom uptrend red line on top dow
Anubis Skunk USES THE TREND WAVE INDICATOR AND IT CAN IDENTIFY THE BEGINNING AND THE END OF A NEW WAVE TREND MOVEMENT. AS AN OSCILLATOR, THE INDICATOR IDENTIFIES THE OVERBOUGHT AND OVERSOLD ZONES. IT WORKS GREAT TO CATCH THE SHORT TERM PRICE REVERSALS AND USES A MARTINGALE STRATEGY TO CLOSE ALL TRADES IN PROFIT. USE DEFAULT SETTINGS ON H1 OR HIGHER TIME FRAME ON ANY PAIR FOR MORE ACCURATE TRADES WHY THIS EA : Smart entries calculated by 5 great strategies The EA can be run on even a $
VANGLUTIO USES THE TREND WAVE INDICATOR AND IT CAN IDENTIFY THE BEGINNING AND THE END OF A NEW WAVE TREND MOVEMENT. AS AN OSCILLATOR, THE INDICATOR IDENTIFIES THE OVERBOUGHT AND OVERSOLD ZONES. IT WORKS GREAT TO CATCH THE SHORT TERM PRICE REVERSALS AND USES A MARTINGALE STRATEGY TO CLOSE ALL TRADES IN PROFIT. USE DEFAULT SETTINGS ON H1 OR HIGHER TIME FRAME ON ANY PAIR FOR MORE ACCURATE TRADES WHY THIS EA : Smart entries calculated by 5 great strategies The EA can be run on even a $200
Professional forex expert   Black Angel   (for EURUSD, GBPUSD pairs) alyzing the market using the Elliot Wave Index. Elliott wave theory is the interpretation of processes in financial markets through a system of visual models (waves) on price charts. The author of the theory, Ralph Elliott, identified eight variants of alternating waves (of which five are in the trend and three are against the trend). The movement of prices in the markets takes the form of five waves. Three of them (1, 3, 5)
Day Pattern
Oleksandr Martsynyshen
Description: - D ay Pattern - an indicator that helps to identify patterns of price changes for the development of trading algorithms and strategies. For whom this tool? - For developers of trading strategies and algorithms. - Medium- and long-term traders. Time frames H1-W1. Features of the indicator: - There is a function of exporting indicator values to a file of the csv format. - Using the information panel, you can conduct an express analysis of trading tool. - The indicat
El indicador construye cotizaciones actuales, que se pueden comparar con las históricas y, sobre esta base, hacer un pronóstico de movimiento de precios. El indicador tiene un campo de texto para una navegación rápida a la fecha deseada. Opciones: Símbolo - selección del símbolo que mostrará el indicador; SymbolPeriod - selección del período del cual el indicador tomará datos; IndicatorColor - color del indicador; HorisontalShift: cambio de cotizaciones dibujadas por el indicador
DMAX pro
Danny Teoh Kok Keong
DMAX SIGNAL IS VERY POWERFUL TOOL TO HELP YOU ENTRY,ITS CAN DETECT OVERSOLD AND OVERBOUGHT IN FOREX MARKET. ITS CAN TRADE 24 FOREX PAIR IN MARKET, 80% ACCURATE RESULT. MANY TRADER FAIL BECAUSE OF ENTRY POINT AND EXIT POINT , SIGNAL OF DMAX WILL GIVE VERY GOOD SIGNAL TO LET YOU KNOW WHERE TO ENTRY AND EXIT.  RISK MANAGEMENT IS VERY IMPORTANT IN TRADING FOREX, PLEASE DONT RISK OVER 5% PER TRADE IS FORE MARKET
MACD Divergence
Sergey Deev
2.5 (2)
The indicator detects divergence signals - the divergences between the price peaks and the MACD oscillator values. The signals are displayed as arrows in the additional window and are maintained by the messages in a pop-up window, e-mails and push-notifications. The conditions which formed the signal are displayed by lines on the chart and in the indicator window. Indicator Parameters MacdFast - fast MACD line period MacdSlow - slow MACD line period MacdSignal - MACD signal line period MacdPri
The Wing Patterns indicator scans for many different kinds of Patterns using an XABCD structure. The term Wing Pattern is used to refer to all types of patterns based on a general XABCD structure, which is plotted in an alternate high-low extreme form. In other words, assume that point X is started at a low point on the chart. The point A is plotted at the next highest point within a certain number of bars. This certain number of bars is called the depth level. In this example, point B would be
Trendiness Index
Libertas LLC
5 (3)
"The trend is your friend" is one of the best known sayings in investing, because capturing large trendy price movements can be extremely profitable. However, trading with the trend is often easier said than done, because many indicators are based on price reversals not trends. These aren't very effective at identifying trendy periods, or predicting whether trends will continue. We developed the Trendiness Index to help address this problem by indicating the strength and direction of price trend
The indicator provides a superior alternative to price action analysis. It enables the identification of normalized patterns, which are then transformed into a graphical representation to forecast future steps within a time series. In the top-left corner, you'll find information regarding the expected prediction accuracy, determined through a complex MSQE calculation. You have the flexibility to adjust the time window, making it easy to validate the indicator's performance. Additionally, you can
Indicador Taurus All4
Fabio Oliveira Magalhaes
Taurus All4 Taurus All4 is a high-performance indicator, it will tell you the strength of the trend, and you will be able to observe the strength of the candle. Our indicator has more than 4 trend confirmations. It is very simple and easy to use. Confirmation Modes Candle Trend Confirmations: When the candle switches to light green the trend is high. When the candle switches to light red the trend is reverting down. When the candle changes to dark red the trend is low. Trendline Trend Conf
The main idea of this indicator is rates analysis and prediction by Fourier transform. Indicator decomposes exchange rates into main harmonics and calculates their product in future. You may use the indicator as a standalone product, but for better prediction accuracy there is another related indicator - FreqoMaster - which uses FreqoMeterForecast as a backend engine and combines several instances of FreqoMeterForecast for different frequency bands. Parameters: iPeriod - number of bars in the ma
Indicator without redrawing Divergent MAX The DivirgentMAX indicator is a modification based on the MACD. The tool detects divergence based on OsMA and sends signals to buy or sell (buy|sell), taking into account the type of discrepancies detected. Important!!!! In the DivirgentMAX indicator, the optimal entry points are drawn using arrows in the indicator's basement. Divergence is also displayed graphically. In this modification of the MACD, the lag problem characteristic of its predecessor
Trend PA
Mikhail Nazarenko
5 (3)
The Trend PA indicator uses   Price Action   and its own filtering algorithm to determine the trend. This approach helps to accurately determine entry points and the current trend on any timeframe. The indicator uses its own algorithm for analyzing price changes and Price Action. Which gives you the advantage of recognizing, without delay, a new nascent trend with fewer false positives. Trend filtering conditions can be selected in the settings individually for your trading style. The indicator
Distinctive
Tatiana Savkevych
Distinctive is a forex trending arrow indicator for identifying potential entry points. I like it, first of all, because it has a simple mechanism of work, adaptation to all time periods and trading tactics. Created on the basis of a regression channel with filters. Plotting the Lawrence indicator signals on a price function chart using a mathematical approach. How it works - when the price breaks out in the overbought / oversold zone (channel levels), a buy or sell signal is generated. Every
Laser Trend
Nicolas Zouein
The trend is your friend! This is what this indicator is all about. Follow this famous saying and be safe. Characteristics: Buy/Sell signals fixed on the close of a bar. Works on all symbols and all timeframes. Clear visual market trend laser line, Buy/Sell signal arrows, market strength meter, TP1 & TP2 boxes. Visual signals when to enter, when to exit the market. No repainting. Compatible with Flexible EA for trading automation. (Ask for a free set file optimized to perform 2010-2018) Para
This indicator is another variant of the famous powerful indicator Fibonacci-SS https://www.mql5.com/en/market/product/10136 but has different behaviour in placing Pending Order and TP Line. Automatically places Fibonacci retracement lines from the last highest and lowest visible bars on the chart with: An auto Pending Order (Buy/Sell). Taking Profit 1, Taking Profit 2 is pivot point and Taking Profit 3 for extended reward opportunity. The best risk and reward ratio. Simple and powerful indica
TLM Map AM
Andriy Matviyevs'kyy
TLM Map AM (Trend Line Momentum Map) is an indicator developed based on a set of digital technical analysis indicators described in the article by Vladimir Kravchuk: " Digital indicators in the technical analysis of financial markets ". The indicator displays in a separate window a complex of digital technical analysis indicators such as FTLM and STLM. Recommended for use in conjunction with the RTL Map AM (Reference Trend Line Map) indicator. The indicator has no customizable parameters.
FREE
The indicator for determining key patterns for the BBMA strategy will perfectly complement the Fibo Musang strategy, and can also be used as an independent tool. IMPORTANT! Contact me immediately after purchase to receive the second file! If you have any questions, I will help you deal with the indicator. Designed to save market analysis time; Sends push notifications to the phone when key moments of the strategy have arisen (Extrem A, Csak, cross the BB line with a candle) Advantages Easy to u
Gold Phoenix
Yaroslav Varankin
The perfect tool for Scalng in the Forex markets You can trade both from signal to signal and using take profit  The algorithm does not use Zigzag!  No redrawing!  This is a channel instrument that uses a moving average as a filter. Moving Average  There are 2 parameters for the settings Ma Period = 5 period Moving Average  Channel 1.0 distance of channel lines from the chart Price Signal Filter - calculation of signal opening and filter There is a complete set of Alert There is a multi-timefram
BPSPanel
Remi Passanello
BPS Panel Breakout Pro Scalper Solution Panel This indicator is part of the   RPTrade Pro Solutions  systems. BPS Panel   is a daily trend indicator using Price Action, Dynamic Support and Resistances. It's designed to be used by anyone, even the absolute beginner in trading can use it. NEVER repaints . Indications are given   from close to close . Designed to   be used alone , no other indicators are required. Gives you the trend and potential Take Profit at the beginning of the day. How
Trend Scanner
Vladimir Kalendzhyan
4.38 (8)
By purchasing this indicator, you have the right to receive a free copy of one of   my other indicator's or advisor’s!  (All future updates are included. No limits) . To get it , please contact me by  mql5 message ! The Trend Scanner trend line indicator displays the trend direction and its changes. The indicator works on all currency pairs and  timeframes. The indicator simultaneously displays multiple readings on the price chart: the support and resistance lines of the currency pair, the exist
Los compradores de este producto también adquieren
Atomic Analyst
Issam Kassas
5 (3)
En primer lugar, vale la pena enfatizar que este Indicador de Trading no repinta, no redibuja y no se retrasa, lo que lo hace ideal tanto para el trading manual como para el automatizado. Manual del usuario: configuraciones, entradas y estrategia. El Analista Atómico es un Indicador de Acción del Precio PA que utiliza la fuerza y el impulso del precio para encontrar una mejor ventaja en el mercado. Equipado con filtros avanzados que ayudan a eliminar ruidos y señales falsas, y aumentan el poten
TPSpro RFI Levels
Roman Podpora
4.82 (22)
Reversal First Impulse levels (RFI)    INSTRUCTIONS        RUS       -       ENG              R ecommended to use with an indicator   -   TPSpro  TREND PRO -  Version MT5 A key element in trading is zones or levels from which decisions to buy or sell a trading instrument are made. Despite attempts by major players to conceal their presence in the market, they inevitably leave traces. Our task was to learn how to identify these traces and interpret them correctly. Main functions: Displaying activ
Cycle Sniper
Elmira Memish
4.41 (37)
NEW YEAR SALE PRICE FOR LIMITED TIME!!! Please contact us after your purchase and we will send you the complimentary indicators to complete the system Cycle Sniper is not a holy grail but when you use it in a system which is explained in the videos, you will feel the difference. If you are not willing to focus on the charts designed with Cycle Sniper and other free tools we provide, we recommend not buying this indicator. We recommend watching the videos about the indiactor and system before pu
¡Actualmente 20% OFF ! ¡La mejor solución para cualquier novato o trader experto! Este software funciona con 28 pares de divisas. Se basa en 2 de nuestros principales indicadores (Advanced Currency Strength 28 y Advanced Currency Impulse). Proporciona una gran visión general de todo el mercado de divisas. Muestra los valores de Advanced Currency Strength, la velocidad de movimiento de las divisas y las señales para 28 pares de divisas en todos los (9) marcos temporales. Imagine cómo mejorar
PZ Day Trading
PZ TRADING SLU
3.67 (3)
Este indicador detecta reversiones de precios en forma de zig-zag, utilizando solo análisis de acción de precios y un canal donchian. Ha sido diseñado específicamente para el comercio a corto plazo, sin repintar ni pintar en absoluto. Es una herramienta fantástica para comerciantes astutos con el objetivo de aumentar el tiempo de sus operaciones. [ Guía de instalación | Guía de actualización | Solución de problemas | FAQ | Todos los productos ] Increíblemente fácil de comerciar Proporciona
NAM Order Blocks
NAM TECH GROUP, CORP.
5 (1)
Indicador de detección de Order Blocks multitimeframe para MT4. Características - Panel de control totalmente personalizable, proporciona una interacción completa. - Oculta y muestra el panel de control donde quieras. - Detecta OB en múltiples marcos de tiempo. - Permite seleccionar la cantidad de OB para mostrar. - Interfaz de usuario de diferentes OBs. - Diferentes filtros de OBs (regulares, rejection y sin capitalizar). - Alerta de proximidad de OBs. - Líneas ADR High y Low. - Servicio de not
ECM Channel MT4
Paulo Rocha
5 (1)
ECM Elite Channel is a volatility-based indicator, developed with a specific time algorithm, which consists of finding possible corrections in the market. This indicator shows two outer lines, an inner line (retracement line) and an arrow sign, where the channel theory is to help identify overbought and oversold conditions in the market. The market price will generally fall between the boundaries of the channel. If prices touch or move outside the channel, it's a trading opportunity. The
AT Forex Indicator MT4
Marzena Maria Szmit
5 (2)
The AT Forex Indicator MT4 is a sophisticated trading tool designed to provide traders with a comprehensive analysis of multiple currency pairs. This   powerful indicator   simplifies the complex nature of the forex market, making it accessible for both novice and experienced traders. AT Forex Indicator uses   advanced algorithms   to detect trends, patterns and is an essential tool for traders aiming to enhance their forex trading performance. With its robust features, ease of use, and reliabl
Indicator : RealValueIndicator Description : RealValueIndicator is a powerful tool designed specifically for trading on the EURUSD pair. This indicator analyzes all EUR and USD pairs, calculates their real currency strength values, and displays them as a single realistic value to give you a head start on price. This indicator will tell you moves before they happen if you use it right. RealValueIndicator allows you to get a quick and accurate overview of the EURUSD currency pair tops and bottoms,
TrendMaestro
Stefano Frisetti
5 (3)
note: this indicator is for METATRADER4, if you want the version for METATRADER5 this is the link:  https://www.mql5.com/it/market/product/108106 TRENDMAESTRO ver 2.4 TRENDMAESTRO recognizes a new TREND in the bud, he never makes mistakes. The certainty of identifying a new TREND is priceless. DESCRIPTION TRENDMAESTRO identifies a new TREND in the bud, this indicator examines the volatility, volumes and momentum to identify the moment in which there is an explosion of one or more of these data a
This indicator uses support and resistance, volume and some special formula to calculate the volume to filter the candles. If the volume reaches a specific value, And at the same time, Candle breaks the support/resistance line, There would be a signal and we can enter the market. Signals appear when the current candle closes. then you can enter the trade when a new candle appears. Please don't forget to follow your money management plan. MT5 Version Support/Resistance Breakout MT5 :   https:
Enigmera
Ivan Stefanov
5 (4)
ENIGMERA: El núcleo del mercado https://www.enigmera.com Introducción Este indicador y sistema de negociación es un enfoque extraordinario de los mercados financieros. ENIGMERA utiliza los ciclos fractales para calcular con precisión los niveles de soporte y resistencia. Muestra la auténtica fase de acumulación y proporciona dirección y objetivos.  Un sistema que funciona tanto si estamos en una tendencia como en una corrección.  ¿Cómo funciona? ENIGMERA consta de tres líneas: la línea de s
El indicador " ZigZag on Trend " es un asistente para determinar la dirección del movimiento del precio, así como una calculadora de barras y pips. Consiste en un indicador de tendencia que monitorea la dirección del precio con una línea de tendencia presentada en forma de zigzag y un contador que calcula el número de barras pasadas en la dirección de la tendencia y el número de puntos en una escala vertical. (Los cálculos se realizan mediante la apertura de la barra) El indicador no se vuelve a
Gold Channel is a volatility-based indicator, developed with a specific timing algorithm for the XAUUSD pair, which consists of finding possible corrections in the market. This indicator shows two outer lines, an inner line (retracement line) and an arrow sign, where the theory of the channel is to help identify overbought and oversold conditions in the market. The market price will generally fall between the boundaries of the channel. If prices touch or move outside the channel it is a tra
JULY OFFER 80% OFF next price for unlimited version will be 17000$. This is the only time you can get this institutional and professional indicator at this price for unlimited version. Don't dare to miss this. The tool I am about to introduce to you you can't compare it with other tools due to its strategy and accuracy level in predicting the next price directional movement . This tool is designed for serious traders who have decided to make a difference through trading. Be the next person to wi
Gann Signal
Kirill Borovskii
Gann Signal is a very simple indicator at first glance, but hidden inside is many years of experience in studying W.D.Ganna methods. The indicator gives accurate BUY/SELL signals, without redrawing. The indicator is very easy to use. All you need to do is attach it to your chart and follow its recommendations. The indicator constantly analyzes the market for entry opportunities. When such an opportunity appears, the indicator gives a signal in the form of an arrow. I repeat, all signals are NOT
Presentamos el Indicador Milagroso de Forex: Desata el Poder del Trading Preciso ¿Estás cansado de buscar el mejor indicador de Forex que realmente ofrezca resultados excepcionales en todos los marcos temporales? ¡No busques más! Ha llegado el Indicador Milagroso de Forex para revolucionar tu experiencia de trading y llevar tus ganancias a nuevas alturas. Construido sobre una base de tecnología de vanguardia y años de desarrollo meticuloso, el Indicador Milagroso de Forex se erige como el pinácu
Shepherd Gann Squares
Abdullah Alrai
4.9 (10)
Este indicador es un método de análisis de mercado basado en el artículo "Fórmula matemática para predicciones de mercado" escrito por W.D. Gann según los métodos del cuadrado de nueve y el cuadrado de 144. Manual de usuario: Add Your review And contact us to get it Puede comprar la versión MT5 completa en: https://www.mql5.com/en/market/product/28669 Puede probar en MT4 gratis: https://www.mql5.com/en/market/product/15320?source=Site +Profile+Seller#!tab=reviews Este producto
Welcome to the world of SMC (Smart Money Concepts) Trading, where we empower traders with the tools and knowledge to make smarter trading decisions. Our latest addition to our suite of trading tools is the SMC Trading Pro indicator, version 1.0. Key Features: Major Market Structure Identification with BODY break. Order Block must be in Major Swing ( not Small Swing ). Order Block with Fair Value Gap Detection. Order Block in Discount | Premium zone. Filter for only Bullish, Bearish or All Order
Beast Super Signal
Dustin Vlok
4.76 (101)
¿Está buscando un potente indicador de compraventa de divisas que pueda ayudarlo a identificar oportunidades comerciales rentables con facilidad? No busque más allá de Beast Super Signal. Este indicador basado en tendencias fácil de usar monitorea continuamente las condiciones del mercado, buscando nuevas tendencias en desarrollo o saltando sobre las existentes. Beast Super Signal da una señal de compra o venta cuando todas las estrategias internas se alinean y están en 100% de confluencia entr
Dragon Multi Indicator MT4
Mansour Babasafary
5 (4)
3 Indicators in 1 indicator Strategy based on price action Made specifically for the best forex currency pairs Can be used in the best time frame of the market at a very reasonable price This indicator is basically 3 different indicatos . But we have combined these 3 indicators in 1 indicator so that you can use 3 indicators at the lowest price. All three strategies are based on price action. But based on different trends. Long term, medium term and short term Attributes : No repaintin
Introduction to Fractal Pattern Scanner Fractal Indicator refers to the technical indicator that makes use of the fractal geometry found in the financial market. Fractal Pattern Scanner is the advanced Fractal Indicator that brings the latest trading technology after the extensive research and development work in the fractal geometry in the financial market. The most important feature in Fractal Pattern Scanner is the ability to measure the turning point probability as well as the trend probabi
ZeusArrow Smart Liquidity Finder  Smart Liquidity Finder is Ai controlled indicator based on the Idea of Your SL is My Entry. It scan and draws the major Liquidity areas on chart partitioning them with Premium and Discount Zone and allows you find the best possible trading setups and help you decide the perfect entry price to avoid getting your Stop Loss hunted . Now no more confusion about when to enter and where to enter. Benefit from this one of it's kind trading tool powered by Ai an trade
Please send me Direct message on MQL5 CHAT after purchasing the Indicator for Training and Installation Support There are some additional files that is important to use with the Indicator . So be sure to contact me after purchasing the Indicator So that I can add you for training and support . If you find any difficulty with installation then send me Direct message here So that I can connect with you via Anydesk or Teamview for the product installation. " Smart Order Block Indicator " to find
A. ¿Qué es A2SR ?   * Es un indicador técnico líder (sin repintado, sin retraso). -- Guía : -- en https://www.mql5.com/en/blogs/post/734748/page4#comment_16532516 -- y https://www.mql5.com/en/users/yohana/blog A2SR tiene una técnica especial para determinar los niveles de Soporte (demanda) y Resistencia (oferta). A diferencia de la forma ordinaria que vimos en la red, A2SR tiene un concepto original para determinar los niveles reales de SR. La técnica original no se tomó de Internet y tampoco
Por supuesto, aquí tienes la traducción al español: Presentamos el Indicador de Astronomía para MT4: Tu Compañero Celestial Definitivo en el Trading ¿Estás listo para elevar tu experiencia de trading a alturas celestiales? No busques más allá de nuestro revolucionario Indicador de Astronomía para MT4. Esta innovadora herramienta trasciende los indicadores de trading tradicionales, aprovechando el poder de algoritmos complejos para proporcionarte una visión astronómica sin igual y cálculos de pre
FxBears Powers
Rachid Lafhil
3 (2)
️️ Attention:      The price will soon be raised to what it was before ($500).      No more losses with this indicator, test it for years ago and see if there is losses in one day results. but before testing it please see the explaining video down here.    FxBears Powers is working on all forex pairs, metals, commodities, futures, indices, energies, crypto, and everything...and on all timeframes from M1 to MN.   It's based on supply and demand zones, price action, and some internal indicators,
Indicador cíclico para negociar y predecir la dirección del mercado. Muestra el comportamiento cíclico del precio en forma de oscilador. Da señales para abrir tratos al rebotar desde los límites superior e inferior del oscilador. En forma de histograma, muestra la fuerza suavizada de la tendencia. Complementará cualquier estrategia comercial, desde scalping hasta intradía. El indicador no se vuelve a dibujar. Adecuado para su uso en todos los símbolos/instrumentos. Marcos de tiempo adecuados p
30% DISCOUNT ! DISCOUNT ! DISCOUNT ONLY FOR 5 USERS at125$ valid for 1 day only.Grab it The PERFECT TREND HIT creates   BUY and SELL  perfect trend   arrow signals based on ADX EMA AND RSI And all filters inbuilt with accurate trend entries. Furthermore, the indicator and template display the trend direction, strength, and trade recommendation for independent price charts. ROCK WITH THE TREND Moreover, it shows the final trade recommendation to BUY or SELL with all filters and displays that info
SMT Divergences MT4
Diego Arribas Lopez
5 (2)
MT5 Version SMT Divergences MT4 SMT Divergences is one of the most innovative indicators in the market. It offers the possibility of analyzing price divergences between 2 pairs. These divergences highlight and help to foresee what banks and institutions are planning to do. SMT divergences also provides you with a kill zones indicator and the possibility of filtering divergences occurring during these kill zones.  The strategy tester is limited in MT4. Contact the author to get your Demo Version
Otros productos de este autor
Martin Armstrong Cycles
Carl Gustav Johan Ekstrom
5 (2)
Martin Armstrong Cycles employs an unconventional form of technical analysis on your charts aimed at capturing market angles, swift market movements, price reversals, and early trend shifts. I strongly advise all traders to integrate cyclical analysis into their charting methods, as it unveils the inherent rhythms of markets. Every element in the universe follows a cycle, and so does price! Analytical Benefits of Cyclical Analysis The angle of the cycle provides a roadmap for anticipating fu
The 5 Trend Lines Rule
Carl Gustav Johan Ekstrom
5 (1)
After analyzing a numerous significant bear and bull markets, a peculiar principle has surfaced, dubbed the  5 Trend Lines Rule . It suggests that within a major bear or bull market, there are typically five false breakouts before the sixth breakout proves significant. Parameters Trend Line #1 Color:  Magenta Trend Line #2 Color:  Magenta Trend Line #3 Color:  Magenta Trend Line #4 Color:  Magenta Trend Line #5 Color:  Magenta #1 Color:  Yellow #2 Color:  Yellow #3 Color:  Yellow #4 Color: Ye
Breakout Lines MT5
Carl Gustav Johan Ekstrom
5 (1)
The Breakout Line in technical analysis serves as a crucial tool for understanding market dynamics and potential shifts in price direction. It's designed to highlight rapid accelerations or declines in the market's trajectory. Unconventional Analysis : The Breakout Line is not your typical technical indicator; it's tailored to capture swift market movements, offering a unique perspective on price trends. Angle of the Breakout Line : The sharper the angle formed by the Breakout Line, the stronger
The Trap Play MT5
Carl Gustav Johan Ekstrom
5 (1)
Trap Play  refers to a market situation where price initially makes a new high or low, luring traders into believing a strong trend is forming. However, the price quickly reverses and invalidates the breakout, trapping those traders who entered positions based on the initial move. This sudden reversal often results in a rapid exit of positions, leading to significant price movement in the opposite direction.  Trap plays  can occur in various financial markets and timeframes and are characterized
The Trap Play MT4
Carl Gustav Johan Ekstrom
5 (4)
Trap Play  refers to a market situation where price initially makes a new high or low, luring traders into believing a strong trend is forming. However, the price quickly reverses and invalidates the breakout, trapping those traders who entered positions based on the initial move. This sudden reversal often results in a rapid exit of positions, leading to significant price movement in the opposite direction.  Trap plays  can occur in various financial markets and timeframes and are characterized
Trading Cycle Array MT4
Carl Gustav Johan Ekstrom
I'm excited to introduce you to the fifth bar on   Martin Armstrong's  Forecast Array - The Trading Cycle . This innovative tool represents a transverse form of cyclical frequency analysis, offering a unique perspective on market trends. The model employs a color-coded system for easy interpretation. In this model, green signals the ideal timing for highs, red indicates ideal lows, and yellow signifies a convergence of highs and lows occurring simultaneously. This intuitive approach allows
Trading Cycle Array MT5
Carl Gustav Johan Ekstrom
5 (1)
I'm excited to introduce you to the fifth bar on   Martin Armstrong's  Forecast Array - The Trading Cycle . This innovative tool represents a transverse form of cyclical frequency analysis, offering a unique perspective on market trends. The model employs a color-coded system for easy interpretation. In this model, green signals the ideal timing for highs, red indicates ideal lows, and yellow signifies a convergence of highs and lows occurring simultaneously. This intuitive approach allows
Breakout Lines MT4
Carl Gustav Johan Ekstrom
5 (1)
The   Breakout Line   in technical analysis serves as a crucial tool for understanding market dynamics and potential shifts in price direction. It's designed to highlight rapid accelerations or declines in the market's trajectory. Unconventional Analysis : The Breakout Line is not your typical technical indicator; it's tailored to capture swift market movements, offering a unique perspective on price trends. Angle of the Breakout Line : The sharper the angle formed by the Breakout Line, the stro
Filtro:
Robert
629
Robert 2023.05.13 13:07 
 

El usuario no ha dejado ningún comentario para su valoración

Carl Gustav Johan Ekstrom
4287
Respuesta del desarrollador Carl Gustav Johan Ekstrom 2023.05.13 13:15
Thank you! :)
faithdefender
1726
faithdefender 2022.07.26 23:47 
 

I think if you are going to sell an indicator for a certain strategy after a person, you should be able to help guide the customer through the concept. Not just sending a twelve page document filled with YOUR indicators with limited pages dealing with the Midas indicator. While in the Telegram group, I asked for help with identifying placement of the indicator. It was a sincere question. Answer? "Isolated highs and lows are the best place to anchor MIDAS." He also said he would show how in the following text. But, he removed that text and has never responded. If things work out, I will update my review. But this speaks volumes when someone offers minimum help on an expensive indicator. UPDATE 8-23-22. Still not able to find the "isolated highs" where i was instructed toplace the indicator. Never heard back from the Vendor. I think the indicator could be be a tool if it had training where to place the points, but as I said, I have tried to take the indicator and place it at multiple spots where it may come and touch, but it does not. It is a bummer I didnt read the review by Hadi below that says "A supporting group with promising indicators. The author is more than welcome for us to learn more and the theory." What does that tell the customer when someone writes 'with promising indicators....'? Promising what? Did he even try the indicator? 10-6-22 I am upgrading my review to 4 stars. While I am still trying to figure it out, it has always been my conviction that quality AND price should be considered when writing a review. In fairness to the Vendor, this indicator is affordable and for that reason this should mitigate the review. I am still lost using it, but I do think someone with knowllege of VWAP may benefit. For this reason I want to remain positive. Update. 10-28-22 The indicator does not consistently work. When you apply it to the chart the vertical line is visible, but wherever you post it, the three lines will not display. I have sent a note to the Vendor. I have had to reduce the rating unless it is repaired. UPDATE 5-12-23 As you can see the Vendor has made some instructive and beneficial changes and I want to update the rating to four stars. He has designed it for people learning to use MIDAS and this most certainly helps me. I will continue to evaluate, but for now I have no problem with a recommendation. Thank you

Carl Gustav Johan Ekstrom
4287
Respuesta del desarrollador Carl Gustav Johan Ekstrom 2023.05.11 10:25
Thank you for your extensive review. I have sent you a PM to try resolve the issue. Update: Please download the latest version (4.60) to find recommended anchor points :)
Epsilon Hogas
1518
Epsilon Hogas 2022.06.16 05:22 
 

Its a good indicator for identifying pullback buy position, thank you

Carl Gustav Johan Ekstrom
4287
Respuesta del desarrollador Carl Gustav Johan Ekstrom 2023.03.10 13:24
Thank you
cattledog
255
cattledog 2022.05.18 11:01 
 

indicator not working and no way to reach seller.

Carl Gustav Johan Ekstrom
4287
Respuesta del desarrollador Carl Gustav Johan Ekstrom 2022.07.09 16:50
You rented the indicator and immediately left a bad review. You haven't tried to contact me in any way.
Dapo01
366
Dapo01 2022.05.11 21:12 
 

Very effective Indicator for predicting price reversal. It is quite precise. Very supportive telegram group. Great trade with precise entry today. Highly recommended.

Carl Gustav Johan Ekstrom
4287
Respuesta del desarrollador Carl Gustav Johan Ekstrom 2023.03.10 13:24
Thank you
Irfan
595
Irfan 2022.05.11 18:20 
 

It is really a very effective trading tool. Also great support and guidance from the author.

dkaramarko
237
dkaramarko 2022.05.11 11:40 
 

very useful and recommended and author is highly friendly and always prepared to help

Carl Gustav Johan Ekstrom
4287
Respuesta del desarrollador Carl Gustav Johan Ekstrom 2023.03.10 13:24
Thanks
Vasileios Kapsis
180
Vasileios Kapsis 2022.05.05 20:47 
 

This is a first review concerning the MIDAS approach. As I gain experience I will keep adding more information. It looks like a very interesting tool. It requires some trading knowledge and you need to do your homework. It is not a black box that calls trades. It is a real trading tool. It is very easy to install and Carl-Gustav (the author) has a Telegram channel to assist members. Carl-Gustav is a professional trader and not some programmer that converted a trading system to an indicator. Overall the value for money is excellent and the support is outstanding.

Carl Gustav Johan Ekstrom
4287
Respuesta del desarrollador Carl Gustav Johan Ekstrom 2023.03.10 13:24
Thank you :) :)
Sofwan Hadi
238
Sofwan Hadi 2022.04.26 09:06 
 

A supporting group with promising indicators. The author is more than welcome for us to learn more and the theory.

Carl Gustav Johan Ekstrom
4287
Respuesta del desarrollador Carl Gustav Johan Ekstrom 2023.03.10 13:25
Thank you
Joao Flores Neto
2149
Joao Flores Neto 2018.01.16 17:51 
 

One of the best indicators, congrats, good job, guy.

Carl Gustav Johan Ekstrom
4287
Respuesta del desarrollador Carl Gustav Johan Ekstrom 2023.03.10 13:25
Thanks
sateeqpal
23
sateeqpal 2017.10.26 19:04 
 

Ideal Indicator and Perfect Supportive Author.

I believe all types of traders will love it too much, since all of them are using the classic way along with their strategies.

If you like to have the indicator helps you for accurate entries, this one is ideal

it's really amazing for following the trends and wow for scalping.

My advice take it and try it, you will not regret (((along with that try to read the e-book if like to become a professional trader)))

Carl Gustav Johan Ekstrom
4287
Respuesta del desarrollador Carl Gustav Johan Ekstrom 2023.03.10 13:25
Thank you
spacejockey
161
spacejockey 2017.10.13 13:05 
 

Great Indi

Carl Gustav Johan Ekstrom
4287
Respuesta del desarrollador Carl Gustav Johan Ekstrom 2023.03.10 13:25
Thank you :)
jackhammer42
303
jackhammer42 2017.09.09 15:42 
 

Very good indicator and supportive developer!

Carl Gustav Johan Ekstrom
4287
Respuesta del desarrollador Carl Gustav Johan Ekstrom 2023.03.10 13:25
Thank you :)
Bazi Siguqa
573
Bazi Siguqa 2017.08.24 00:38 
 

This is the first time where I am giving a good review because the product really works, other wise its always been about "the author asked me to give a good one". This is boss indicator I mean BOSS product!! I recommend u read the whole book by Andrew Coles and Hawkins

The best part is the support from developer!

Carl Gustav Johan Ekstrom
4287
Respuesta del desarrollador Carl Gustav Johan Ekstrom 2023.03.10 13:25
Thank you very much :)
ZHE WEI
1240
ZHE WEI 2017.08.21 09:12 
 

El usuario no ha dejado ningún comentario para su valoración

fellan
35
fellan 2017.08.08 12:50 
 

El usuario no ha dejado ningún comentario para su valoración

Carl Gustav Johan Ekstrom
4287
Respuesta del desarrollador Carl Gustav Johan Ekstrom 2023.03.10 13:26
Thank you
sbashir
266
sbashir 2016.08.18 00:07 
 

Simple effective and best. it requires some deep knowledge about swings, candle stick patterns. what i feel is if you learn it you will never be in the need of any other indicator. Above all the author is one of the nicest person i have ever encountered with on mql5. Great Job

Carl Gustav Johan Ekstrom
4287
Respuesta del desarrollador Carl Gustav Johan Ekstrom 2023.03.10 13:26
Thank you
Respuesta al comentario
Versión 4.70 2024.05.01
Enhancements to visual appearance.
Versión 4.60 2023.05.11
Major Update!

+ Visual improvements
+ Top-Bottom Finder algorithm improved
+ Indicator response time improved
+ Recommended anchor points
+ Price labels
+ Alert system
+ Buy and Sell signals
+ MIDAS displacement curves (adjustable)

Versión 4.50 2022.07.01
Minor Fixes.
Versión 4.40 2022.06.17
Minor Fixes.
Versión 4.30 2022.06.17
Major Upgrade include the following,

+ Buy/Sell Signals added.
+ On Chart Signal Button added.
+ Displacement Curves added.
+ Time Frame Memory added.
+ Pop-Up Alert added.
- Top-Bottom Finder Removed.

Versión 4.20 2022.04.26
Minor Update

- It is now possible to adjust the T-B Finder Percent (%) Comment under "Percent Distance)
Versión 4.10 2022.04.21
Minor Adjustment: Made T-B Finder "False" by default so that you can make it "True" when you spot an accelerated trend.

Versión 4.0 2022.04.11
Version 4.00: Improved User Experience!

- I have temporarily removed the Shifted VWAP. It will be back when further improved.

- Chart ID have been added, now you can have several copies on the chart.

- Visual aspects have been improved and enlarged.
Versión 3.99 2018.02.14
Version 3.99 - Back to Original MIDAS + Improvements (Paul Levine Indicator)

- Top/Bottom Finder (TB-F) have been added back on and users will be able to adjust to the correct volume or "fuel" necessary to fit the TBf Curve to point D directly on the chart. You no longer have to go back and forth in the settings.

- Shifted VWAP1 and VWAP2 have been added back on as well but with no adjustments as it is better for users to be able to fit and select high/lows of their interest, and not automatically.

- TD Relative Retracement have been removed, it is now available to download for free here: https://www.mql5.com/en/market/product/26640

Signals are discontinued until version 4.0 as major improvements are needed.
Versión 3.95 2018.01.16
Version 3.95

Whats New?

- Buy and Sell Signals
- Break Signals


Versión 3.90 2018.01.12
TD RRET + MIDAS v3.9 !

>>Read below before upgrading!<<

This version is merged with TD Relative Retracement (TD RRET) by Thomas DeMark.
This version mechanically determines the correct levels and anchor point, simply select high/low.


Important Notes:

1. I have decided to exclude the Top/Bottom Finder from this version until I can make point D be mechanically determined. I will also included a Top/Bottom Finder Price Projection in later versions.


2. I have decided to exclude the MDC from this version as well until I can make it mechanically determine the correct high/low to use, for better user experience and consistent analysis.
Versión 3.50 2017.08.14
MIDAS Trading Tools Version 3.50 contains;

-Drag and Drop features for easy adjustment and better user experience

-MIDAS + High + Low Curves

-Two Displacement Curves

-Magic Number; You need to assign a unique number to each copy that is launched to any chart or profile in your MT4 Terminal.