PipFinite Cluster Helix MT5
- Indicadores
- Karlo Wilson Vendiola
- Versión: 9.0
- Actualizado: 7 julio 2024
- Activaciones: 5
A combination of trend, pullback, range breakouts and statistics in one indicator
Mainly functions as an Entry indicator. Works in any pair and timeframe.
Suggested Combination
Cluster Helix with Strength Meter
- Strategy: Confirm signals with ideal strength levels
- Watch Video: (Click Here)
Features
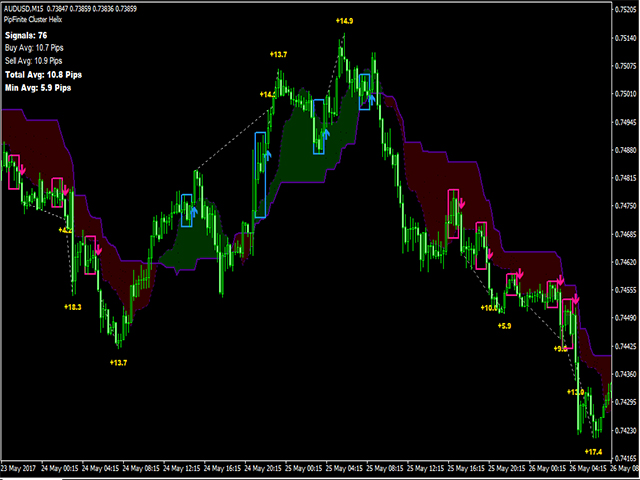
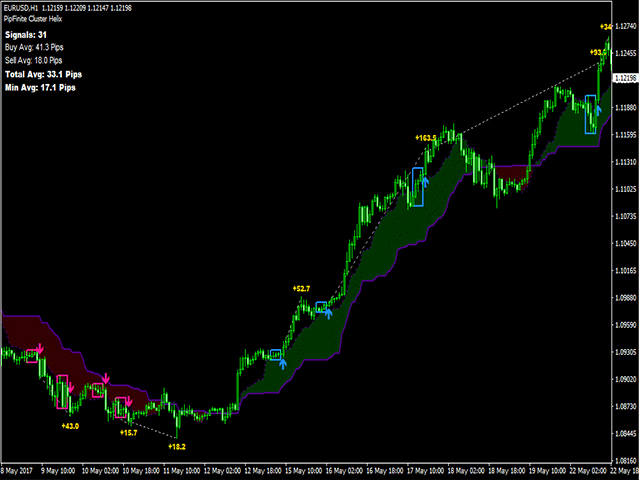
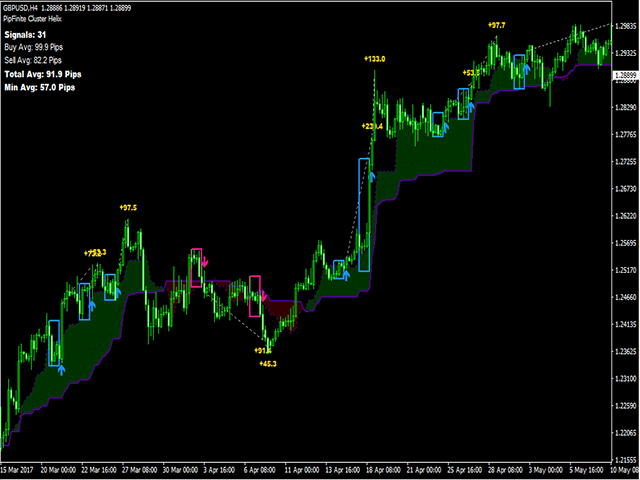
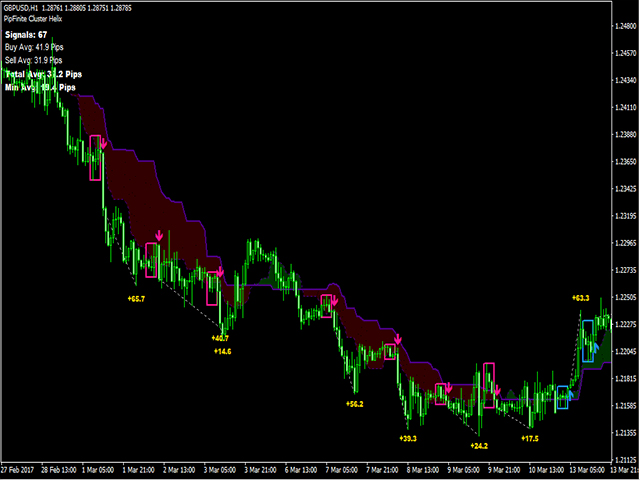
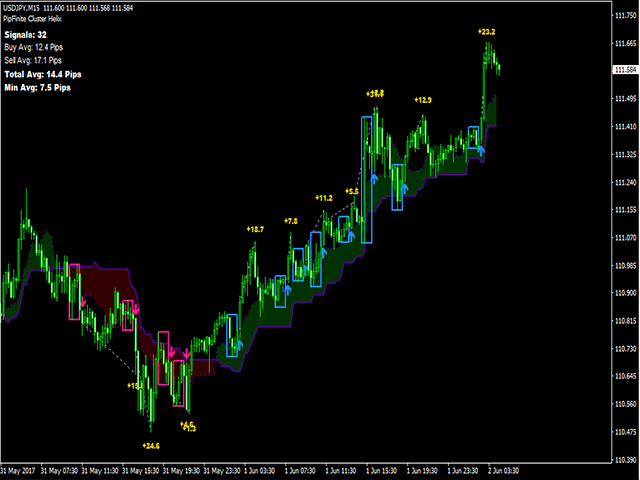
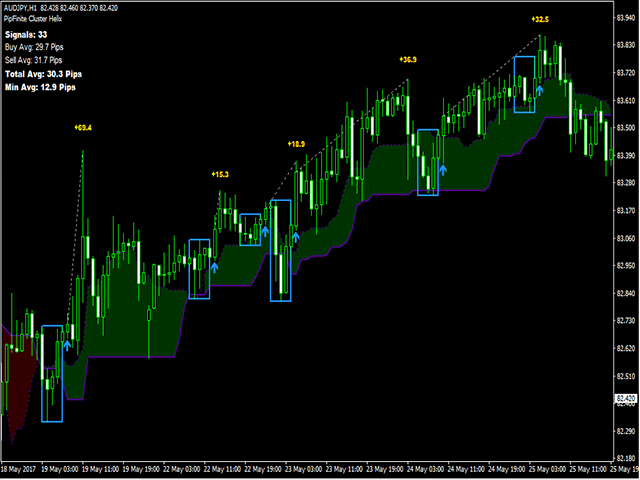
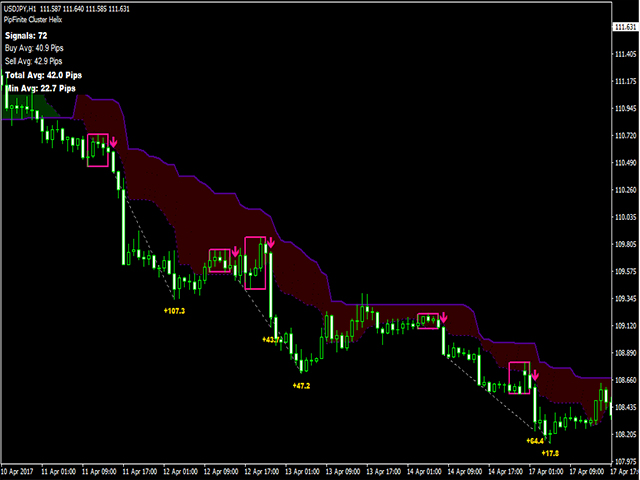
- Detects range breakouts on pullback zones in the direction of the trend
- Analyzes statistics of maximum profits and calculates possible targets for the next signal
- Flexible tool, can be used in many ways to improve a trading system
- StopLoss Levels
- Option 1: Range Levels
- Below blue range box for buy signal
- Above red box for sell signal
- Option 2: Statistical Data
- Buy Average Value for buy signal
- Sell Average Value for sell signal
- Option 3: Higher Value
- Compare Option 1 and Option 2, Select the Higher Value
- TakeProfit Levels
- Option 1: Standard TakeProfit
- Buy Average Value for buy signal
- Sell Average Value for sell signal
- Option 2: Quick Takeprofit for Scalping
- Minimum Average Value
- Avoid late range breakouts
- RSI value below 70 for buy signals
- RSI value above 30 for sell signals
- Avoid trend weakness
- Only take the first 3 consecutive signals in the direction of the trend
- It is best to avoid the 4th signal and wait for the pullback zone to change color or reset
- Please watch the video for better understanding (Click Here)
- Exit Strategy
- Exit will depend on traders discretion according to his/her strategy
- Support/Resistance Areas
- Reversal signals from price action patterns
- We can use Exit Scope as alternate exit strategy
- Supporting Tool
- Confirmation to price action trading
- Increase probabilities by combining to Strength Meter
- Avoid false signals by combining to Volume Critical
- Avoid buy signals if Volume Critical is Overbought
- Avoid sell signals if Volume Critical is Oversold
- Never repaints
- Never backpaints
- Never recalculates
- Signals strictly on the "Close of the bar"
- Compatible with Expert Advisor development
Day Trading Strategy (M15)
Buy Setup
- H4 Timeframe shows bullish pullback zone (green zone). Go to M15 timeframe for entries
- M15 Buy Signal
- Strength Meter Bullish Level 1 to Level 3 only (Use Period = 20 for settings)
- RSI is below 70
- Set your stoploss
- Option 1: Above the blue range box
- Option 2: Buy Average value
- Option 3: Select the higher value from Option 1 and 2
- Set yout takeprofit
- Option 1: Use average Buy Average value
- Option 2: For scalping, use Min Average value
Sell Setup
- H4 Timeframe shows bearish pullback zone (red zone). Go to M15 timeframe for entries
- M15 Sell Signal
- Strength Meter Bearish Level 1 or Level 3 only (Use Period = 20 for settings)
- RSI above 30
- Set your stoploss
- Option 1: Below the red range box
- Option 2: Sell Average value
- Option 3: Select the higher value from Option 1 and 2
- Set yout takeprofit
- Option 1: Use average Sell Average value
- Option 2: For scalping, use Min Average value
Scalping Strategy (M5)
Same as Day Trading Strategy but
- H1 as Higher Timeframe
- M5 as Entry Timeframe
- Strength Meter Period = 14 for settings
Swing Strategy (H1)
Same as Day Trading Strategy but
- D1 as Higher Timeframe
- H1 as Entry Timeframe
- Strength Meter Period = 7 for settings
Additional Guidelines
- Trade only London and US session for best breakout volatility
- Avoid signals 30 mins before and after major news releases
- Skip the 4th and succeeding signals. Wait for a reset to avoid trend weakness
Video References
Please Watch in High-Definition to further understand
- How it works (Click Here)
- How to trade (Click Here)
- How to avoid trend weakness (Click Here)
- Combining to Strength Meter (Click Here)
























Great indicator!