• Información general
  • Comentarios (1)
  • Discusión (22)
  • Novedades

ZLevels

Este indicador está basado en la metodología del Market Profile, que contiene el Z-Zone, a diferencia de este último, permite la visualización de múltiples marcos de tiempo en un mismo gráfico. 

Esta metodología ha mostrado ser muy efectiva para:

  • Disminuir el número de ventanas para analizar o hacer seguimiento a un activo.
  • Visualizar zonas importantes de resistencia (RoZ), soporte (SoZ) y distribución media (PoC) en diferentes periodos de tiempo. 
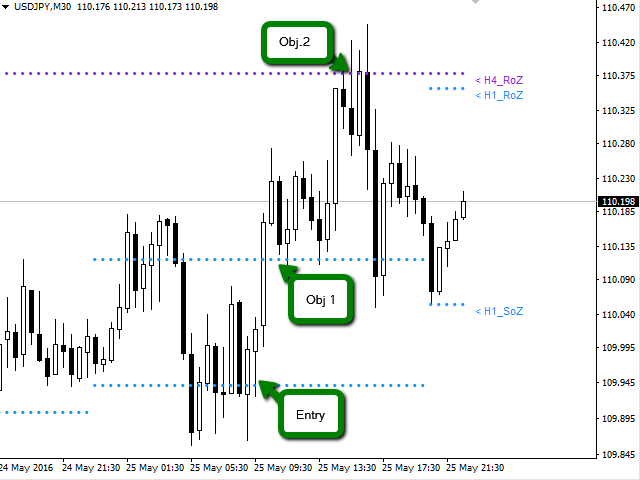
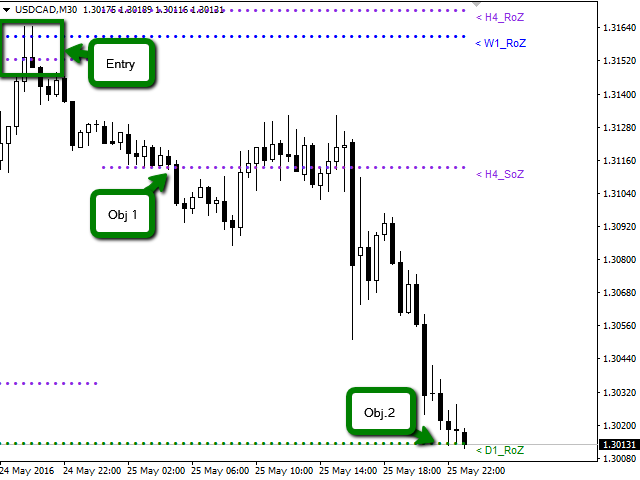
  • Definir zonas para tomar utilidades y ubicar stop lose técnicos. 

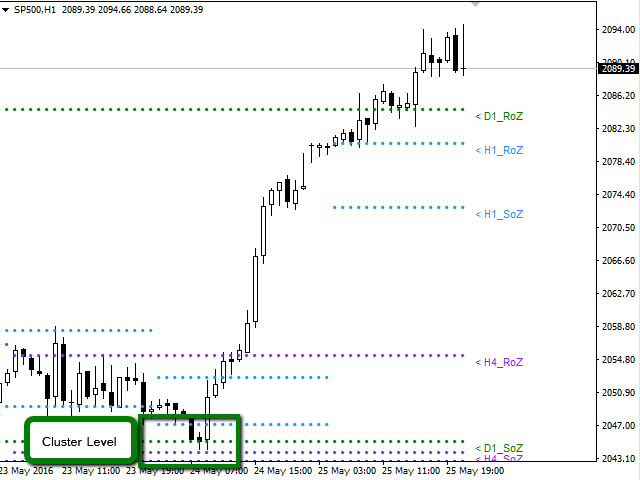
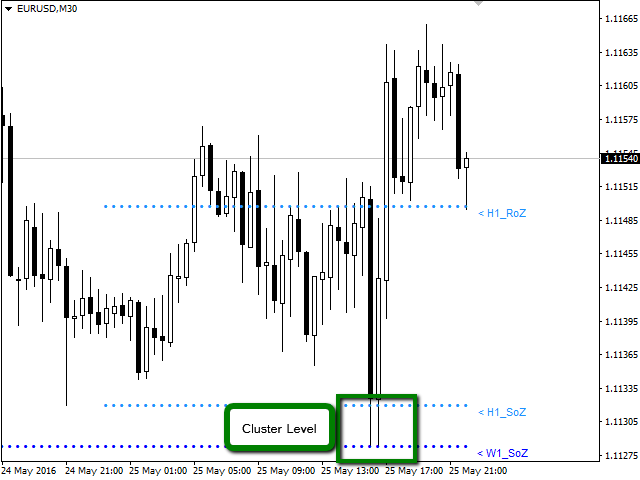
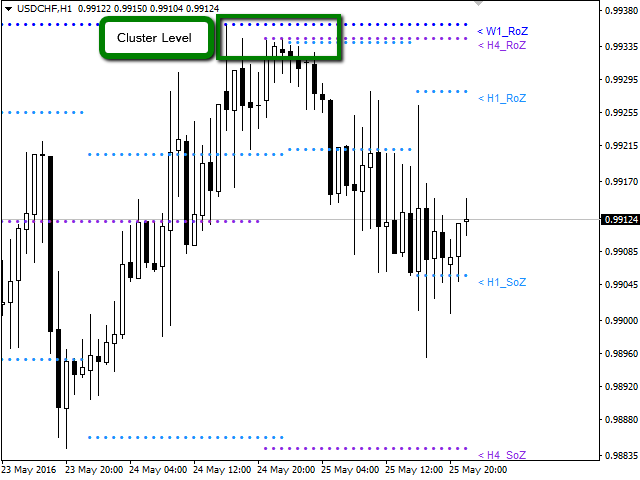
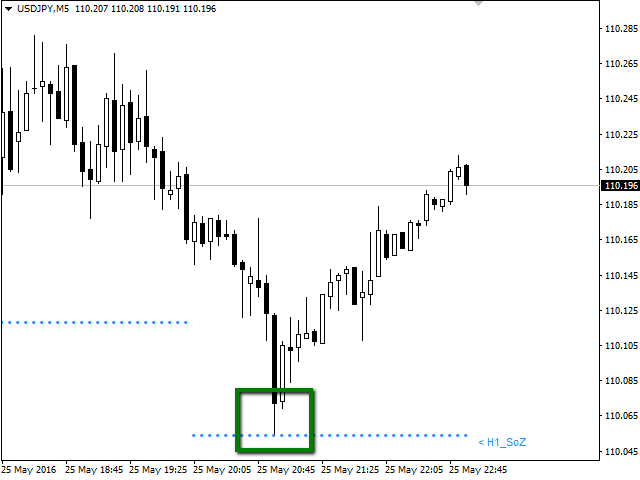
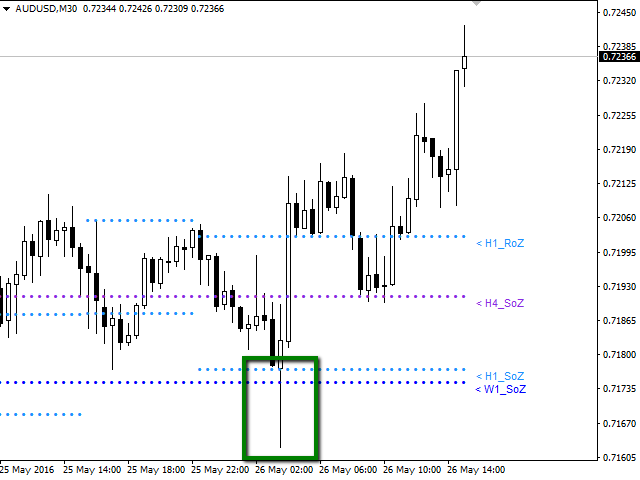
Los análisis realizados en el desarrollo de este indicador arrojan, que las zonas donde confluyen diferentes niveles (H1, H4, D1,W1 y MN) son zonas donde el precio reacciona, generando oportunidades de reversión de tendencia, pivots o plataformas de despegue (Movimientos verticales). Al tener conocimiento de esta información, el Trader tiene la ventaja y puede anticipar las oportunidades y estar listo para tomar acción en el mercado en el momento justo. 

Disponible para: Forex, CDFs, Acciones, Futuros y Materias Primas

Periodos de Tiempo: M5,M15,M30,H1,H4,D1,W1,MN 

Permite graficar en una misma ventana los periodos de: H1,H4,D1,W1,MN.   

El indicador esta optimizado, pensando en ayudar al Trader. Por esta razón solo graficará periodos iguales o mayores al de la ventana activa. Es decir si se encuentra en un periodo D1 solo se podrá observar en la ventana los periodos de W1 y MN1, omitiendo graficar los periodos de H1 y H4. 


 Parámetros del Indicador

  • Sector_A: Select Objects to Chart
  • H1_RoZ: Grafica la zona de resistencia (RoZ) para el marco H1. Por defecto es true.
  • H1_PoC: Grafica la zona de distribución media (PoC) para el marco H1. Por defecto es false.
  • H1_SoZ: Grafica la zona de soporte (SoZ) para el marco H1. Por defecto es true.
  • H4_RoZ: Grafica la zona de resistencia (RoZ) para el marco H4. Por defecto es true.
  • H4_PoC: Grafica la zona de distribución media (PoC) para el marco H4. Por defecto es false.
  • H4_SoZ: Grafica la zona de soporte (SoZ) para el marco H4. Por defecto es true.
  • D1_RoZ: Grafica la zona de resistencia (RoZ) para el marco D1. Por defecto es true.
  • D1_PoC: Grafica la zona de distribución media (PoC) para el marco D1. Por defecto es false.
  • D1_SoZ: Grafica la zona de soporte (SoZ) para el marco D1. Por defecto es true.
  • W1_RoZ: Grafica la zona de resistencia (RoZ) para el marco W1. Por defecto es true.
  • W1_PoC: Grafica la zona de distribución media (PoC) para el marco W1. Por defecto es false.
  • W1_SoZ: Grafica la zona de soporte (SoZ) para el marco W1. Por defecto es true.
  • MN_RoZ: Grafica la zona de resistencia (RoZ) para el marco MN. Por defecto es true.
  • MN_PoC: Grafica la zona de distribución media (PoC) para el marco MN. Por defecto es false.
  • MN_SoZ: Grafica la zona de soporte (SoZ) para el marco MN. Por defecto es true.
  • Sector_B: Select Inputs Parameters
  • Map: Este parámetro es utilizado para calcular las zonas de resistencia y soporte. Por defecto es 7.
  • Length: Este parámetro es utilizado para calcular las zona de volumen a precio. Por defecto es 5.
  • Signal: Este parámetro define la frecuencia para crear una nueva zona. Por defecto es 18.
  • Sector_C: Select Label to Chart
  • H1_Label: Permite deshabilitar la visualización en el gráfico de las etiquetas  H1_RoZ, H1_PoC, H1_SoZ.  Por defecto es true.
  • H4_Label: Permite deshabilitar la visualización en el gráfico de las etiquetas  H4_RoZ, H4_PoC, H4_SoZ.  Por defecto es true.
  • D1_Label: Permite deshabilitar la visualización en el gráfico de las etiquetas  D1_RoZ, D1_PoC, D1_SoZ.  Por defecto es true.
  • W1_Label: Permite deshabilitar la visualización en el gráfico de las etiquetas  W1_RoZ, W1_PoC, W1_SoZ.  Por defecto es true.
  • MN_Label: Permite deshabilitar la visualización en el gráfico de las etiquetas  MN_RoZ, MN_PoC, MN_SoZ.  Por defecto es true.
  • Sector_D: Select Parameters the Color and Width to Chart
  • Color_H1: Permite cambiar el color de los puntos en el gráfico.
  • Color_H4: Permite cambiar el color de los puntos en el gráfico. 
  • Color_D1: Permite cambiar el color de los puntos en el gráfico. 
  • Color_W1: Permite cambiar el color de los puntos en el gráfico. 
  • Color_MN: Permite cambiar el color de los puntos en el gráfico. 
  • Width_H1: Por defecto es 0.
  • Width_H4: Por defecto es 0.
  • Width_D1: Por defecto es 0.
  • Width_W1: Por defecto es 0.
  • Width_MN: Por defecto es 0.

Productos recomendados
VR Cub
Vladimir Pastushak
VR Cub es un indicador para obtener puntos de entrada de alta calidad. El indicador fue desarrollado para facilitar los cálculos matemáticos y simplificar la búsqueda de puntos de entrada a una posición. La estrategia comercial para la cual se diseñó el indicador ha demostrado su eficacia durante muchos años. La simplicidad de la estrategia comercial es su gran ventaja, que permite que incluso los operadores novatos negocien con éxito con ella. VR Cub calcula los puntos de apertura de posiciones
PABT Pattern Indicator - it's classical system one of the signal patterns. Indicator logic - the Hi & Lo of the bar is fully within the range of the preceding bar, look to trade them as pullback in trend. In the way if indicator found PABT pattern it's drawing two lines and arrow what showing trend way.  - First line - it's entry point and drawing at: 1. On the high of signal bar or on middle of the signal bar (depending from indicator mode) for buy; 2. On the low of signal bar or on middle of t
Noize Absorption Index MT4
Ekaterina Saltykova
5 (1)
Noize Absorption Index - is the manual trading system that measures the difference of pressure between bears forces and bulls forces. Green line - is a noize free index that showing curent situation. Zero value of index shows totally choppy/flat market.Values above zero level shows how powerfull bullish wave is and values below zero measures bearish forces.Up arrow appears on bearish market when it's ready to reverse, dn arrow appears on weak bullish market, as a result of reverse expectation. S
EZZ Elite Zig Zag is an indicator for the MetaTrader 4 terminal. This indicator traces the peak of the trend based on the market reversal, thus showing various opportunities in the financial market. EZZ Elite Zig Zag is a visual tool, intuitive, and easy to understand and use.  Test it Yourself by Downloading it for Free. Author Paulo Rocha all rights reserved
Infinity Trend Pro
Yaroslav Varankin
1 (1)
This is a trend indicator without redrawing Developed instead of the binary options strategy (by the color of the Martingale candlestick) Also works well in forex trading When to open trades (binary options) A signal will appear in the place with a candle signaling the current candle It is recommended to open a deal for one candle of the current timeframe M1 and M5 When a blue dot appears, open a deal up When a red dot appears, open a trade down. How to open trades on Forex. When a signal is rec
Trend Oscillator es un indicador avanzado personalizado de Crypto_Forex, ¡una herramienta de trading eficiente! - Se utiliza un nuevo método de cálculo avanzado: 20 opciones para el parámetro "Precio para el cálculo". - El oscilador más suave jamás desarrollado. - Color verde para tendencias alcistas, color rojo para tendencias bajistas. - Valores de sobreventa: por debajo de 5, valores de sobrecompra: por encima de 95. - Hay muchas oportunidades para mejorar incluso las estrategias estándar c
Introduction It is common practice for professional trades to hide their stop loss / take profit from their brokers. Either from keeping their strategy to the themselves or from the fear that their broker works against them. Using this indicator, the stop loss / take profit points will be drawn on the product chart using the bid price. So, you can see exactly when the price is hit and close it manually.  Usage Once attached to the chart, the indicator scans the open orders to attach lines for t
Indicador Crypto_Forex "Histograma de Corrección de Tendencia Principal" para MT4, sin repintado. - El indicador de Histograma de Corrección de Tendencia Principal fue diseñado para detectar grandes tendencias. - El indicador puede mostrarse en dos colores: rojo para tendencia bajista y azul para alcista (los colores se pueden cambiar). - Al menos 10 columnas consecutivas del mismo color en el histograma indican el inicio de una nueva tendencia. - El indicador cuenta con alertas integradas par
Insider Scalper Binary This tool is designed to trade binary options. for short temporary spends. to make a deal is worth the moment of receiving the signal and only 1 candle if it is m1 then only for a minute and so in accordance with the timeframe. for better results, you need to select well-volatile charts.... recommended currency pairs eur | usd, usd | jpy .... the indicator is already configured, you just have to add it to the chart and trade .... The indicator signals the next candle.
Binary Options Support Resistance Indicator This indicator is designed for binary options trading and effectively shows retracements from support and resistance levels. Signals appear on the current candle. A red arrow pointing downwards indicates a potential selling opportunity, while a blue arrow pointing upwards suggests buying opportunities. All that needs adjustment is the color of the signal arrows. It is recommended to use it on the M1-M5 timeframes as signals are frequent on these timef
Towers
Yvan Musatov
Towers - Trend indicator, shows signals, can be used with optimal risk ratio. It uses reliable algorithms in its calculations. Shows favorable moments for entering the market with arrows, that is, using the indicator is quite simple. It combines several filters to display market entry arrows on the chart. Given this circumstance, a speculator can study the history of the instrument's signals and evaluate its effectiveness. As you can see, trading with such an indicator is easy. I waited for an a
Smart indicator Smart trend allows you to find the most likely trend reversal points. You will not find this indicator anywhere else. A simple but effective system for determining the forex trend. From the screenshots you can see for yourself the accuracy of this tool. Works on all currency pairs, stocks, raw materials, cryptocurrencies. This is a trend indicator for the MetaTrader 4 trading platform. The alert system (alert, email notifications) will help you monitor several trading instrumen
Introducing the "Extreme Exhaustion Levels": A powerful tool for traders looking to identify market exhaustion and potential trend reversals. The Exhaustion Indicator is an advanced technical analysis tool that helps traders identify when markets are overbought or oversold, potentially indicating an imminent reversal in the trend. With a unique combination of price action, moving averages, and Bollinger Bands, the Exhaustion Indicator provides traders with a comprehensive view of market condit
Alpha Trend sign has been a very popular trading tool in our company for a long time. It can verify our trading system and clearly indicate trading signals, and the signals will not drift. Main functions: Based on the market display of active areas, indicators can be used to intuitively determine whether the current market trend belongs to a trend market or a volatile market. And enter the market according to the indicator arrows, with green arrows indicating buy and red arrows indicating se
RSI Speed mp
DMITRII GRIDASOV
Indicador Crypto_Forex "RSI SPEED" para MT4: una excelente herramienta predictiva, sin necesidad de repintado. - El cálculo de este indicador se basa en ecuaciones físicas. RSI SPEED es la primera derivada del propio RSI. - RSI SPEED es ideal para realizar scalping en la dirección de la tendencia principal. - Úselo en combinación con un indicador de tendencia adecuado, por ejemplo, HTF MA (como se muestra en las imágenes). - El indicador RSI SPEED muestra la rapidez con la que el RSI cambia de
For sure, this indicator has become very popular amongst traders. Through coding this indicator will give you the most accurate levels possible for your trading analysis. We have also added in the ability for you to receive alerts when the price breaks above or below a Support or Resistance lines! HOW TO USE The red rectangles represent your resistance/supply zone. The green rectangles represent your support/demand zone.  BONUS FEATURES We coded this indicator with the ability to switch between
Prophet
Andriy Sydoruk
Prophet is a trend indicator. Shows the direction of turning points. Can be used with an optimal risk-to-profit ratio. The arrows indicate favorable moments and directions for entering the market. Uses one parameter for setting (adjust from 1 to 3). The probability of a successful trend is very high. In the course of work, the take-profit is much larger than the stop-loss! Works on all currency pairs and on all timeframes.
SRP Pro
Farhad Kia
5 (1)
Strong Retracement Points Pro edition! SRP (Strong Retracement/Reversal Points) is a powerful and unique support and resistance indicator. It displays the closest important levels which we expect the price retracement/reversal! If all level are broken from one side, it recalculates and draws new support and resistance levels, so the levels might be valid for several days depending on the market! If you are still hesitating to start using this wonderful tool, you can check this link to see how ef
The Th3Eng PipFinite indicator is based on a very excellent analysis of the right trend direction with perfect custom algorithms. It show the true direction and the best point to start trading. With StopLoss point and Three Take Profit points. Also it show the right pivot of the price and small points to order to replace the dynamic support and resistance channel, Which surrounds the price. And Finally it draws a very helpful Box on the left side on the chart includes (take profits and Stop loss
Renko, Heiken Ashi, Ticks Bar, Range Bar.    Easy switching, easy setup, all in one window.        Place the Custom Chart indicator and view Renko, Heiken Ashi, Tick bar, Range bar charts in real time at real chart.    Position the offline chart window so that the indicator control panel is visible.    Switch the chart mode by click of a button.    Connect to the output chart any indicator, expert advisor without any restrictions.    No, it doesn't work in the tester.    Yes, you can use an
ReboltDelta
David Theodore Caro-greene
Es más común que la relación entre dos símbolos sea probable y que el grado de cambio de precio esperado sea pequeño. Es raro que la alta probabilidad de un cambio de precio esperado de la acción en otro mercado coincida con un alto valor de cambio de precio esperado de otro mercado. Cuando las señales Rebolt Probability y Rebolt Delta coinciden, el operador tiene el beneficio de la probabilidad y la rentabilidad. 
Stratos Pali
Michela Russo
5 (3)
Stratos Pali Indicator   is a revolutionary tool designed to enhance your trading strategy by accurately identifying market trends. This sophisticated indicator uses a unique algorithm to generate a complete histogram, which records when the trend is Long or Short. When a trend reversal occurs, an arrow appears, indicating the new direction of the trend. Important Information Revealed Leave a review and contact me via mql5 message to receive My Top 5 set files for Stratos Pali at no cost! Dow
El indicador SMC Venom Model BPR es una herramienta profesional para operadores que trabajan con el concepto de Dinero Inteligente (SMC). Identifica automáticamente dos patrones clave en el gráfico de precios: FVG   (Fair Value Gap) es una combinación de tres velas, con un gap entre la primera y la tercera. Forma una zona entre niveles donde no hay soporte de volumen, lo que suele provocar una corrección del precio. BPR   (Balanced Price Range) es una combinación de dos patrones FVG que forman
Master Scalping M1 es un indicador innovador que utiliza un algoritmo para determinar la tendencia de forma rápida y precisa. El indicador calcula el tiempo de apertura y cierre de posiciones, los algoritmos del indicador le permiten encontrar los momentos ideales para ingresar a una operación (comprar o vender un activo), lo que aumenta el éxito de las transacciones para la mayoría de los comerciantes. Beneficios del indicador: Fácil de usar, no sobrecarga el gráfico con información innecesari
ProTrading Arrow
Nedyalka Zhelyazkova
5 (1)
" A NEW TRADING METHOD… AN AMAZING TRADING INDICATOR! " Additional Bonus : You get the Forex Trend Commander indicator for FREE! It should not be forgotten that trading is not an event, but a process. This process has no end, i.e. it should never stop completely and completely. To lock in a profit from market movements you need to implement the strategy in practice, in most cases it takes much longer than planning it. ProTrading Arrow indicator is an advanced reversal system that can be played
Owl smart levels
Sergey Ermolov
4.24 (37)
Versión MT5  |   FAQ El   Indicador Owl Smart Levels   es un sistema comercial completo dentro de un indicador que incluye herramientas de análisis de mercado tan populares como   los fractales avanzados de Bill Williams , Valable ZigZag que construye   la estructura de onda correcta   del mercado y   los niveles de Fibonacci   que marcan los niveles exactos de entrada. en el mercado y lugares para tomar ganancias. Descripción detallada de la estrategia Instrucciones para trabajar con el indi
ReboltP
David Theodore Caro-greene
La tecnología de superposición de reequilibrio (Rebolt) permite al operador visualizar el flujo de dinero de un gráfico a otro. Probabilidad de Rebolt indica la probabilidad de que el dinero haya fluido de un gráfico a otro durante un período de tiempo específico durante una serie de intervalos especificados por el usuario. Cuando Rebolt lee Cyan o Blue, estos son signos de compra válidos durante el tiempo especificado por el usuario o hasta que surja una señal conflictiva. Cuando Rebolt lee Vio
Capernaum
Andriy Sydoruk
Visually, Capernaum, on the chart, appears as small arrows indicating the direction of the trend movement and the opening of trading positions. The appearance of a blue up arrow indicates that the market is beginning to rise and it is time to buy. And the appearance of a red down arrow means that the market is falling and it is high time to sell. When a suitable moment for buying appears, the indicator generates a signal exactly at the moment of its appearance and not below or above the current
Trade with Gann on your side!! MASTER CIRCLE 360 CIRCLE CHART, originally created by Gann admitted that this is “The Mother of all charts”. It is one of the last studies that this great trader left for us. The numeric tab le is apparently quite simple like all the tables and is based on square numbers, the SQUARE OF 12 and is by evolution, one of the most important square numbers. Here we can find CYCLE, PRICE AND TIME thanks to angles and grades, to show past and future support and resistance.
Alpha Trend
Evgeny Belyaev
3.33 (3)
Alpha Trend is a trend indicator for the MetaTrader 4 platform; it has been developed by a group of professional traders. The Alpha Trend indicator finds the most probable tendency reversal points, which allows making trades at the very beginning of a trend. This indicator features notifications, which are generated whenever a new signal appears (alert, email, push-notification). This allows you to open a position in a timely manner. Alpha Trend does not redraw, which makes it possible to evalua
Los compradores de este producto también adquieren
Cycle Maestro
Stefano Frisetti
NOTE: CYCLEMAESTRO is distributed only on this website, there are no other distributors. Demo version is for reference only and is not supported. Full versione is perfectly functional and it is supported CYCLEMAESTRO , the first and only indicator of Cyclic Analysis, useful for giving signals of TRADING, BUY, SELL, STOP LOSS, ADDING. Created on the logic of Serghei Istrati and programmed by Stefano Frisetti ; CYCLEMAESTRO is not an indicator like the others, the challenge was to interpret only t
Hit Rate Top Bottom Signal
Martin Alejandro Bamonte
Hit Rate Top Bottom Signal Hit Rate Top Bottom Signal ofrece un enfoque totalmente innovador. Es ideal para quienes buscan evaluar de antemano cómo funciona la señal con un TP-SL específico, y en qué PARES/TF tiene mejores desempeños. La estrategia Hit Rate Top Bottom Signal es una herramienta fundamental para cualquier trader y tipo de trading porque no solo emite señales precisas sin repintar , indicando claramente cuándo operar y en qué dirección, sino que además lleva un registro detallado
Bomb Bank Signal
Igor Pereira Calil
5 (1)
Señal de Bomb Bank: su indicador de confianza en MetaTrader 4 Bomb Bank Signal es un poderoso indicador para MetaTrader 4, diseñado para identificar las tendencias más relevantes en el mercado financiero. Si buscas una herramienta que anticipe los movimientos con precisión, el Bomb Bank es el aliado que necesitas. Cómo funciona: Este indicador combina tres métodos distintos (análisis de volumen, cierre de velas y tendencia simétrica) para detectar y señalar oportunidades de compra y venta. B
This is a mini version(One pair) of Advanced Detector of Trend Reversal and Continuance known as TrueTrendStarM(TTSm25). It is a sensitive and Predictive indicator of Price Trends for Professional traders. ( WEEKEND DISCOUNT 15% OFF !!! )( ATTENTION BUYERS:- PLEASE CONTACT ME FOR HOW BEST TO USE THE INDICATOR FOR MAXIMUM PROFITS )    It detects high odds changes in Price Trend direction long before other indicator detects it. I have been working on it since 2019.    This is possible due to f
Trade Invest Pro - Boss in the world of cryptocurrency! This indicator is ideal for cryptocurrency trading! Work on Trade Invest Pro took us half a year! But not in vain! Now only accurate signals near support - resistance levels! He showed himself well on timeframes m5 m15 for binary options! Optionally, it can be configured for forex for timeframes m30 and more! Reacts well to news! Doesn't paint! and does not disappear from the schedule! As soon as a red arrow appears, open a deal fo
ZO Trend
Trung Le Hoang
4 (4)
Important!! ZO Trend can't work on MN timeframe. /*--------------------------------------------------------------------------------------------------------------------------------------------------------------------------------------------- ZO Trend an indicator used to search for entry point. With the session candle algorithm on many timeframe, ZO Trend creates an area for traders find good Entry Point. ZO SYSTEM BASIC SETUP :  https://www.youtube.com/watch?v=qdNOXHWozNw ZO TREND User guide : 
La VELOCIDAD DE TRANSACCIÓN es el indicador de mayor calidad que muestra dónde y cuándo se acumulan grandes órdenes en el mercado y los beneficios de ello. Detecta los cambios de tendencia en una fase muy temprana. Es a la vez un indicador y un sistema de trading. El concepto es único e increíblemente rentable. En Forex, el volumen de ticks se denomina engañosamente volumen. En realidad, se trata de la variación del precio por unidad de tiempo, que de hecho es la VELOCIDAD DE TRANSACCIÓN. Este
Dark Sniper
Dmitriy Kashevich
Dark Sniper pointer indicator.  Complete absence of redrawing   The percentage of correct indicator forecasts depends on your settings; the default is period 7 (performed better) The arrow indicates the direction of the next candle and the possible direction of the trend in the future.  Suitable for small timeframes m1 and m5  It is recommended to open transactions from 1 to 2 candles.  The signal appears on the current candle. Open a trade on the next one since the signal is being generat
Hello Dear Trader, Today Im Telling You About The "Golden Scalp System V1 " Metatrader4 Golden Scalp System Scalper with EMA   This is a  Scalper strategy   based on ( Exponential moving average) EMA . Time frame: H1 Pair: EUR/USD, GBP/USD,AUD/USD XAU/USD Platform Mt4   Indicators for Scalper with Ema: 300  EMA (Exponential Moving Average) ; 500 EMA (Expontial Moving Average); Stochastic   (5,3,3)   Long Entry 1) 300  EMA   > 500  EMA . 2) Find significant levels of support. 3) Wait for the c
Magic M2
Tuan Anh Dao
4.5 (8)
------ GOOD LUCK   -----   (Telegram: @MagicBinary) The indicator allows you to trade binary options. T his indicator give high winning ratio with over 20 years of backtesting  The recommended time frame is М1 and the expiration time is 3, 5 minutes. The indicator suitable for Auto and Manual trading. A possible signal is specified as a arrows above/under a candle. You can entry current candle /intrabar or can wait until candle close Arrows are not re-painted Trade sessions: Any/ Rec
Risk Reward ratio indicator for MT4  BING Risk Reward indicator is a powerful, basic, very needed tool for every trader. Clearly visualize Open Price , Stop Loss , and Top Profit levels on your graphs with easy-to-see colors and trendlines. Does BING Risk Reward show alerts? Of course! BING Risk Reward Indicator offers all Alerts available for the MT4 platform(Email, Popups, Sound, and Push). It shows alerts on Open Price , Stop Loss , and Top Profit. That way, besides easily seeing what is go
Automatic, live & interactive picture of all trendlines. Assign push, email and sound alerts to the lines of your choice and be informed about price rollback, breakout, rollback after breakout, number of rollbacks, line expiration by double breakout. Correct, drag or delete the lines and interactively tune the line system. https://youtu.be/EJUo9pYiHFA . Chart examples https: //www.mql5.com/en/users/efficientforex Price Interaction Events All events are effective immediately and only after one
The indicator displays the probable ( Support and resistance ) levels. The indicator draws horizontal and trend levels of support and resistance. The indicator settings: Trends - the mode for displaying trend lines or horizontal lines of support and resistance Yes - display trend lines only No - display horizontal lines only UseResource - use the resources built into the indicator. Yes - use the ZigZag indicator from the resources of the product. No - use a custom ZigZag indicator. HistoryBar -
The indicator of a Professional Trader is an arrow indicator for predicting the direction of price movement. I have been working on this indicator since 2014. You can use this indicator as your main indicator, use its entry signals, and use it as your only indicator to find entry points. About the product: Recommended TF [H4-D1-W1]   . The indicator predicts the direction of the next candle. Fits a variety of tools; Flexibility in settings for different instruments and intervals through the MO
The [GRAFF] III manual trading system is based on multiple MetaTrader (MT4) indicators. Together, the entire PACK of GRAFF III indicators makes an advanced trading tool. The system consists of over 20 different custom-built indicators which have been carefully selected and tested in the long term to produce strong and efficient trading signals. The particular indicators are based on different mathematical formulas, so the entire system is calibrated to remove false signals from its own indicator
This indicator allows you to see the strength of the trend on all timeframes. It can be used for all currency pairs. The indicator can be displayed in the form of a column (from left to right): status buy / sell / strong buy / strong sell, strength of the trend in percentage, pips last candle, body candle now, remaining time, and the timeframe of M1 to MN. Information contained below (from left to right): total trend percent, sell percent, buy percent.
You can fins our other products from link : https://www.mql5.com/en/users/drbastem/seller   Also, you can ask all your questins from email : haskayafx@gmail.com or mobile : +90 530 867 5076 or @MehmetBastem    on telegram application This indicator is used to determine the trend. Standard Osma indicator is used. It has the indicator warning system: beep, e-mail and has three types of alerts, including messages to mobile phone. It shows the best performance on the chart of 5 minutes. When the
You can fins our other products from link : https://www.mql5.com/en/users/drbastem/seller   Also, you can ask all your questins from email : haskayafx@gmail.com or mobile : +90 530 867 5076 or @MehmetBastem    on telegram application This indicator is used to determine the trend. Standard Three Moving Average and ADX indicators are used. It has the indicator warning system (audio, e-mail) and three types of alerts, including messages to mobile phone. It shows the best performance on M5. When
This indicator is used to determine the trend. Standard Three Moving Average and ADX indicators are used. It has the indicator warning system (audio, e-mail) and three types of alerts, including messages to mobile phone. It shows the best performance on M5. When the trend value reaches the value set, the warning system is activated. This indicator works only with Forex symbols. Inputs SoundAlarm = true - Sound Alert Sendmail=true - Send an e-mail in case of a buy or sell signal Sendnotification
You can fins our other products from link : https://www.mql5.com/en/users/drbastem/seller   Also, you can ask all your questins from email : haskayafx@gmail.com or mobile : +90 530 867 5076 or @MehmetBastem    on telegram application This indicator is used to determine the trend. Standard MACD indicator is used. It has the indicator warning system: beep, e-mail and has three types of alerts, including messages to mobile phone. It shows the best performance on the chart of 5 minutes. When the
Smooth price for Monarch MT4
Konstantin Gruzdev
3.67 (3)
The Smooth Price technical indicator is used for plotting a smoothed line as close to the price of the financial instrument as possible, and serves to eliminate its noise components. The indicator is part of the Monarch trading system, but here it is presented as an independent technical analysis tool. The indicator is based on the cluster digital filter , which, unlike the ClusterSMA , is applied directly to the price time series. Smooth Price does not redraw (except the very last, zero bar) an
A simplistic indicator informing a user on RSI divergence by sending messages to mobile device and email. The indicator draws 2 vertical lines, marking two RSI extrema that formed the divergence. You get the alert, open the charts and make a decision. The indicator does not show past divergences, thus when you attach it to a chart for the first time you see nothing. Graphics and alerts will appear as soon as divergences do. Drop it in Tester to see how it works. Parameters: RSIPeriod - number of
Pan PrizMA CD Phase is an analogue of the МetaТrader 5 indicator , and is an option based on the Pan PrizMA indicator. Details . Averaging by a quadric-quartic polynomial increases the smoothness of lines, adds momentum and rhythm. Extrapolation by the sinusoid function near a constant allows adjusting the delay or lead of signals. The value of the phase - wave status parameter (which is close in meaning to the trigonometric phase or the angle of the radius-vector rotation in the trigonometric p
Green Wall Arrows
Daniel Luchinger
1 (1)
El Nombre Green_Wall_Arrows : Usando un Tp pequeño y mucho free margin, nos da la oportunidad de generar una muralla verde de profits que van saliendo, a medida que vamos tomando TP. Sin necesidad de usar SL para equilibrar los Tp pequeños de salida. Esta estrategia es una forma de operar los mercados, creada por mi y el indicador tan solo una herramienta mas. Puede ser Usado en Binarios. Este indicador Funciona en Barras Abiertas, Las flechas desaparecen si el mercado en contra de las flechas.
Golden Monowave
Ahmed Mohamed Ali
Golden Monowave is monowave indicator, the monowave theory is one of Elliott wave approach and one of most complicate and accurate method. Golden Monowave can shortcut many major steps to identify and describe the monowave. It works on any timeframe and with any trading instrument, including currencies, indices, futures, etc. Input Parameters initial_Bars - set the initial number of bars to calculate. wave_color - select the color of the wave. label_color - select the color of labels. temp_labe
Shark Surfer is a new generation indicator applying a well-established trend-following trading. The product is good both for scalping, as well as medium- and long-term trading. Shark Surfer analyzes a selected symbol and shows the recommended market entry, take profit and stop loss levels. Shark Surfer trades on all symbols and timeframes. It also features email and push notifications concerning the new trading signals. The indicator searches for suitable market entry points on an already formed
Ticks Size
Viktor Kolmakov
This indicator displays in a separate window the difference between the number of points which increased the price, and the number of points that decreased the price during the time interval specified in the settings. The time interval for calculation is expressed as the number of bars of the chart the indicator is attached to. This approach allows you to evaluate the movement direction (growth or fall) of the instrument's price, the strength of the movement and the size of the movement in point
NostradamusMT4
Andrey Spiridonov
1 (1)
NostradamusMT4 is a powerful indicator from the set of professional trader. The indicator is based on Andrei Spiridonov's original price calculation method (ESTIMATED PRICE) for the current candle price. Advantages The indicator does not redraw. It works on any timeframes. Works with any trading instruments. Perfectly suitable for scalping and trading binary options. Parameters Color - color of the ESTIMATED PRICE FUTURE line. How to work with the indicator The indicator forms the ESTIMATED P
BinaryIndicator
Andrey Spiridonov
BinaryIndicator is a highly accurate indicator for trading binary options. It shows excellent results in scalping. This indicator is based in multifactor analysis of trend indicators, as well as confirmation oscillators, which in the end gives an increased accuracy of signals. Advantages of the indicator Increased accuracy of signals. Excellent results when trading binary options with a short expiration time from M30 to M1 . It works on any timeframes. Works with any trade symbols. Parameters
Otros productos de este autor
ZBeatZone
Sergio Andres Zuleta Lopez
5 (1)
El Z-Beat Zone hace parte de una suit de 4 indicadores llamada las Z-Tools Black que puedes comprar por separado en el Market MetaTrader. El Z-Beat Zone se muestra como dos líneas. La línea principal se llama SlowK. La segunda línea, llamada SlowD. La línea SlowK se muestra como una línea sólida gruesa y la línea SlowD se muestra como una línea solida delgada. Hay varias maneras de interpretar el Z-Beat Zone. Los tres métodos populares son: Comprar cuando el Z-Beat Zone (La línea SlowK) cae por
ZCompass
Sergio Andres Zuleta Lopez
El Z-Compass hace parte de una suit de 4 indicadores llamada las Z-Tools Black que puedes comprar por separado en el Market MetaTrader. El Z – Compass es uno de los indicadores más importantes, ya que sirve de brújula en el mercado y está compuesto por los siguientes elementos: Un histograma y una línea cero. El histograma se grafica con cada vela y varía según el marco de tiempo seleccionado. Cuando el histograma se encuentra por arriba de la línea cero, decimos que la tendencia ó el momentum e
ZZone
Sergio Andres Zuleta Lopez
El Z-Zone hace parte de una suit de 4 indicadores llamada las Z-Tools Black que puedes comprar por separado en el Market MetaTrader. El Z-Zone esta basado en el Perfil del Mercado (Market Profile) y está compuesto por 3 líneas dinámicas: En la parte superior se encuentra la Zona de Resistencia, que identificaremos como el RoZ . En el centro encontraremos la distribución media de la zona que identificaremos como el PoC . En la parte inferior se encuentra la zona de soporte que identificaremos co
Filtro:
francesco12
99
francesco12 2022.10.15 07:33 
 

Molto buono

Respuesta al comentario
Versión 2.0 2018.06.13
1. Fixed some bugs present in the indicator.
2. The default display of the PoC is enabled.
3. Valid for H1, H4, D1, W1, MN.