PipsFactoryMonthlyDemo
- Indicadores
- Alfred Kamal
- Versión: 3.0
- Actualizado: 3 diciembre 2021
This is Demo Version of PipsFactoryMonthly
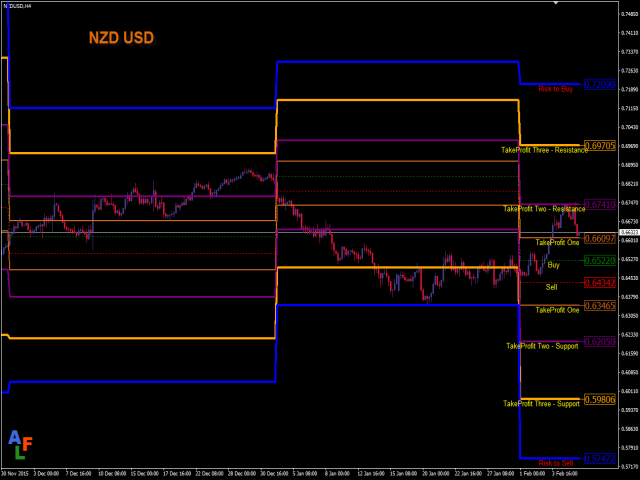
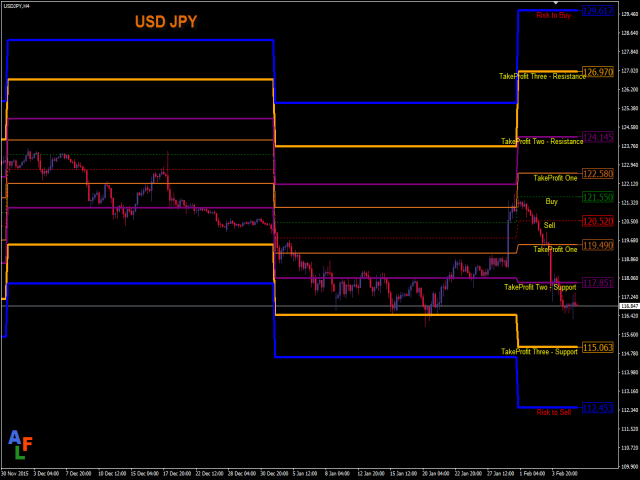
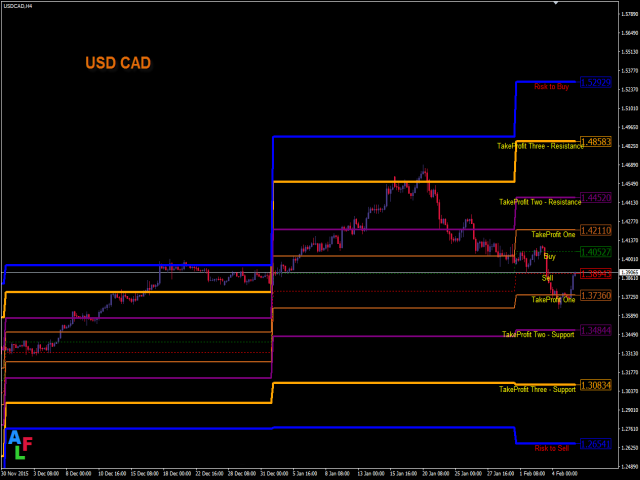
This indicator depends on High and Low price of Currency in last Month and then i made some secret equations to draw 10 lines.
Features
- You will know what exactly price you should enter the market.
- You will know when to be out of market.
- You will know you what should you do in market:
- Buy
- Sell
- Take profit and there are 3 levels to take your profit
- Support
- Resistance
- Risk to buy
- Risk to Sell
Signal Types and Timeframe Used
- You can use this indicator just on H4 timeframe and you have to download the historical data of MN timeframe.
- Enter buy order in case the price is at buy line and there are 3 levels to take your profit
- First level is take profit.
- Second level is take profit too but it is also Resistance.
- Third level is take profit too but it is also Resistance.
- The fourth line is Risk to enter market with buy order.
- Enter sell order in case price at sell line and there are 3 levels to take your profit
- First level is take profit.
- Second level is take profit too but it is also Support
- Third level is take profit too but it is also Support.
- The fourth line is Risk to enter market with sell order.
- Currency: It works on EUR/USD because it is Demo Version but full version works on all currency pair
- It is very easy to use.
El usuario no ha dejado ningún comentario para su valoración