Versión 4.4
2024.04.22
The indicator is recompiled in MT5 build 4275.
Versión 4.3
2024.01.27
The indicator is recompiled in MT5 build 4153.
Versión 4.2
2023.05.23
The indicator is recompiled in MT5 build 3742.
Versión 4.1
2022.12.07
The indicator is recompiled in MT5 build 3531.
Versión 4.0
2022.10.19
Fixed the error of drawing profiles in the opposite direction (in the manual mode of placing profiles using rectangles).
Versión 3.9
2022.05.11
The indicator is recompiled in MT5 build 3285.
Versión 3.8
2021.11.17
The indicator is recompiled in MT5 build 3091.
Versión 3.7
2021.07.06
Using the input variable MainPanelDisappear user can disable the disappearance of the indicator control panel.
Versión 3.6
2021.03.31
The indicator is recompiled in MT5 build 2860.
Versión 3.5
2020.12.01
The indicator is recompiled in MT5 build 2715.
Versión 3.4
2020.10.13
Improved algorithm for checking synchronization of the terminal history with the server history.
The indicator is compiled in MT5 build 2650.
Versión 3.3
2020.06.11
Fixed error of settings of priority OBJPROP_ZORDER.
The indicator is recompiled in MT5 build 2485.
Versión 3.2
2020.05.24
Added display of bars of opening/closing prices of profiles.
The button BV now has several modes:
1. The profile border is disabled, and the value area is marked with strokes.
2. The profile border is disabled, and the value area is marked with border.
3. The profile border is enabled, and the value area is marked with border.
Versión 3.1
2019.11.04
The button PE (Poc extend) has several modes:
1. Display POC levels.
2. Display VAL and VAH levels.
3. Display VAL, VAH and POC levels.
Versión 3.0
2019.10.21
Added the function of accelerated calculation of volume profiles.
The input variable VolumeProfileCalculation has two states:
Normal - normal algorithm for calculating volume profiles.
Fast - accelerated algorithm for calculating volume profiles, with some loss of quality for Delta and MathOI modes on timeframes from H1 and above.
Versión 2.9
2018.07.09
Fixed incorrect coloring of the price area and POC level, when using the TPO profile display mode with the fixed chart scale.
Versión 2.8
2018.05.04
For the summary profile, it is possible to enter the start and end number of the candle instead of the start and end date/time.
Any value not exceeding 1440 will be perceived by the indicator not as a date/time, but as a pointer to the candle number.
Note: the candles are numbered from right to left, starting with one. Accordingly, the number of the initial candle is always greater than the number of the final candle.
Versión 2.7
2018.04.26
Added a new mode - the classic profile.
Added the RS (reset) button to reset the indicator parameters to their default values.
Added the RT (remaining timeframes) button to apply the indicator parameters from the current timeframe to all other timeframes.
Optimized the algorithm for plotting the profiles to improve its operation speed.
Versión 2.6
2018.04.17
Added the "Period" field for adding an arbitrary period for profile following, from right to left, starting from the current candle.
Added the "PE" button (POC extend), which enables/disables the display of horizontal lines as continuations of POC levels, from left to right, until the intersection with the price chart.
Added the "PA" (POC alert) button, which enables/disables showing signals in Alert boxes in case the price touches any POC level. The signal is generated only for POC levels that had not been previously covered by the price chart.
Note: when installing this version of the indicator, it is necessary to delete all files from the terminal folder …MQL5/Files/AnyProfile.
Versión 2.5
2018.04.09
The indicator management has been moved to buttons.
The pop-up button of the main menu is located in the lower right corner of the chart. It is divided into two halves - pressing on the left half changes the group of control buttons, pressing the right half changes the group of text boxes for entering parameters.
Versión 2.4
2017.12.01
Restored the operability of the ProfileMode input variable for mass modification of profile display modes.
Versión 2.3
2017.10.19
Profile display method can be changed by a double click on a text below the profile.
The indicator remembers selected values separately for each profile of each timeframe.
Versión 2.2
2017.09.13
Modified the startup algorithm of the indicator during the first start of the terminal, for cases when the new candles of quotes history have not been loaded yet.
Versión 2.1
2017.06.15
Price area calculation method is set using the ProfileAreaMode variable, it has two options: AreaOfPocND - mathematical normal distribution based on the POC level, AreaOfTotalVolume - distribution based on the amount of total volume traded in the profile.
The ProfileRectanglePrefix input variable sets the name prefix of the rectangle that will be used by the indicator as a reference.
Versión 2.0
2017.06.06
Displaying the profile as a thin line is now available for all modes. It can be activated using the ProfileLineDrawing input parameter. Width of the line is set using the ProfileLineWidth input parameter.
Versión 1.9
2017.05.18
Fixed an error of a double drawing of labels on profile clusters when changing the vertical chart scale or modifying the time length of the profiles.
Now, in the ProfileAutoSet mode, the last (not closed) profile develops in real time, not at each candlestick opening.
Versión 1.8
2017.03.28
In version 1.8, added the function for automatic placement of profiles - ProfileAutoSet. Using this function allows scrolling the chart in history. The profiles cannot be edited manually in this mode. When this feature is disabled, the profiles are placed in the same location where (and if) they had been created before.
In addition, the indicator displays the volume of each profile as a histogram column at the lower border of the chart window. The column height is automatically adjusted in the aggregate comparison with the volumes of other profiles present on the chart. The display of the volume columns is activated using the VolumeVisible input variable. This function is not performed for the summary profile.
Versión 1.7
2017.02.24
Added multiple new features in the version 1.7:
1. Mode of displaying the profile in the form of two lines, separately for buy and sell volumes. In a sense, such display method represents a graph of supply and demand.
2. Mode of open interest, mathematically obtained by successively zeroing the mutually exclusive volumes. Only the volumes not affected by this operation are displayed in the profile. This function is not performed for the summary profile.
3. The indicator calculates the resulting profile of the balance. The balance is displayed by one number below the profile and it represents the ratio between the buy and sell volumes.
The value of balance is always not less than one. For example, if the balance value is 1.18 and the number is colored in green, this means that the buy volumes exceed sell volumes by 18%. And conversely, if the number is colored in red, this means that the sell volumes exceed the buy volumes by 18%.
If the balance value is equal to or very close to one, this means that the profile is almost balanced, that is, the buy are very close or equal to the sell volumes.
4. By default, the balance and delta are calculated in terms of market orders. The new ProfileDeltaReverse function activates the calculation mode in terms of limit orders.
Versión 1.6
2016.10.14
Improved algorithm for calculating the color difference delta.
Set the profile in such a way as to capture the beginning and the end of the trend, and you will see clearly enough the green layers of buyers and the red layers of sellers within this trend.
Versión 1.5
2016.07.22
Fixed negative values at profile clusters if the volume is too high.
Versión 1.4
2016.07.11
Added the ability to select the type of the volumes (tick or real) used in the terminal to the indicator. If your broker broadcasts the values of real volumes to the MT5, set the value of the input variable RealVolumes=true, in this case, the indicator will use the real volumes in its calculations.
Versión 1.3
2016.06.07
Added three new functions:
ProfileImbalance - in this mode, not simply the volume profile is displayed, but the profile of the difference between the volumes of buyers and the volumes of sellers, that is the delta profile.
ProfileInitBalance - in this mode, the profile of the initial balance is displayed inside the mail profile. This profile is calculated based on the data, the capture range of which is set as a percentage of the total length of the main profile, from left to right, starting from the beginning of the main profile. For example, if the main profile has a length of 8 hours, then the value of 12.5% is equivalent to 1 hour of the initial balance. The color of the initial balance profile is set using the ProfileInitBalanceColor variable. This function is not performed for the summary profile, as well as for the profiles directed from right to left. If the value is zero the function is not performed.
ProfileMaxLengthPix - the maximum length of the profile, specified in monitor pixels. In this mode, regardless of the profile capture area, its total visible length will not be greater than the specified value. If the value is zero the function is not performed.
Fixed the error with the summary profile becoming a normal profile when it is overlapped by new candles on the chart. The reference rectangle of the summary profile is now automatically positioned at the bottom, under the summary profile.
The ProfileStepPoint input variable now has a fractional type. This allows to set the grid step of the profiles in «new» points. The value of 0.1 corresponds to one «new» point.
The color of the reference rectangles automatically adjusts to the chart background color, but with a darker tone (slightly brighter tone for a black background). If you want to apply a different color, then set the ProfileRectangleColor input variable to any other color, except White.
Versión 1.2
2016.05.27
The indicator works on all timeframes.
Improved the visual appearance and extended the indicator capabilities.
When the scale of the calculated grid is increased (ProfileStepPoint or ProfileStepPointPix), the numerical value of volume is specified not only along the POC line, but also on each cluster of profiles.
The initial position as well as the final position is displayed above the profiles. Depending on the timeframe, those will be the initial and final – time, and/or session (day of the week, month, date).
Added the ability to display the total (cumulative) profile. Create a rectangle in an empty space on the right beyond the graph, and the summary profile will appear in that area.
Scrolling the chart to history is allowed for the summary profile. When scrolling the chart, the summary profile will be plotted based on the data in the visible area, that is, the data to the left and right beyond the chart window are not considered in the calculations.
Added the color fading visual effect - ProfileFading.
Added the function of color difference delta - ProfileDelta. In this mode, the areas of prevailing Buys on the profiles is colored in green, that of Sells - in red. On the summary profile, respectively, blue/red.
Separate color variables are introduced for the summary profile:
ProfileSumInAreaColor – summary profile color in the price area.
ProfileSumOutAreaColor – summary profile color outside the price area.
ProfileSumPocColor – color of the POC line of the summary profile.
ProfileSumTextColor – text color on the summary profile.
Versión 1.1
2016.05.11
In version 1.1 the principle of indicator management has been completely changed.
Now it is possible to create multiple custom profiles within one indicator running on the chart. Simply create a rectangle of required length on the chart and this rectangle will be automatically filled by the profile. The color of this rectangle will also automatically change according to the ProfileRectangleColor input parameter.
Note: If you do not want the rectangle to be filled by a profile, then rename it to any other name which does not include the word «Rectangle».

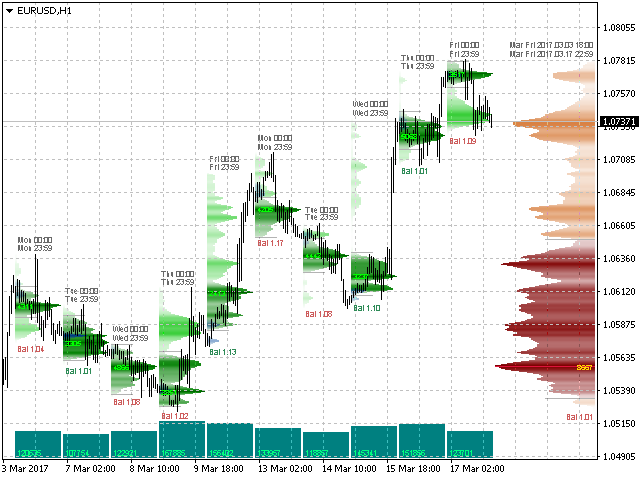
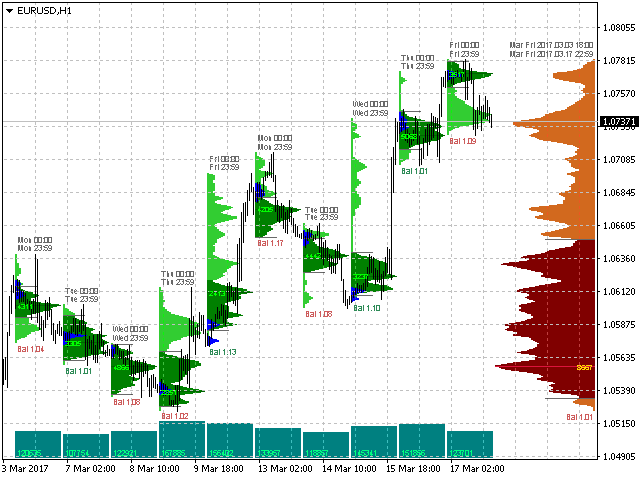
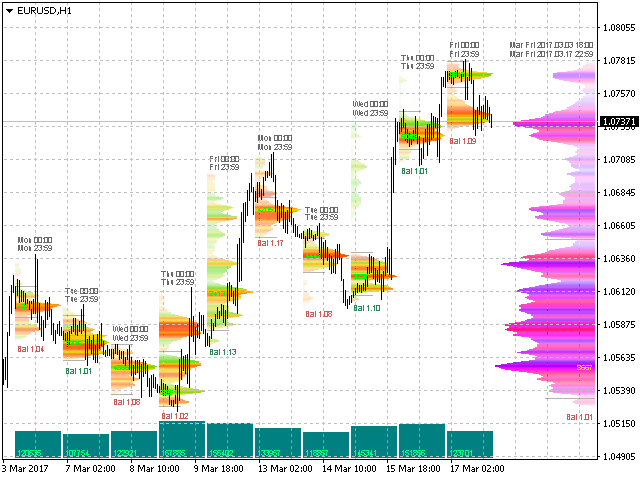
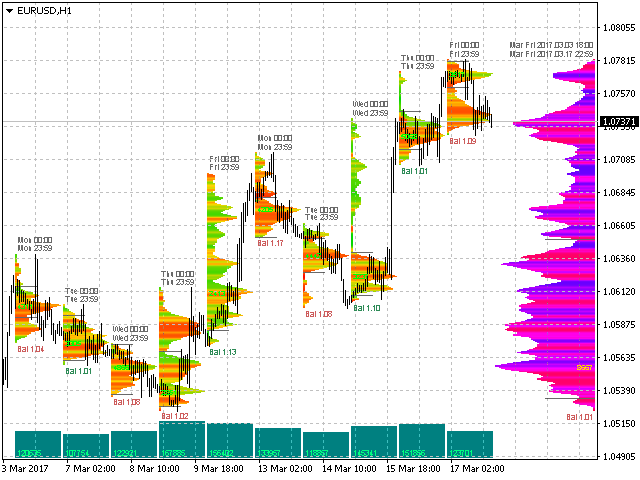

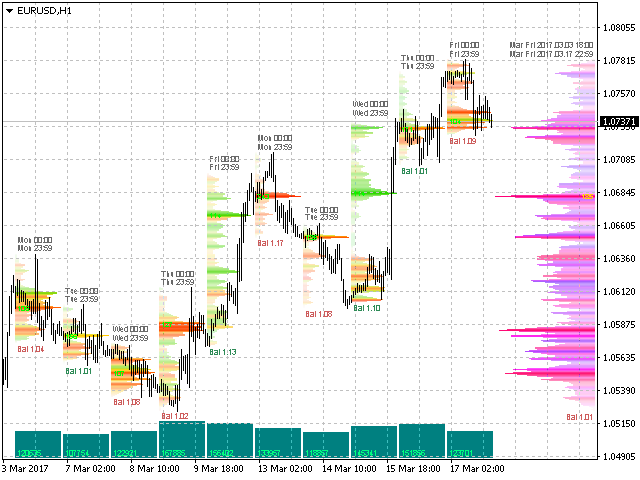

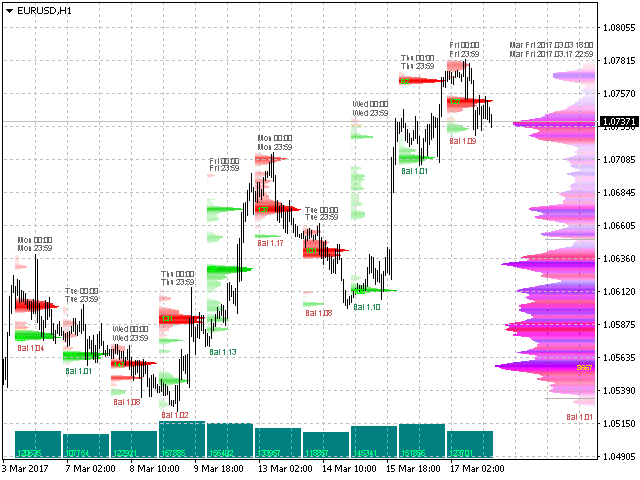

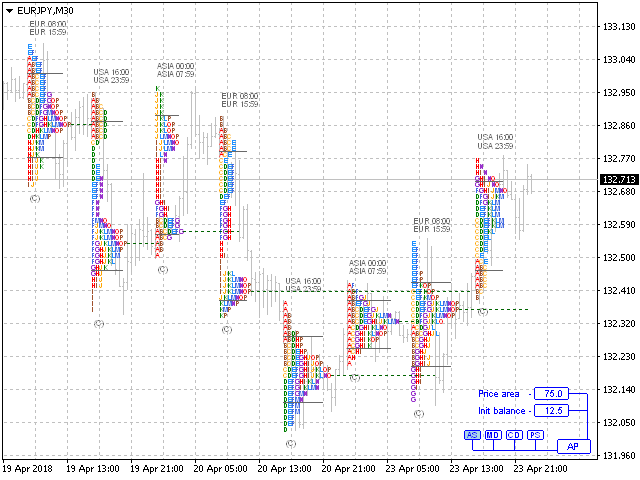
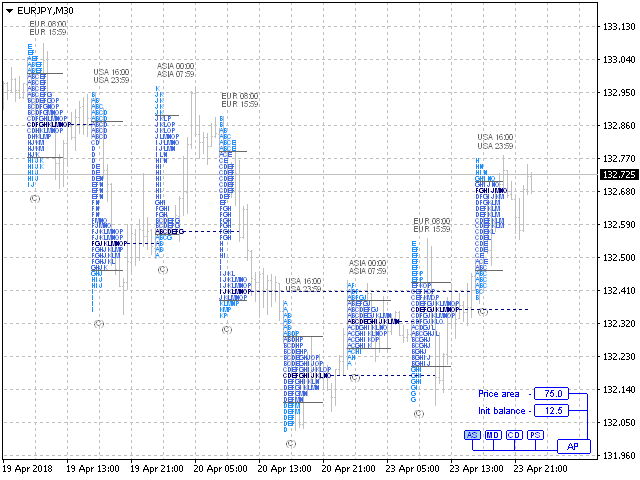




Hello Traders, if you are looking for an indicator that will help you find sniper entries, then look no further. AnyProfile (Volume Profile, and so much more!) will help you follow big institutions as they are not able to hide their footprints. Volume is often overlooked or underused, but it is the only true indication of where big institutions are building their positions. Candle patterns, trendlines, S&R, S&D, inducement, etc. are created by big institutions to take your money (mostly algos, which is why they are often so precise), but they can't manipulate volume and you can bet they will defend their positions. AnyProfile can assist you in trading with the big institutions and not against them. I never place a trade without consulting it first. You will find that this is the only indicator that you will want on your charts. Go get it!