PZ Harmonacci Patterns
- Indicadores
- PZ TRADING SLU
- Versión: 12.0
- Actualizado: 16 julio 2024
- Activaciones: 20
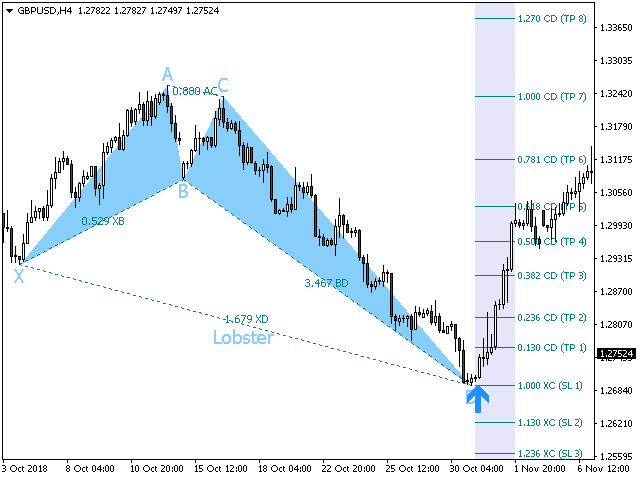
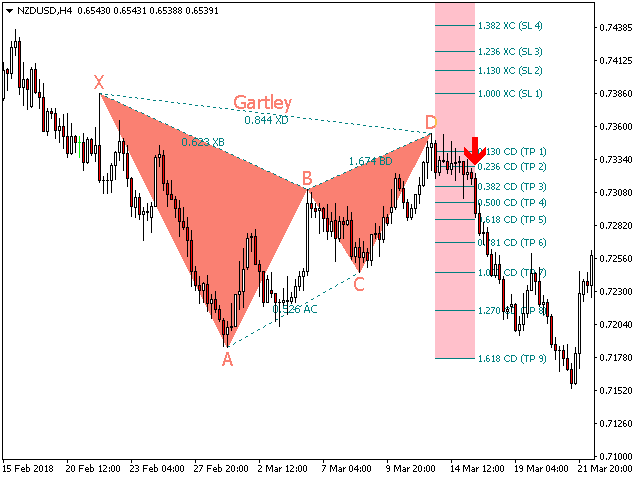
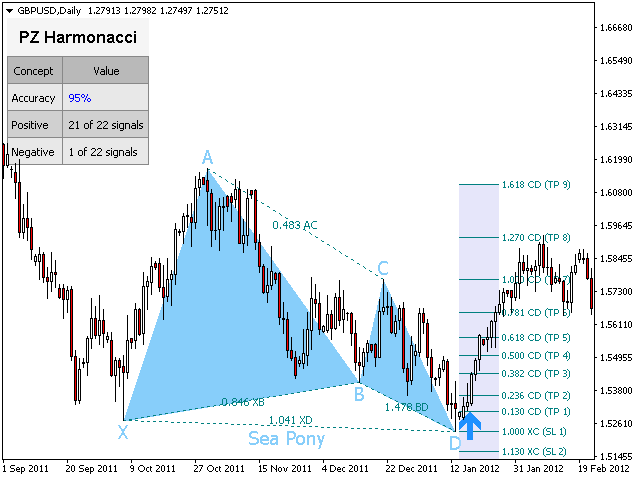
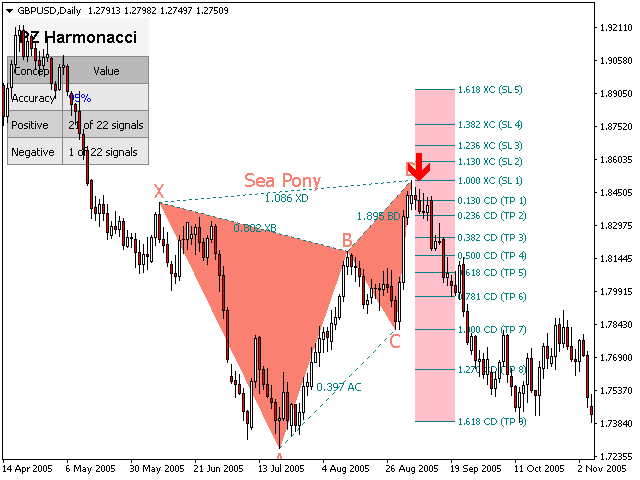
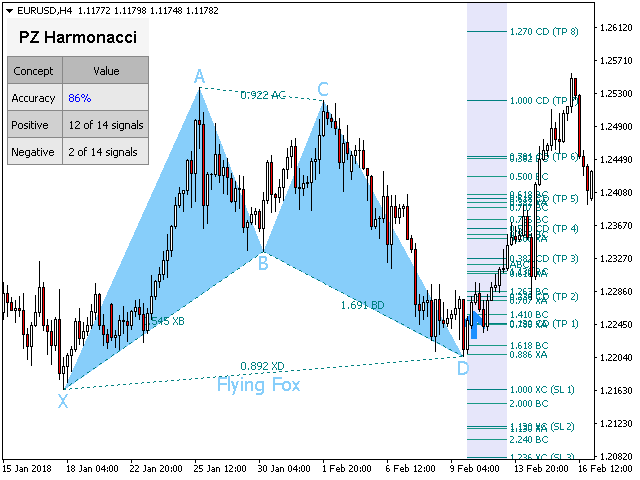
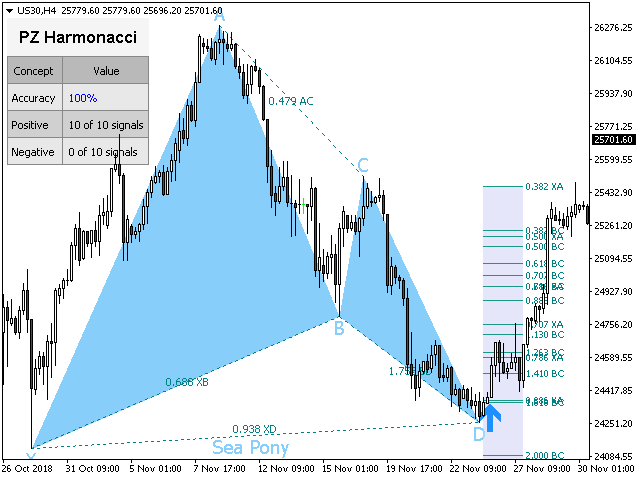
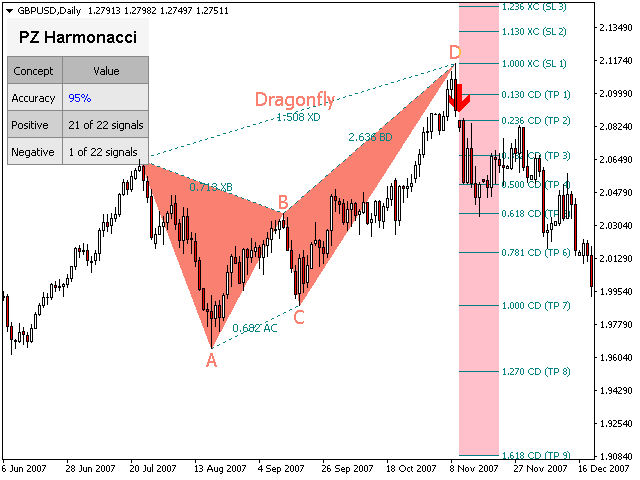
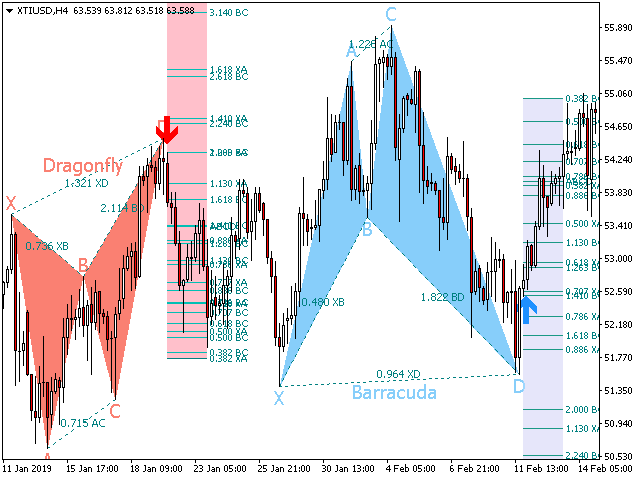
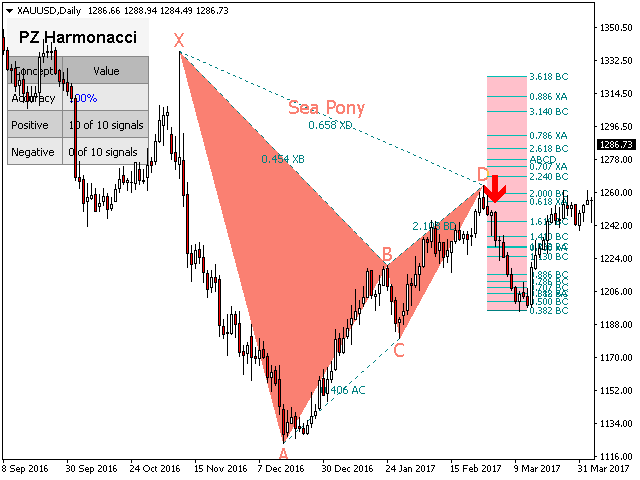
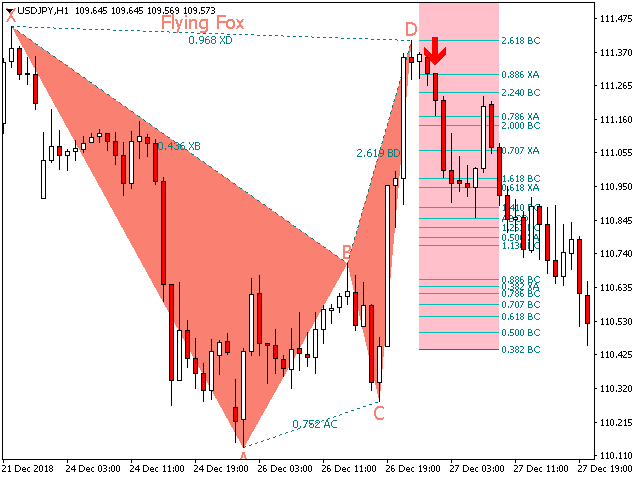
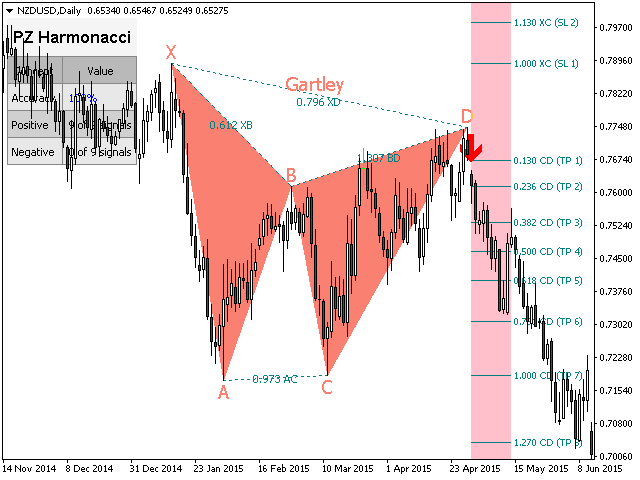
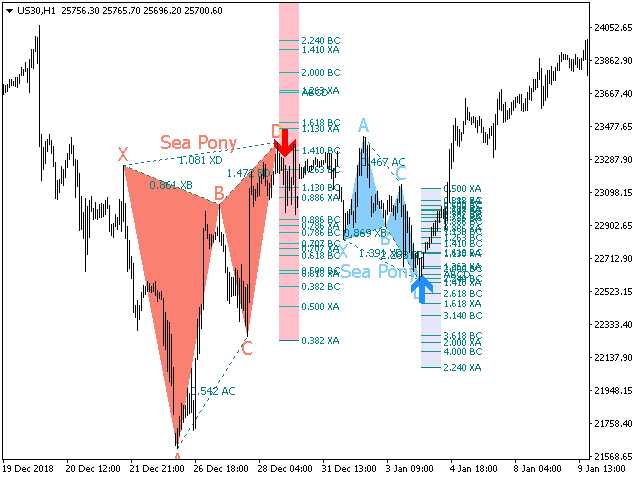
Este es posiblemente el indicador de reconocimiento automático de formación de precios más completo que puede encontrar para la plataforma MetaTrader. Detecta 19 patrones diferentes, toma las proyecciones de Fibonacci tan en serio como usted, muestra la zona de reversión potencial (PRZ) y encuentra niveles adecuados de stop-loss y take-profit.
[ Guía de instalación | Guía de actualización | Solución de problemas | FAQ | Todos los productos ]
- Detecta 19 formaciones de precios armónicos diferentes
- Traza proyecciones de Fibonacci primarias, derivadas y complementarias (PRZ)
- Evalúa la acción del precio pasado y muestra cada patrón pasado
- El indicador analiza su propia calidad y rendimiento.
- Muestra niveles adecuados de stop-loss y take-profit.
- Utiliza desgloses para indicar intercambios adecuados
- Implementa alertas por correo electrónico / sonido / visuales
- Traza la proyección ABCD
Inspirado en el libro de Scott M. Carney, este indicador ha sido diseñado para satisfacer las necesidades de los comerciantes más puristas y exigentes. Sin embargo, implementa un giro para facilitar el comercio: espera una ruptura de Donchian en la dirección correcta antes de señalar el comercio, lo que hace que sus señales sean muy confiables.
Importante: Algunos nombres de patrones se han renombrado como alternativas que se explican por sí mismas para cumplir con una queja de marca registrada del Sr. Scott M. Carney.
Formaciones de precios armónicos compatibles
| Nombre | Min XB | Max XB | Min AC | AC máx. | DB mínima | Max BD | Min XD | Max XD |
|---|---|---|---|---|---|---|---|---|
| Zorro Volador | 0,382 | 0.5 0.5 | 0,382 | 0,886 | 1.618 | 2.618 | 0,886 | 0,886 |
| Gartley | 0.618 | 0.618 | 0,382 | 0,886 | 1.272 | 1.618 | 0,786 | 0,786 |
| Langosta | 0,382 | 0.618 | 0,382 | 0,886 | 2,24 | 3.618 | 1.618 | 1.618 |
| Libélula | 0,718 | 0,718 | 0,382 | 0,886 | 1.618 | 2.618 | 1.272 | 1.618 |
| Cifrar | 0,382 | 0.618 | 1.13 | 1.414 | 1.272 | 2,0 | 0,786 | 0,786 |
| Barracuda | - | - | 1.13 | 1.618 | 1.618 | 2,24 | 0,886 | 1.13 |
| Alt Flying Fox | 0,382 | 0,382 | 0,382 | 0,886 | 2,0 | 3.618 | 1.13 | 1.13 |
| Langosta | 0,886 | 0,886 | 0,382 | 0,886 | 2.618 | 3.618 | 1.618 | 1.618 |
| Cisne blanco | 1.382 | 2.618 | 0.236 | 0.5 0.5 | 1.128 | 2,0 | 1.126 | 2.618 |
| Cisne negro | 0,382 | 0,724 | 2,0 | 4.237 | 0.5 0.5 | 0,886 | 0,382 | 0,886 |
| Max Bat | 0,382 | 0.618 | 0,382 | 0,886 | 1.272 | 2.618 | 0,886 | 0,886 |
| Max Gartley | 0,382 | 0.618 | 0,382 | 0,886 | 1.128 | 2.236 | 0.618 | 0,786 |
| Max Dragonfly | 0.618 | 0,886 | 0,382 | 0,886 | 1.272 | 2.618 | 1.272 | 1.618 |
| Alt Barracuda | 0,446 | 0.618 | 0.618 | 0,886 | 1.618 | 2.618 | 1.128 | 1.128 |
| Una langosta | 0.276 | 0,446 | 1.128 | 2.618 | 1.618 | 2.618 | 0.618 | 0.618 |
| Una Libelula | 0,382 | 0.618 | 1.128 | 2.618 | 1.272 | 1.272 | 0.618 | 0,786 |
| Un zorro volador | 0,382 | 0.618 | 1.128 | 2.618 | 2 | 2.618 | 1.128 | 1.128 |
| Un gartley | 0.618 | 0,786 | 1.128 | 2.618 | 1.618 | 1.618 | 1.272 | 1.272 |
| Poni de mar | 0,128 | 3.618 | 0,382 | 0.5 0.5 | 1.618 | 2.618 | 0.618 | 3.618 |
Parámetros de entrada
- Amplitud: este parámetro controla el tamaño de los patrones que se encuentran en el gráfico.
- Desviación: margen de movimiento algorítmico para el reconocimiento de patrones. Aumente para encontrar más patrones.
- Período de ruptura: período de ruptura de Donchian para las señales de negociación.
- Max History Bars: cantidad de barras de historial para evaluar cuándo se carga el indicador.
- Mostrar estadísticas: active o desactive las estadísticas de la pantalla de rendimiento.
- Puntos de visualización: muestra etiquetas de puntos de precio (etiquetas X, A, B, C, D).
- Mostrar proporciones: muestra las proporciones de los patrones.
- Visualizar proyecciones - Visualizar la zona de inversión potencial (PRZ)
- Mostrar niveles SL / TP: muestra niveles adecuados de stop-loss y take-profit.
- Configuración de patrones: elija qué patrones buscar: deshabilite todos los que no usa.
- Configuración de dibujo: configure los colores de los patrones alcistas y bajistas, así como los tamaños de fuente.
- Proporciones: active o desactive las proporciones y elija sus propios colores de proporción.
- Proyecciones: muestra u oculta las proyecciones de Fibonacci en el gráfico.
- Desgloses: habilite o deshabilite los desgloses y configure los tamaños y colores de flecha deseados.
- Alertas: habilite las alertas de pantalla / correo electrónico / push / sonido para desgloses, patrones o ambos.
Autor
Arturo López Pérez, inversor privado y especulador, ingeniero de software y fundador de PZ Trading .


Good one. Better than all your other indicators you have.