PZ Support Resistance MT5
- Indicadores
- PZ TRADING SLU
- Versión: 7.0
- Actualizado: 19 julio 2024
- Activaciones: 20
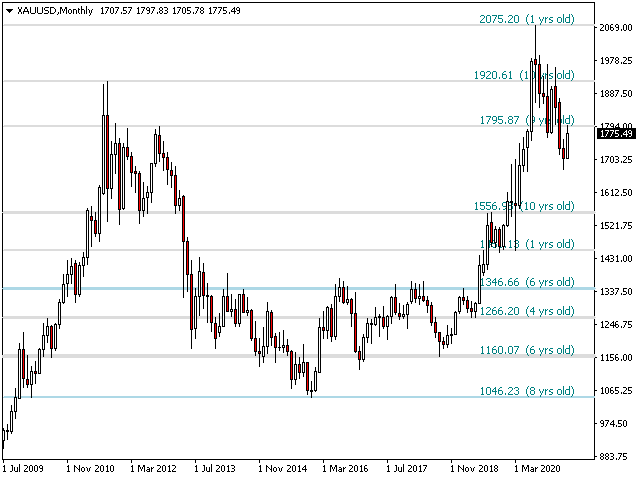
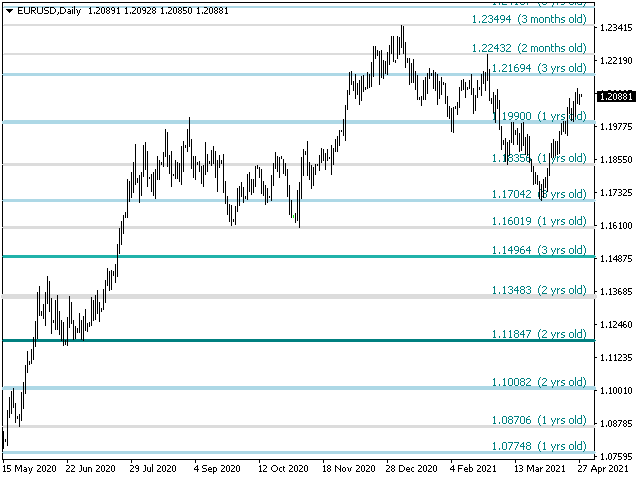
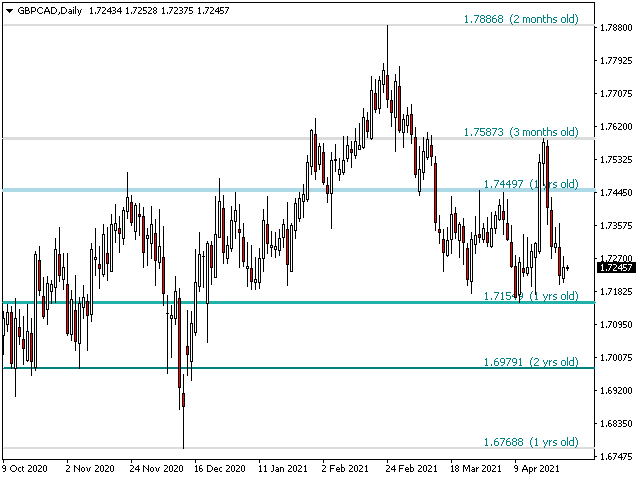
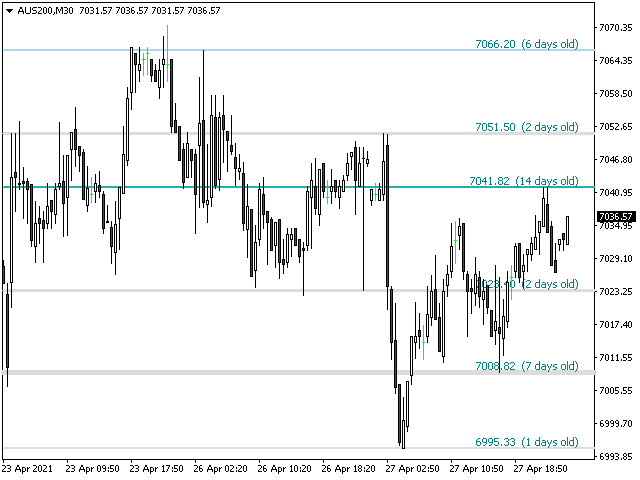
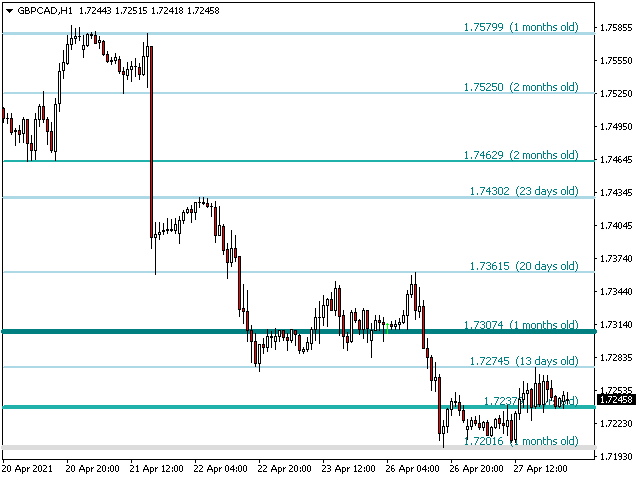
¿Cansado de trazar líneas de soporte y resistencia? La resistencia de soporte es un indicador de marco de tiempo múltiple que detecta y traza automáticamente los soportes y las líneas de resistencia en el gráfico con un giro muy interesante: a medida que los niveles de precios se prueban con el tiempo y aumenta su importancia, las líneas se vuelven más gruesas y oscuras.
[ Guía de instalación | Guía de actualización | Solución de problemas | FAQ | Todos los productos ]
- Mejora tu análisis técnico de la noche a la mañana
- Detecta niveles de precios importantes sin navegar por los gráficos
- Reconozca la fortaleza relativa de todos los niveles de precios de un vistazo
- Ahorre hasta media hora de líneas de trazado para cada operación
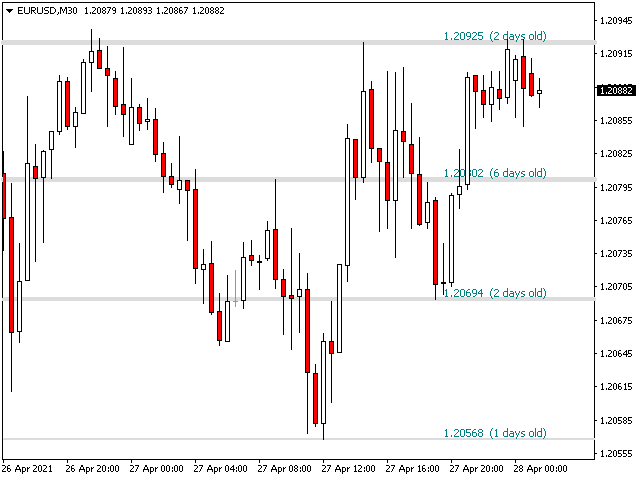
- El indicador muestra la antigüedad de todos los niveles de precios.
- El indicador no se repinta
Los niveles de precios pasados y presentes se colapsan por proximidad y se ajustan a la acción actual del mercado. Las líneas se dibujan donde está la acción y no necesariamente en los picos.
- Los niveles de precios se vuelven más oscuros y anchos a medida que se rechazan con el tiempo
- Los niveles de precios sin importancia se borran regularmente para evitar ruidos
- Selección de marco de tiempo personalizable y factor de colapso
- Implementa alertas por correo electrónico / sonido / push para desgloses
Parámetros de entrada
- Configuración del indicador: el indicador leerá el precio del período de tiempo actual, pero opcionalmente puede seleccionar otro. Por ejemplo, puede mostrar líneas de soporte y resistencia D1 en gráficos H4. También puede elegir qué cantidad de niveles de precios mostrar en el gráfico, utilizando el parámetro de densidad de nivel de precios .
- Configuración de color: ingrese los colores deseados para las líneas de soporte y resistencia según la importancia.
- Configuración de etiquetas: opcionalmente, las etiquetas que muestran la antigüedad de cada línea de soporte y resistencia se pueden mostrar en el indicador. Esto está deshabilitado por defecto. Puede elegir la fuente y el tamaño de la etiqueta.
- Alertas: habilite las alertas de pantalla / correo electrónico / push / sonido para los brotes.
Autor
Arturo López Pérez, inversor privado y especulador, ingeniero de software y fundador de Point Zero Trading Solutions.

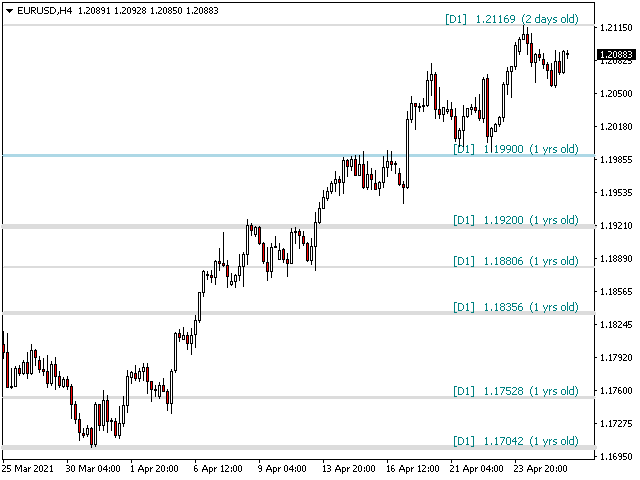
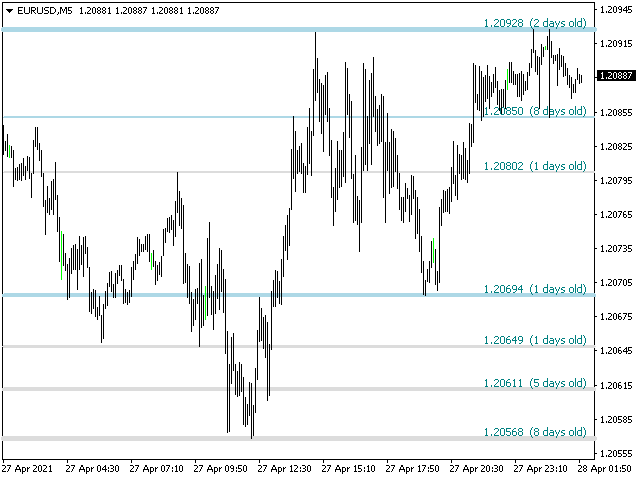

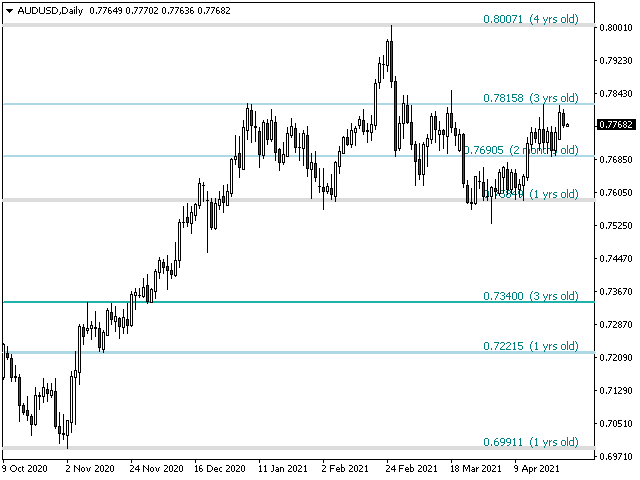


I have bought multiple products from PZ over the past 14 years, they are always well coded and you get excellent support. I had bought the MT4 version of this indicator a number of years ago, with now having transitioned to using MT5, I was missing having this in my charts. I did start having an Mt4 and MT5 platform open, so I could still see the indiactor running and the levels on the charts, then I tried some other S&R indicators, but they don't show the age of the support and/or resistance lines, which is what I really missed. Have a look at the screen shots and you will see on the far right the age, this is really helpful in knowing if you are looking at a new S&R line, or one that has been holding for a long time. I use it on a M5 chart these days, and leave the setting on current, but you can set it to daily if you want to see the larger timeframe lines. If you do this, you will see D1 in text on the S&R line, even if you are looking at and on an M5 chart which is really helpful.