Arrow trend MT5
- Indicadores
- Xin You Lin
- Versión: 1.6
- Activaciones: 5
Arrow Trend indicators
Trading with the trend is often one of the most basic pieces of advice given by experienced traders. In addition, experienced traders will often advise traders to prioritize the long-term trend, as prices usually follow the direction of the long-term trend.
Arrow trend indicators are tools that traders can use to determine the direction of a trend toward a long-term trend.
What is an arrow trend indicator?
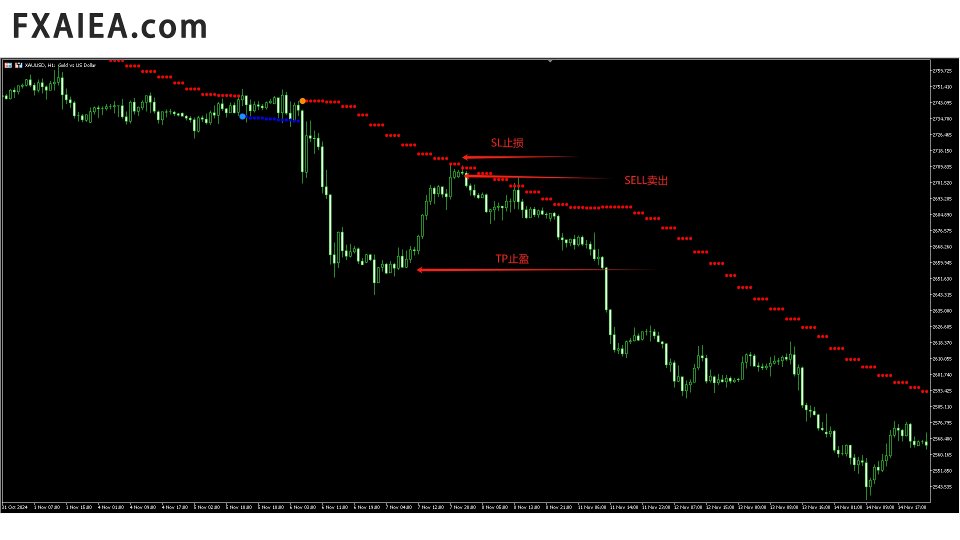
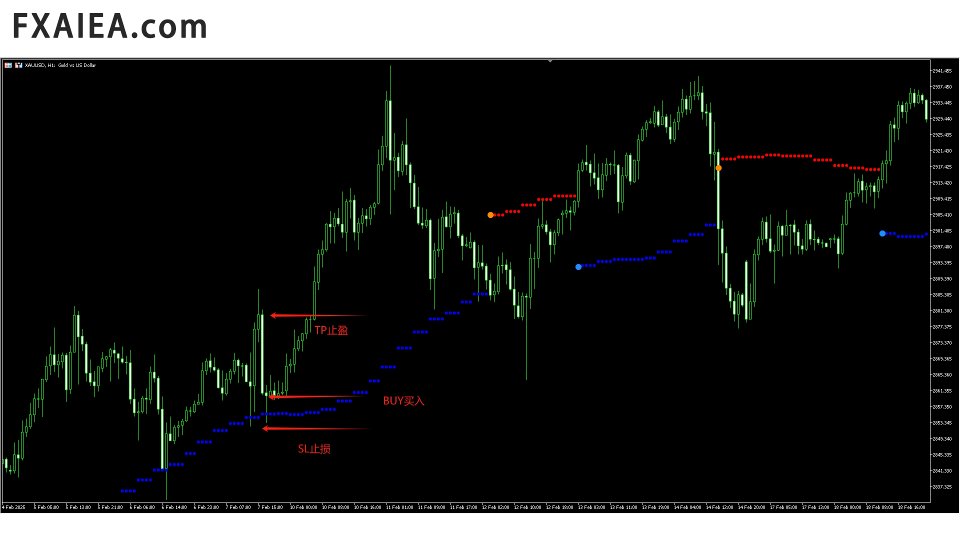
An arrow trend indicator is a trend-following technical indicator that identifies a direction that indicates a long-term trend. It plots a series of points that may move around price behavior and change color depending on the direction of the long-term trend. It draws a Dodge blue dot to indicate a bullish trend reversal and a dark orange dot to indicate a bearish trend reversal. It then goes on to draw blue dots for a bullish trend and red dots for a bearish trend.
How do arrow trend indicators work?
The indicator uses complex algorithms to calculate the direction of long-term trends. It then draws points based on the trend direction it recognizes. Whenever the price closes on the other side of the dot, the dots move, as shown in the direction of the previous trend.
How to use the MT5 arrow trend indicator
This indicator has three variables that can be modified in its indicator Settings. However, these Settings are not marked in English.
The first variable modifies the price behavior and the distance between points. This effectively adjusts the sensitivity of the arrow trend indicator when detecting trend direction and reversal. The higher the input value, the further away the point is from the price action.
This indicator can be a very reliable filter of long-term trend direction. Traders can use this indicator to determine the direction of the long-term trend and trade specifically in that direction based on the color of the points.
It can also be used as a long-term trend reversal entry signal. Traders can trade based on the appearance of dodging blue and dark orange dots.
It can also be used as dynamic support and resistance levels. Traders can trade the price rejection candlestick pattern that forms as the price falls back to the point.
Purchase transaction setup
What time do you enter?
The dot should be blue. Wait for the price to fall back to the blue dot. As soon as the price trend shows signs of price rejection at the point level, the order is immediately opened. Set a stop loss below the pattern.
When do you quit?
As soon as the price action shows signs of a bearish reversal, close the position immediately.
Sell transaction setup
What time do you enter?
The dot should be red. Wait for the price to fall back to the red dot. As soon as the price action at the point level shows signs of price rejection, a sell order is immediately opened. Set a stop loss above the pattern.
When do you quit?
As soon as the price action shows signs of a bullish reversal, close the position immediately.
conclusion
This indicator can be a very reliable long-term trend tracker. Traders can easily spot the direction of the long-term trend when using this indicator and trade specifically in that direction. In general, trading exactly in the direction of the trend significantly improves the accuracy of the trader.
Recommended time frame: Any time frame will work, but we like to use the M5, M15, M30 and H1 as good choices as well!
Recommended trading varieties: Any variety The best trading varieties we like to use are XAUUSD, EURUSD, GBPUSD, USDJPY, USDCAD, AUDUSD, USDCHF on the M15 time frame
If you have any questions, please contact: QQ:2813871972 wechat: FX-AIEA Email: 2813871972@qq.com

