Volume and Volatility Dashboard for MT5
- Indicadores
- Bulat Rafikov
- Versión: 1.1
- Actualizado: 8 abril 2025
- Activaciones: 5
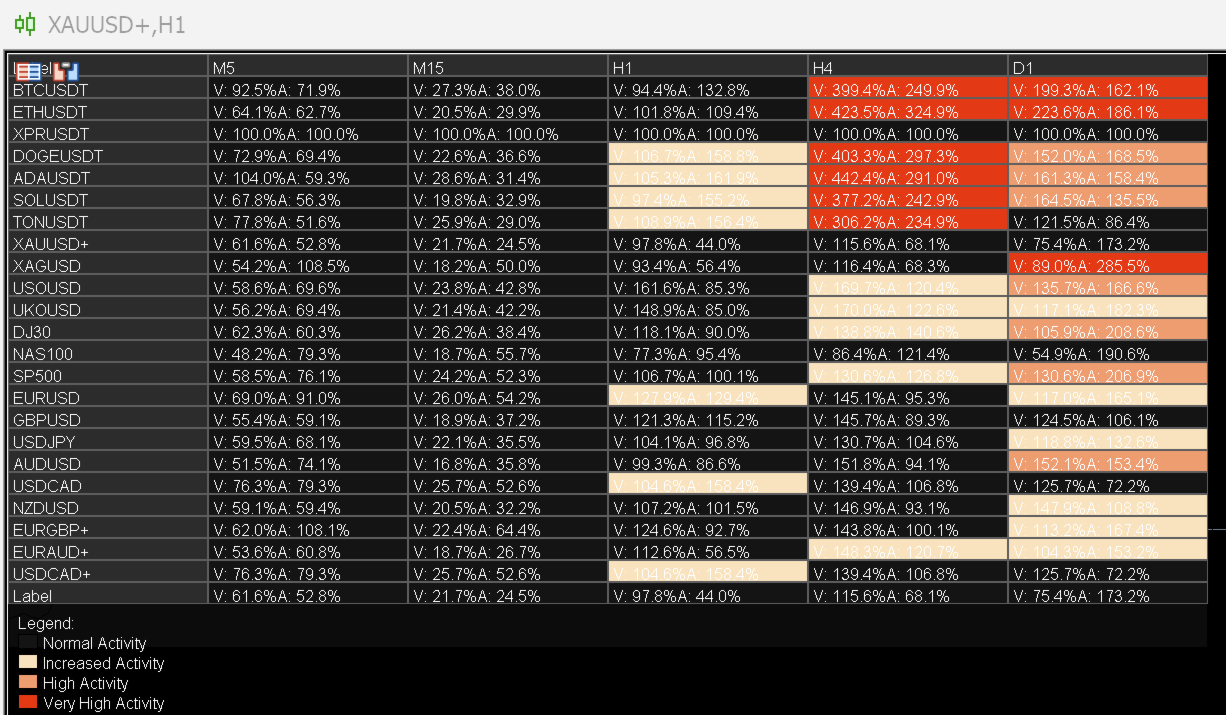
This indicator creates a dashboard-style visual display that shows volume and volatility data across multiple:
The dashboard is organized in a table format where:
Symbols are listed in rows
Timeframes are displayed in columns
Each cell contains volume and volatility data for a specific symbol/timeframe combination
Main Advantages
- Trading symbols (likely different currency pairs or instruments)
- Timeframes (different chart periods like M5, M15, H1, etc.)
The dashboard is organized in a table format where:
Symbols are listed in rows
Timeframes are displayed in columns
Each cell contains volume and volatility data for a specific symbol/timeframe combination
Main Advantages
- Multi-time frame Analysis: Allows you to see volume and volatility patterns across multiple timeframes simultaneously without having to switch between charts
- Multi-symbol Comparison: Lets you compare volume and volatility across different trading instruments at a glance
- Quick Market Overview: Provides a comprehensive snapshot of market conditions, helping you identify which markets are most active or volatile
- Pattern Recognition: Makes it easier to spot correlations between different symbols or timeframes in terms of volume and volatility patterns
- Trading Opportunities Identification: Helps identify potential trading opportunities where volume and volatility align across multiple timeframes (showing stronger signals)
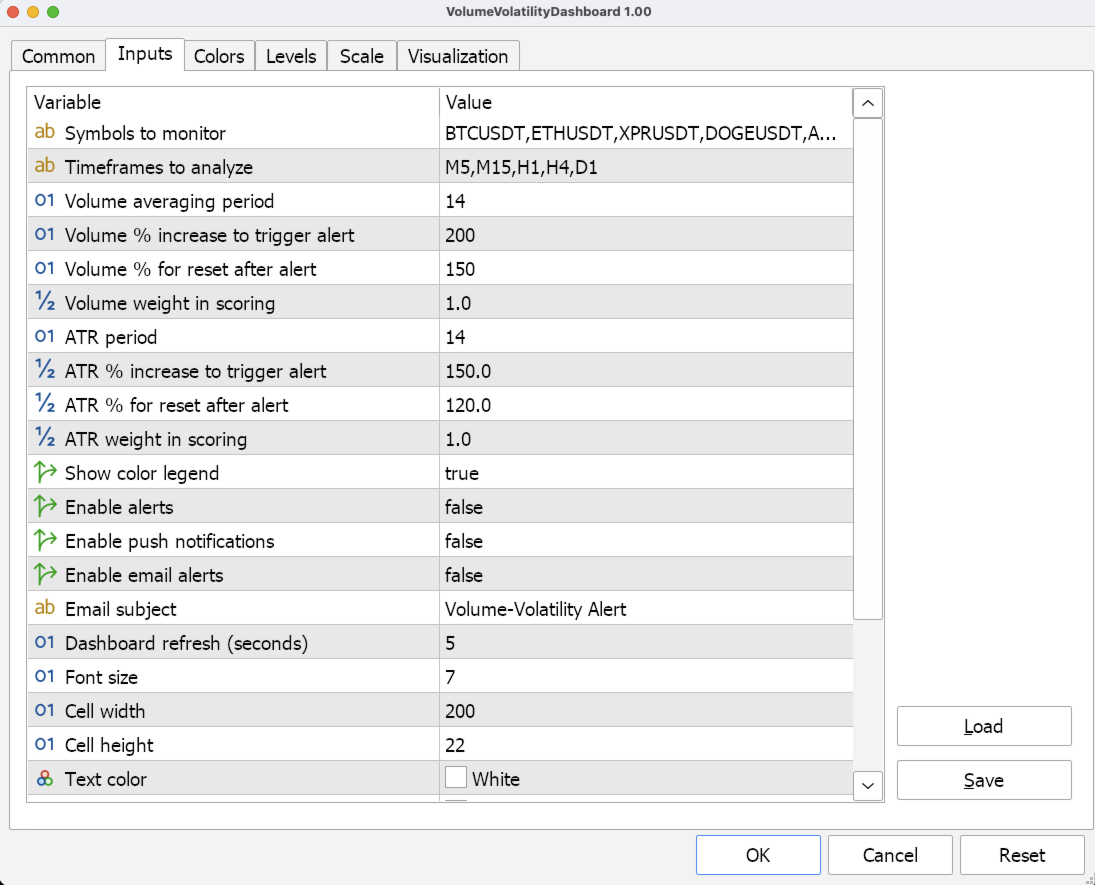
- Customizable: It have customizable parameters like cell width/height and an optional legend
- Visual Organization: The tabular format makes it easier to process a large amount of market data quickly compared to looking at individual indicators on separate charts.
- Dashboard can be moved along with X and Y axis