Chaikin Market Flow
- Indicadores
- Denis Kislicyn
- Versión: 1.0
Chaikin Money Indicator (CMF) – Free Trading Indicator
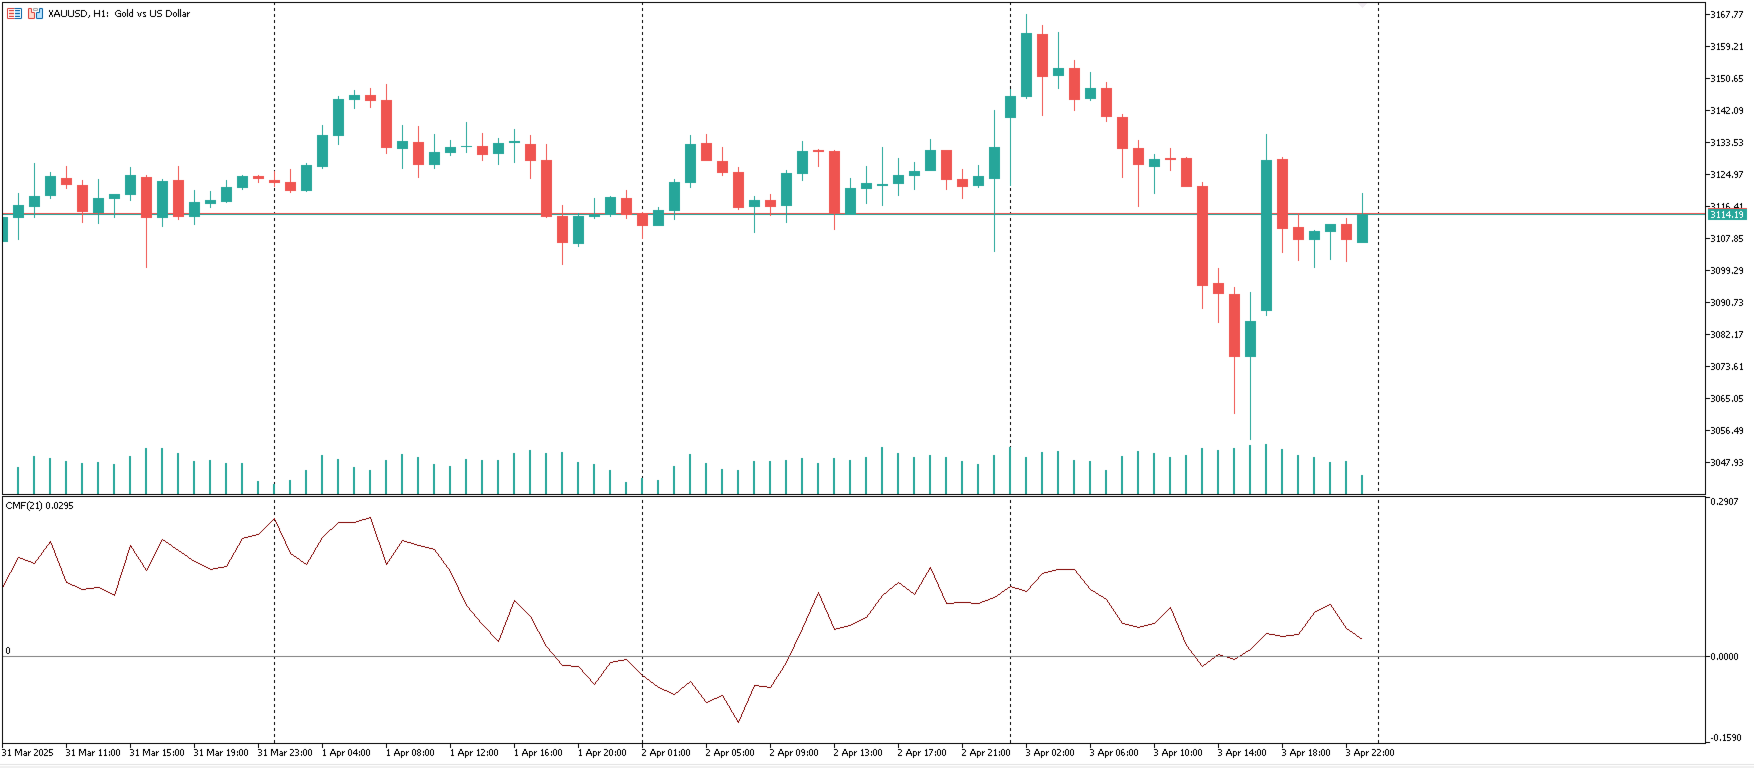
The Chaikin Flow Indicator (CMF) is a technical analysis tool based on the original Chaikin Money Flow (CMF) indicator, developed by Marc Chaikin in the 1980s. It is designed to track capital flows into an asset and helps identify buying and selling pressure. This indicator is useful for both intraday trading and medium-term analysis.
How CMF Works
CMF analyzes price action and volume over a given period by calculating the Money Flow Multiplier and averaging it with trade volumes.
• If the indicator value is above 0 → it signals buying pressure (money flowing into the asset).
• If the indicator value is below 0 → it indicates selling pressure (money flowing out of the asset).
• The further from zero, the stronger the trend movement.
The calculation is based on the relationship between the closing price, the price range of the candle, and the volume, making the indicator sensitive to shifts in supply and demand.
How to Use CMF in Trading?
1️⃣ Identifying the Trend
• Positive values confirm an uptrend.
• Negative values indicate a downtrend.
2️⃣ Divergences
• If the price rises while CMF falls, it may signal trend weakness and a possible reversal downward.
• If the price drops while CMF rises, it may indicate a potential upward move.
3️⃣ Confirming Signals from Other Indicators
Use CMF alongside indicators such as Moving Averages, RSI, and MACD to confirm entry points. For example:
• When the price crosses above a moving average and CMF is positive, it may be a strong buy signal.
• When RSI indicates overbought conditions and CMF declines, it may suggest a weakening uptrend.
4️⃣ Using the Zero Line
• Crossing the zero line from below may be a bullish signal.
• Crossing the zero line from above may be a bearish signal.
🔹 CMF is a powerful tool for analyzing capital flow and identifying hidden market trends. Use it to improve your trading strategy and increase entry accuracy!