• Información general
  • Comentarios
  • Discusión (1)

Mini Indice Composition

🚀 Mini Índice Composition: A Revolução na Análise do Mini Índice! 📈🔥

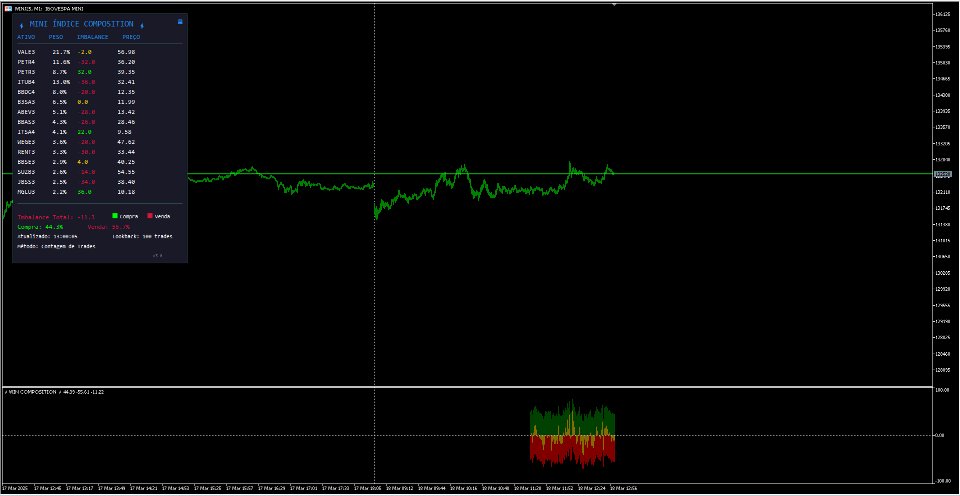
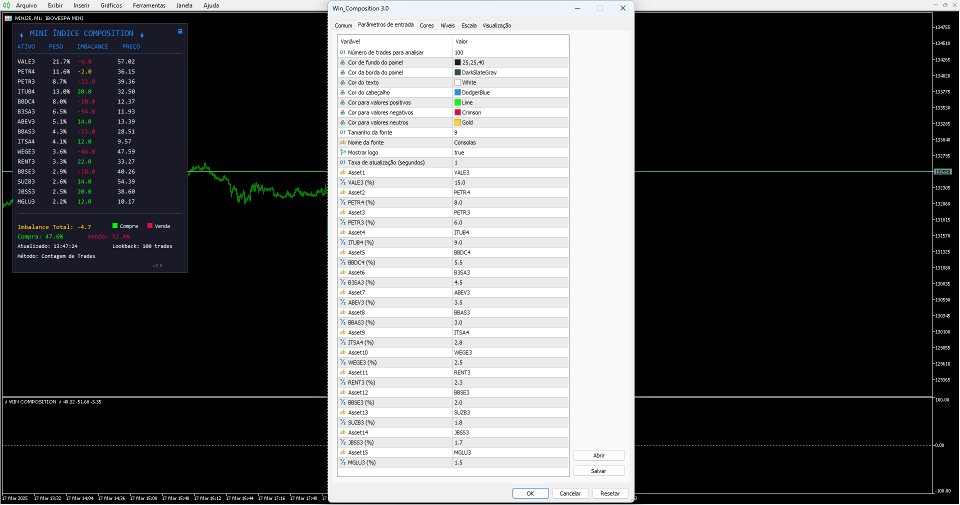
O Mini Índice Composition é um indicador inovador que monitora em tempo real as principais ações que compõem o mini índice, trazendo uma visão quantitativa poderosa sobre o fluxo de ordens do mercado! 💡📊

🔎 Como Funciona?

Diferente de outros indicadores que utilizam apenas dados históricos, o Mini Índice Composition faz uma leitura ao vivo das ordens que entram e saem das ações, pesando o impacto direto no mini índice. Com essa abordagem, ele identifica padrões de imbalance e antecipa possíveis movimentos de alta ou queda. 🚦📉📈

📊 O agrupamento do imbalance é representado pelo histograma na cor gold, destacando visualmente a pressão de compra ou venda no mercado.

Forte agrupamento de imbalance negativo (histograma gold abaixo da linha de equilíbrio) → Indica pressão vendedora, tendência de queda no mini índice.
Forte agrupamento de imbalance positivo (histograma gold acima da linha de equilíbrio) → Indica força compradora, tendência de alta no mini índice.

Essa leitura de mercado em tempo real permite que os traders tomem decisões assertivas com base na dinâmica real das ordens. ⚡🧠

🎯 Por que utilizar o Mini Índice Composition?

Antecipação de movimentos – Identifica desequilíbrios antes que o preço reaja!
Metodologia quantitativa avançada – Avalia fluxos de ordens diretamente das ações!
Análise sem uso de histórico – 100% focado em leitura ao vivo do mercado!
Alta precisão – Indica momentos cruciais de oferta e demanda no mini índice!

📅 Horários de Maior Influência das Ações no Mini Índice:

🕛 9h45 - 10h: Leilão de abertura – definição do preço inicial das ações e do mini índice.
🕛 10h - 12h: Forte correlação entre as ações e o WIN devido à entrada de grandes players.
🕛 12h - 14h: Período de menor volume e menor impacto das ações no WIN.
🕛 14h - 16h30: Retorno da volatilidade, maior influência das ações no WIN com ajustes institucionais.
🕛 16h30 - 17h: Ajustes finais de posições e forte influência do fluxo de ordens.
🕛 17h - 17h15: Leilão de fechamento – pode impactar os preços finais do WIN.

Se você busca uma ferramenta robusta para operar o mini índice com base em dados reais e concretos, o Mini Índice Composition é essencial para sua estratégia! 🚀📊

📢 Potencialize sua análise e esteja sempre um passo à frente do mercado! 🔥


Productos recomendados
The Accumulation / Distribution is an indicator which was essentially designed to measure underlying supply and demand. It accomplishes this by trying to determine whether traders are actually accumulating (buying) or distributing (selling). This indicator should be more accurate than other default MT5 AD indicator for measuring buy/sell pressure by volume, identifying trend change through divergence and calculating Accumulation/Distribution (A/D) level. Application: - Buy/sell pressure: above
WAPV Weis Wave Chart Forex
Eduardo Da Costa Custodio Santos
El Weis Wave Chart Forex para MT5 es un indicador de precio y volumen. La lectura de Precio y Volumen fue ampliamente difundida a través de Richard Demille Wyckoff en base a las tres leyes creadas por él: Oferta y Demanda, Causa y Efecto y Esfuerzo vs. Resultado. En 1900, R.Wyckoff ya utilizaba el gráfico de ondas en sus análisis. Muchos años después, alrededor de 1990, David Weis Automatizó el gráfico de ondas de R. Wyckoff y hoy os traemos la evolución del gráfico de ondas de David Weis. Muest
Do you use volume in your reading of the market? Certainly many traders use it, and do not imagine operating without it. The Color Histogram Volume Set indicator allows the user to choose the value that he considers interesting to monitor. When you pass this you will have visual confirmation and if you want you will also have the audible alert that is given by the indicator. Of course, there are other ways to try to find a high volume, such as assessing whether the volume is above av
Wapv Price and volume
Eduardo Da Costa Custodio Santos
El indicador de precio y volumen WAPV para MT5 es parte del conjunto de herramientas (Wyckoff Academy Wave Market) y (Wyckoff Academy Price and Volume). El indicador de precio y volumen WAPV para MT5 se creó para facilitar la visualización del movimiento del volumen en el gráfico de forma intuitiva. Con ella podrás observar los momentos de pico de volumen y momentos en los que el mercado no tiene interés profesional Identificar momentos en los que el mercado se mueve por inercia y no por movimie
Visual Heatmap Book Analyzer
Alexandre Moraes De Souza Lima
Visual Heatmap Book Analyser This indicator monitors the market liquidity and generates colors based on order patterns, quantities, and renewal activities in the book. This allows you to visualize the order flow and identify areas of high and low liquidity and activity. The indicator uses machine learning techniques to analyze the order behavior in the book, enabling it to detect patterns and trends in orders, allowing you to make informed decisions about your trading operations. The color pale
To download MT4 version please click here . - This is the exact conversion from TradingView: "Trend Direction Force Index - TDFI [wm]" By "causecelebre". - The screenshot shows similar results from tradingview and Metatrader when tested on ICMarkets on both platforms. - This indicator uses multiple levels of averaging to detect trend strength. - You can optimize filter low and filter high levels to achieve best results. - You have access to buffers to use in EAs. - This is a light-load processin
True Weis Wave
Atila Goncalves Firmino
A version based on David Waves' description in his book 'Trade About to Happen' of his adaptation of the Wyckoff wave chart. The indicator directionally accumulates volume, adding to each brick or candle close, with color indication for up and down. it can be used it with tick or real volume, it also changes color when the accumulated value of the previous wave is exceeded, being the trade signal. Yellow color is used for doji candlestick, it will continue with accumulation without zero the sum
Segmented Volume MT5
Eduardo Da Costa Custodio Santos
El indicador de volumen segmentado MT5 se creó para facilitar a quienes operan utilizando análisis de precios y volumen, VSA, VPA, método Wyckoff y Smart Money System. El volumen segmentado funciona en cualquier mercado (Crypto, CFD, Forex, futuros, acciones ...) y funciona en cualquier momento del gráfico. Vea lo fácil que es su interpretación: #Verde: Volumen mucho más alto que el promedio del mercado #Rosa oscuro: volumen más grande que el promedio #Azul: Volumen normal positivo #Red: Volumen
Mini Chart Indicators
Flavio Javier Jarabeck
The Metatrader 5 has a hidden jewel called Chart Object, mostly unknown to the common users and hidden in a sub-menu within the platform. Called Mini Chart, this object is a miniature instance of a big/normal chart that could be added/attached to any normal chart, this way the Mini Chart will be bound to the main Chart in a very minimalist way saving a precious amount of real state on your screen. If you don't know the Mini Chart, give it a try - see the video and screenshots below. This is a gr
WAPV Weis Wave Chart MT5
Eduardo Da Costa Custodio Santos
El gráfico Weis Wave para MT5 es un indicador de precio y volumen. La lectura de Precio y Volumen fue ampliamente difundida a través de Richard Demille Wyckoff en base a las tres leyes creadas por él: Oferta y Demanda, Causa y Efecto y Esfuerzo vs. Resultado. En 1900, R.Wyckoff ya utilizaba el gráfico de ondas en sus análisis. Muchos años después, alrededor de 1990, David Weis Automatizó el gráfico de ondas de R. Wyckoff y hoy os traemos la evolución del gráfico de ondas de David Weis. Muestra l
No Demand No Supply MT5
Trade The Volume Waves Single Member P.C.
No Demand No Supply   This indicator identifies   No Demand –No Supply candles to your chart and plots volume bars colored according to the signal. It can be applied to all timeframes or to a specific one only. It can also be used as regular volume indicator  with exceptional future of WEIGHTED VOLUME. Furthermore is has an alert notification, sound and email when a signals occurs. The indicator does not repaint but the alert will come on two candles back due to the definition of No Demand No Su
Balance Aggression
Edson Cavalca Junior
The indicator measures the balance of aggression. The formula is as follows:   Aggression  = Purchase Volume - Sales Volume. Note : It is rec ommended to use the default configuration and VPS values. It does not work in Forex. Meet Our Products     Parameters : Numbers of days prior to the current one for calculation; Volume Divider e; Enables calculation of the current candle; Histogram Line style and; Size; Line Line style and; Size;  Follow us on our website to check the next news.
VisualVol
Maxim Kuznetsov
The indicator highlights the points that a professional trader sees in ordinary indicators. VisualVol visually displays different volatility indicators on a single scale and a common align. Highlights the excess of volume indicators in color. At the same time, Tick and Real Volume, Actual range, ATR, candle size and return (open-close difference) can be displayed. Thanks to VisualVol, you will see the market periods and the right time for different trading operations. The indicator displays: T
Waves PRO
Flavio Javier Jarabeck
For those who appreciate Richard Wyckoff approach for reading the markets, we at Minions Labs designed a tool derived - yes, derived, we put our own vision and sauce into this indicator - which we called Waves PRO . This indicator provides a ZigZag controlled by the market volatility (ATR) to build its legs, AND on each ZigZag leg, we present the vital data statistics about it. Simple and objective. This indicator is also derived from the great book called " The Secret Science of Price and Volum
Delta Aggression Volume PRO is an indicator developed to monitor the strength and continuity of the aggression volume of sell and buy negotiations. Note: This indicator DOES NOT WORK for Brokers and/or Markets WITHOUT the type of aggression (BUY or SELL). Cryptocurrencies and Forex do not provide this type of data, that is, it does not work with them. O Delta Agrression Volume PRO has features that allow you to view beyond the delta volume of the day. Operation Multi symbols  (those who provid
Mr Big MT5
Pavel Verveyko
The indicator shows and highlights the chart candles, which are formed as a result of large players entering the market in large volumes. Such candles can also be formed after achieving a certainty on the market, when most of the participants hold positions in the same direction. The movement is likely to continue in that direction after such candles. The indicator highlights the significant candles from the existing ones on the chart; The indicator allows identifying the trends based on candles
Delta volume AV
Aldair Vieira Leite
O delta volume é uma ferramenta poderosa utilizada em várias estratégias de operação, especialmente no trading de futuros, ações e criptomoedas. Aqui estão algumas das principais estratégias onde o delta volume é frequentemente aplicado: Identificação de Tendências : O delta volume ajuda a identificar a direção da tendência predominante, mostrando se há mais pressão de compra ou venda. Isso pode ser útil para confirmar a força de uma tendência ou identificar possíveis reversões. Confirmação de B
ZigZagHHLL
Maksim Neimerik
A simple Zig Zag indicator with added visualization of Higher High, Lower High, Higher Low, Lower Low. This indicator will be very helpful when working with support/resistance levels. The ZigZag indicator is a fundamental tool that will significantly help you navigate complex situations in the financial markets. By providing a clear visual representation of price movements and trends, it simplifies the analysis process and improves decision-making capabilities. Its role in identifying trends and
CVD SmoothFlow Pro
Thalles Nascimento De Carvalho
CVD SmoothFlow Pro - ¡Análisis de Volumen Ilimitado para Cualquier Activo! CVD SmoothFlow Pro es la solución definitiva para traders que buscan un análisis de volumen preciso e ilimitado. Utilizando el cálculo de Cumulative Volume Delta (CVD) con filtrado avanzado de ruido, la Versión Pro ofrece la flexibilidad y precisión necesarias para operar en cualquier activo financiero. ¿Qué ofrece CVD SmoothFlow Pro? Análisis Claro : Filtra el ruido y destaca los movimientos de volumen significativ
SMT (Smart Money Technique) Divergence refers to the price divergence between correlated assets or their relationship to inversely correlated assets.  By analyzing SMT Divergence, traders can gain insights into the market's institutional structure and identify whether smart money is accumulating or distributing assets.  Every price fluctuation should be confirmed by market symmetry, and any price asymmetry indicates an SMT Divergence, suggesting a potential trend reversal. MT4 Version -  https:/
FRB Trader - Our mission is to provide the best support to customers through conted and tools so that they can achieve the expected results FRB Support and Resistance - Indicator places lines on the chart to show Support and Resistance regions. - You can choose the timeframe you want to calculate, as well as the colors of the lines. - Algorithm calculates the points where the strengths of the asset are considered and are extremely important for decision making.
Was: $249  Now: $149   Market Profile defines a number of day types that can help the trader to determine market behaviour. A key feature is the Value Area, representing the range of price action where 70% of trading took place. Understanding the Value Area can give traders valuable insight into market direction and establish the higher odds trade. It is an excellent addition to any system you may be using. Inspired by Jim Dalton’s book “Mind Over Markets”, this indicator is designed to suit the
Crash 1000 Scalping Indicator for the Crash 1000 Deriv Synthetic Index. Introduction The Crash 1000 Scalping Indicator is a specialized tool designed for the Crash 1000 index on the Deriv Synthetic market. This indicator is particularly useful for scalping on the M1 timeframe, helping traders to identify precise entry and exit points for buy positions. It is designed to be non-repainting, providing clear signals with audible alerts and push notifications, and is compatible with mobile devices th
Max Min Delta Indicator Gain Deeper Insights into Market Volume Imbalance with Delta Analysis What is the Max Min Delta Indicator? The Max Min Delta Indicator is a powerful market volume analysis tool that visually represents maximum and minimum delta values using a histogram. It helps traders identify market strength, weakness, absorption, and aggressive buying/selling activity with precision. Key Features: Histogram Visualization: Displays Max Delta (Green) and Min Delta (Red) as
Gm Vwap Point
Antonio Augusto Barreto De Melo
VWAP es un cálculo intradía utilizado principalmente por algoritmos y comerciantes institucionales para evaluar dónde se negocia una acción en relación con su volumen promedio ponderado para el día. Los traders intradía también utilizan VWAP para evaluar la dirección del mercado y filtrar las señales comerciales. Este indicador se utiliza para analizar y calcular el Vwap a partir de un determinado punto del gráfico, que es muy utilizado para analizar el inicio de un movimiento de la relación pr
El indicador Oferta Demanda RSJ PRO calcula y traza las zonas de "Oferta" y "Demanda" en el gráfico, identificando el tipo de Zona (Débil, Fuerte, Verificada, Probada) y en caso de reevaluaciones de la Zona muestra cuántas veces se volvió a probar. Las zonas de "oferta" son las zonas de precios donde se ha producido más oferta que demanda, lo que hace bajar los precios. Las zonas de "demanda" son las zonas de precios donde se ha producido más demanda que oferta, lo que hace subir los precios.
Pmax
Celal Engin Baka
PMax is a brand new indicator developed by KivancOzbilgic in earlier 2020. It's a combination of two trailing stop loss indicators; One is Anıl Özekşi's MOST (Moving Stop Loss) Indicator and the other one is well known ATR based SuperTrend. Both MOST and SuperTrend Indicators are very good at trend following systems but conversely their performance is not bright in sideways market conditions like most of the other indicators. Profit Maximizer - PMax tries to solve this problem.   PMax combi
Box Weis Wave
Thalles Nascimento De Carvalho
5 (1)
¡Eleva tu análisis con el Weis Wave Box! Si buscas precisión y claridad en tus operaciones, el Weis Wave Box es la herramienta que necesitas. Este indicador avanzado ofrece un análisis visual detallado de las ondas de volumen y los puntos de swing, ayudándote a comprender mejor la relación entre esfuerzo y resultados en el mercado. Características Destacadas del Weis Wave Box: Ondas de Volumen Personalizables: Ajusta las ondas de volumen en ticks para adaptarlas a tus estrategias de trad
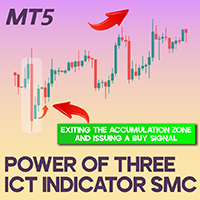
Power of Three ICT Indicator in Smart Money Concept MT5 The Power of Three Indicator is an advanced trading tool available for MetaTrader 5 , designed to highlight three crucial market phases: Accumulation, Manipulation, and Distribution , which align with Smart Money trading principles. These phases represent distinct price behaviors, guiding traders in analyzing market stability, liquidity movements, and directional trends. The indicator marks accumulation zones with red boxes, while manipulat
Weis Wave Result MT5
Sant Clear Ali Costa
Features 3 types of waves: bullish, bearish and unknown. The unknown tower comes when prices move in opposite the direction of the current tower. Label that shows the percentage remaining for the next tower. Allows you set the type of volume that will be accumulated in the towers, either real or tick volumes. Thus, the indicator works in any market, for example: stocks, futures, forex, commodities, etc. Allows you to set the required score for the tower exchange. Allows you to set the font size
Los compradores de este producto también adquieren
CBT Quantum Maverick Sistema de Comercio de Opciones Binarias de Alta Eficiencia CBT Quantum Maverick es un sistema de opciones binarias de alto rendimiento diseñado para traders que buscan precisión, simplicidad y un enfoque disciplinado. No requiere personalización: el sistema está optimizado para resultados efectivos desde el primer momento. Simplemente sigue las señales, que se pueden dominar con un poco de práctica. Características clave: Precisión de señales: Señales basadas en la próxim
This indicator is based on the mathematics of the great trader W.D. Ganna. With its help, you can easily find strong levels by analyzing swings to find the optimal entry point. The indicator works on all instruments and all timeframes. The indicator is fully manual and has control buttons. All you need to do is press the NEW button, a segment will appear, which you can place on any movement, swing or even 1 candle that you want to analyze. By placing the segment, press the OK button. A grid (th
This indicator identifies and displays zones, as it were areas of strength, where the price will unfold. The indicator can work on any chart, any instrument, at any timeframe. The indicator has two modes. The indicator is equipped with a control panel with buttons for convenience and split into two modes. Manual mode: To work with manual mode, you need to press the NEW button, a segment will appear. This segment is stretched over the movement and the LVL button is pressed. The level is displayed
LIMITED! JUST 10 COPIES AVAILABLE!  BONUS AUX VIP Club 2024 : Include EA CAP, CEP, LDH, PSC307 & AO4C to enhance the performance of this tool to its maximum potential  Click Here to Download Files   ( for users only ) FREE Trading Education Available Daily via Zoom --- For More Info or Instant Message Click link ---  https://t.me/abcdwave Transform your trading with the "Five Magic Bullets" Indicator, tailored for traders who embrace the power of Elliott Wave Chaos Theory. Spec
Hello I Want to introduce The Forex Buy Sell Arrow Premium MT5 i recently release this premium indicator! its 1000% Non Repaint Indicator, It Work Perfectly Well,, i tested it day by day, Just mind blowing Result,  Including Powerful trend Algorithm! How It Work? well, it work market trend formula, when trend Bullish Or when trend Bearish,  Recommend Timeframe M30, H1 it work all timeframe, and all currency pair, 100% non repaint, How to take signal From Forex Buy Sell Arrow Premium Ind
TrendMaestro5
Stefano Frisetti
note: this indicator is for METATRADER4, if you want the version for METATRADER5 this is the link:  https://www.mql5.com/it/market/product/108106 TRENDMAESTRO ver 2.4 TRENDMAESTRO recognizes a new TREND in the bud, he never makes mistakes. The certainty of identifying a new TREND is priceless. DESCRIPTION TRENDMAESTRO identifies a new TREND in the bud, this indicator examines the volatility, volumes and momentum to identify the moment in which there is an explosion of one or more of these data a
AriBot
Arman Belassarov
AriMax   – AI-Powered Trading Robot AriMax is a cutting-edge AI-powered trading robot designed to help traders maximize profits while minimizing risk. Utilizing advanced machine learning algorithms and real-time market analysis, AriMax identifies high-probability trade opportunities with precision and speed. Key Features:     AI-Driven Market Analysis   – Analyzes market trends and patterns to make data-driven trading decisions.     Automated Execution   – Places trades seamlessly with optimiz
Big Player Range
Thalles Nascimento De Carvalho
5 (3)
Descubra el Poder de "BigPlayerRange": Su Aliado en el Análisis Técnico de Mercado Le presentamos BigPlayerRange , una herramienta avanzada de análisis técnico diseñada para revelar las zonas de interés institucional en el mercado. Con esta poderosa herramienta, podrá identificar con precisión las áreas donde los grandes jugadores están activos y mejorar sus estrategias de negociación. Características Principales: Mapeo de Zonas de Interés Institucional : BigPlayerRange destaca las zonas
IVISTscalp5
Vadym Zhukovskyi
5 (6)
Te presentamos el indicador iVISTscalp5, que no solo es único sino también efectivo en operaciones de trading. Este indicador se basa en datos temporales y es el resultado de muchos años de experiencia y análisis profundo de los mercados financieros. El indicador iVISTscalp5 es una excelente herramienta para el trading manual. La conveniencia, simplicidad y visualización, toda la complejidad está oculta en su interior. Hemos simplificado al máximo la configuración y uso del indicador iVISTscalp5
VTrende Pro
Andrii Diachenko
5 (1)
VTrende Pro - MTF indicator for trend trading with a display panel for MT5 *** Videos can be translated into any language using subtitles (video language - Russian) Although the signals of the VTrende Pro indicator can be used as signals of a full-fledged trading system, it is recommended to use them in conjunction with the Bill Williams TS. VTrende Pro is an extended version of the VTrende indicator. Difference between Pro version and VTrende: - Time zones - Signal V - signal 1-2 waves -    S
The   Gann Scalping Gold Indicator   is a robust technical analysis tool designed for precision trading in gold markets. It leverages Gann-based methodologies to identify key price levels, enabling traders to anticipate potential market reversals, breakouts, and areas of consolidation. Daily Reset Logic: Automatically resets touch statuses at the start of a new trading day, ensuring that the indicator aligns with fresh daily trends. How It Works: The indicator draws horizontal lines at predefine
The indicator is designed to close positions on the market in time. For example: to take profits ahead of schedule if the price has not reached TakeProfit, and the market is turning around. The indicator analyzes the momentum, not the trend. He does not give any information about the trend. The indicator is well suited for finding divergence. The Ershov 38 Parrots indicator dynamically adjusts to the market and detects price movement impulses of medium and high amplitude. It almost does not rea
WanaScalper
Isaac Wanasolo
1 (1)
A scalping indicator based on mathematical patterns, which on average gives signals with relatively small SL, and also occasionally helps to catch big moves in the markets (more information in the video) This indicator has three main types of notifications: The first type warns of a possible/upcoming signal on the next bar The second type indicates the presence of a ready signal to enter the market/open a position The third type is for SL and TP levels - you will be notified every time price re
Smooth price for Monarch
Konstantin Gruzdev
5 (1)
The Smooth Price technical indicator is used for plotting a smoothed line as close to the price of the financial instrument as possible, and serves to eliminate its noise components. The indicator is part of the Monarch trading system, but here it is presented as an independent technical analysis tool. The indicator is based on the cluster digital filter , which, unlike the ClusterSMA , is applied directly to the price time series. Smooth Price does not redraw (except the very last, zero bar) an
The Expert Advisor and the video are attached in the Discussion tab . The robot applies only one order and strictly follows the signals to evaluate the indicator efficiency. Pan PrizMA CD Phase is an option based on the Pan PrizMA indicator. Details (in Russian). Averaging by a quadric-quartic polynomial increases the smoothness of lines, adds momentum and rhythm. Extrapolation by the sinusoid function near a constant allows adjusting the delay or lead of signals. The value of the phase - wave s
Классификатор силы тренда. Показания на истории не меняет. Изменяется классификация только незакрытого бара. По идее подобен полной системе ASCTrend, сигнальный модуль которой, точнее его аппроксимация в несколько "урезанном" виде, есть в свободном доступе, а также в терминале как сигнальный индикатор SilverTrend . Точной копией системы ASCTrend не является. Работает на всех инструментах и всех временных диапазонах. Индикатор использует несколько некоррелируемых между собой алгоритмов для класси
¡El nivel Premium es un indicador único con más del 80% de precisión de predicciones correctas! ¡Este indicador ha sido probado por los mejores especialistas en comercio durante más de dos meses! ¡El indicador del autor no lo encontrarás en ningún otro lugar! ¡A partir de las capturas de pantalla, puede ver por sí mismo la precisión de esta herramienta! 1 es ideal para operar con opciones binarias con un tiempo de vencimiento de 1 vela. 2 funciona en todos los pares de divisas, acciones, m
Pendiente de Precio
Cesar Juan Flores Navarro
Indicador en base a la pendiente de la linea de precio, dibuja una línea de color cuando sube a base de los precios que previamente has sido procesados o linealizados, y cuando baja la pendiente la linea linealizada toma otro color. En este caso se a considerado 6 lineas de diferentes procesos desde pendientes largas hacia las cortas, observándose que cuando coincidan las pendientes se produce un máximo o mínimo, lo que a simple vista nos permitirá hacer una COMPRA O VENTA.
Индикатор Coefficient Of Determination (COD) представляет собой значение коэффициента детерминации или квадрат коэффициента корреляции между зависимой переменной — ценой и объясняющей переменной — тиковым объемом. Что это дает нам на практике? COD отлично распознает кульминацию трендовых движений, что позволяет подбирать оптимальные точки и ловить развороты рынка. Как использовать индикатор: Наиболее популярная торговая стратегия строится совместно с трендовым индикатором Moving Average (MA), пе
Fibonacci Multiple 12
Cesar Juan Flores Navarro
Fibonacci Múltiple 12, utiliza la serie fibonacci plasmado en el indicador fibonacci, aumentadolo 12 veces según su secuencia. El indicador fibonacci normalmente muestra una vez, el presente indicador se mostrara 12 veces empezando el numero que le indique siguiendo la secuencia. Se puede utilizar para ver la tendencia en periodos cortos y largos, de minutos a meses, solo aumentado el numero MULTIPLICA.
Recommended TimeFrame >= H1. 100% Non Repainted at any moment.  Use it carefully, only with Trend Direction. Trading Usage: 2 Variants: as Range System or as BreakOut System (Both Only With Trend Direction)::: (Always use StopLoss for minimise Risk); [1] as Range System: (Recommended) in UP TREND:  - BUY in Blue Line , then if price goes down by 50 points (on H1) open Second BUY.   Close in any Profit you wish: TrailingStop(45 points) or Close when Price touches upper Gold Line. in DOWN TREND
En base a cálculos matemáticos de determino una linea Horizontal que cruza a todas las señales de trading, mostrando los máximos y mínimos. La linea horizontal parte en dos las subidas y bajadas de las señales de trading, de tan manera que es fácil identificar los máximos y mínimos, y es inteligente por que es sensible a las subidas y bajadas, afín de no quedarse en un solo lado por siempre, trabaja excelentemente con otros indicadores suavizadores ya que les garantiza que en un intervalo de tie
Spike Detector
Tete Adate Adjete
este indicador es un indicador de detector de picos, está especialmente diseñado para intercambiar Boom 1000, Boom 500, Crash 1000 y Crash 500 Recomendamos usarlo solo en índices Deriv Boom y Crash Su configuración es intuitiva, familiar y fácil de usar. tiene funciones de notificación; notificaciones sonoras y notificaciones push. esta herramienta es fácil de usar, fácil de manejar Esta actualización se basa en diferentes estrategias para picos.
El indicador rastrea la tendencia en 5 tiempos de gráfico diferentes para el mismo activo, en base a 6 señales para cada tiempo de gráfico. El objetivo principal del indicador es mostrarnos la tendencia mayoritaria del activo financiero en el que se colocó. El sistema transmite la información de las tendencias en varios tiempos gráficos, de esta forma el usuario puede tener una visión amplia del movimiento del activo, este tipo de herramienta hace que el usuario tenga una mayor tasa de acierto
Limitless MT5
Dmitriy Kashevich
Limitless MT5 is a universal indicator suitable for every beginner and experienced trader. works on all currency pairs, cryptocurrencies, raw stocks Limitless MT5 - already configured and does not require additional configuration And now the main thing Why Limitless MT5? 1 complete lack of redrawing 2 two years of testing by the best specialists in trading 3 the accuracy of correct signals exceeds 80% 4 performed well in trading during news releases Trading rules 1 buy signal - the ap
Panel Visao axetrend
Danilo Maia Siqueira
panel de vista de tendencias; Tendencia de Autoseñales El indicador rastrea la tendencia en 5 tiempos de gráfico diferentes para el mismo activo, basándose en 6 señales para cada tiempo de gráfico. El principal objetivo del indicador es mostrarnos la tendencia mayoritaria del activo financiero en el que se colocó. El sistema transmite la información de las tendencias en diferentes tiempos gráficos, de esta manera el usuario es capaz de tener una visión amplia del movimiento del activo, este
Escalera Inteligente
Cesar Juan Flores Navarro
Indicador en MQL5, recibe la información del precio SUAVIZADO, lo procesa anulando los picos inteligentemente, y el resultado lo envía al desarrollo de la escalera que iniciara y subirá o bajara según el peldaño o INTERVALO ingresado Ingreso PERIODO = 50 (variar segun uso) Ingreso MULTIPLICA AL PERIODO = 1 (variar segun uso) Segun la configuración la escalera puede pegarse o separarse de los precios,, Se aplica toda la linea de tiempo, y a todas las divisas, etc.  
Fibonacci Suavizado
Cesar Juan Flores Navarro
Indicador en MQL5, que obtiene el promedio de 10 EMAS, que son alineadas según Fibonacci, obteniendo un promedio, que sera suavizado.  Se puede ingresar un numero desde 2 a N, que multiplica a los EMA-Fibonacci. Funciona en cualquier criptomoneda, etc. etc... pudiendo calcular el futuro segun la tendencia de las EMAS. Funciona excelentemente en tramos largos, determinando exactamente el mejor inicio/salida. El precio inicial por apertura sera por un periodo de tiempo, luego aumentará.
QXS Market Scanner
Netlux Digital Kft.
QuantXMarketScanner is a multi assets indicator for MT5 - Mathematical model based on 7 custom moving averages indicators  - Adaptable on Currencies, Stocks and Crypto - Automatic setup, self optimized About QuantXsystem Products: –         Simple installation & integration into MT5   –         Unlimited License after purchase (for one user) –         Automatic pattern recognition to identify the best timing and price levels. –         Trading indicators are displayed directly and automaticall
QuantXSTocks Trading Range Indicator for MT5: INSTRUCTIONS TO USE OUR INDICATOR:- User needs to take trade on Arrow or after an Arrow CandleStick, You can achieve up-to 35-125 pips target by this Indicator. Best Timeframes for Stocks and Indices are M30 and H1: AMAZON M30 (50 pips) TESLA M30 (50 pips) APPLE M30 (50 pips) ADOBE M30 (50 pips) NASDAQ100 H1 (125 pips) The above are the approximate amount of pips you can achieve by this Indicator, Green arrow appears to be buy arrow while the Red ar
Otros productos de este autor
AI Channel
Thalles Nascimento De Carvalho
4.2 (5)
Welcome to the presentation of the AI Channel indicator, a powerful tool that uses artificial intelligence for price channel analysis in the financial market. In this session, we will explore how this revolutionary indicator can assist investors and traders in making more informed and strategic decisions. Let's get started! I. What is the AI Channel indicator? AI Channel is an indicator developed based on advanced artificial intelligence algorithms. It utilizes historical price data of financial
FREE
Times and Sales Pro
Thalles Nascimento De Carvalho
Times and Sales Pro: Potencia tus Operaciones con el Desequilibrio del Flujo de Negociaciones Oportunidades en Pequeños Movimientos de Precio Times and Sales Pro es una herramienta esencial para los analistas que operan el flujo de órdenes a través de Times and Trades . Ideal para scalpers, ha sido diseñado para aquellos que buscan aprovechar pequeñas fluctuaciones de precio con alta precisión. Con un cálculo avanzado, el indicador identifica desequilibrios en las negociaciones, proporc
Big Player Range
Thalles Nascimento De Carvalho
5 (3)
Descubra el Poder de "BigPlayerRange": Su Aliado en el Análisis Técnico de Mercado Le presentamos BigPlayerRange , una herramienta avanzada de análisis técnico diseñada para revelar las zonas de interés institucional en el mercado. Con esta poderosa herramienta, podrá identificar con precisión las áreas donde los grandes jugadores están activos y mejorar sus estrategias de negociación. Características Principales: Mapeo de Zonas de Interés Institucional : BigPlayerRange destaca las zonas
VWAP FanMaster
Thalles Nascimento De Carvalho
VWAP FanMaster: ¡Domina la Estrategia de Pullback con Precisión! VWAP FanMaster es el indicador definitivo para traders que buscan entradas precisas y pullbacks efectivos . Combina la potencia del VWAP (Precio Medio Ponderado por Volumen) con las líneas de Fibonacci Fan , proporcionando un mapa claro de zonas de interés en el mercado. Características Principales Simple pero potente : Solo mueve las líneas verticales y el indicador trazará automáticamente el VWAP y las líneas de Fibonac
FREE
Imbalance DOM Pro
Thalles Nascimento De Carvalho
5 (1)
Imbalance DOM Pro: Potencia tus Operaciones con el Desequilibrio del Book ¿TIENES ACCESO AL BOOK DE ÓRDENES EN MT5? ¿QUIERES LLEVAR TU OPERATIVA A UN NUEVO NIVEL? Si eres un trader que utiliza el flujo de órdenes para tomar decisiones, Imbalance DOM Pro puede transformar tu análisis. Diseñado específicamente para scalpers y traders a corto plazo, identifica desequilibrios en el book de órdenes, revelando oportunidades valiosas para operaciones rápidas y precisas. Aprovecha Oportunidades
Box Weis Wave
Thalles Nascimento De Carvalho
5 (1)
¡Eleva tu análisis con el Weis Wave Box! Si buscas precisión y claridad en tus operaciones, el Weis Wave Box es la herramienta que necesitas. Este indicador avanzado ofrece un análisis visual detallado de las ondas de volumen y los puntos de swing, ayudándote a comprender mejor la relación entre esfuerzo y resultados en el mercado. Características Destacadas del Weis Wave Box: Ondas de Volumen Personalizables: Ajusta las ondas de volumen en ticks para adaptarlas a tus estrategias de trad
Swing Point Volume
Thalles Nascimento De Carvalho
Swing Point Volume, the indicator that signals weakness and strength at the tops and bottoms. This indicador can be for used the Wyckoff Method. Information provided; - Swing on customized ticks. - Volume and points in each balance sheet. - Percentage of Displacement. - Sound alert option on top and bottom breaks. - Volume in ticks and Real Volume. - Volume HL (extreme) or (opening and closing) - Customized volume shapes.
Cumulative Volume Bands
Thalles Nascimento De Carvalho
CVB Cumulative Volume Bands: ¡Potencia tus operaciones con el volumen acumulado! CVB Cumulative Volume Bands es un indicador avanzado diseñado para traders que buscan señales precisas basadas en el volumen acumulado. Utilizando bandas de volumen acumulado, este indicador ofrece lecturas claras de la presión de compra y venta en el mercado, ayudando a identificar reversiones y movimientos fuertes. Cumulative Volume Bands for MT5 ! Características principales: Análisis de volume
FREE
Volume Flow Binance
Thalles Nascimento De Carvalho
Volume Flow Binance! ¿Alguna vez imaginaste tener acceso a los times and trades de tu criptomoneda favorita, con detalles sobre el flujo de volúmenes y el análisis del movimiento de precios, incluso si tu bróker no ofrece acceso completo al historial de transacciones? ¡Con Volume Flow Binance , ahora es una realidad! Este script en MQL5 está diseñado para traders de criptomonedas que buscan una visión detallada de la dinámica del mercado en tiempo real. Características Principales
FREE
Book Data Binance
Thalles Nascimento De Carvalho
Book Data Binance! ¿Alguna vez has imaginado tener acceso al libro de órdenes de tu criptomoneda favorita, con detalles de precios, volúmenes y análisis de desequilibrio, incluso si tu intercambio no ofrece acceso al DOM? ¡Con Book Data Binance, eso ahora es una realidad! Este script en MQL5 fue especialmente desarrollado para traders de criptomonedas que buscan una visión profunda de la dinámica del mercado. Características Principales: Acceso directo al libro de órdenes de cualq
FREE
Atr Projection
Thalles Nascimento De Carvalho
El Indicador ATR Projeção destaca como una herramienta robusta en el análisis técnico, diseñada para proporcionar información precisa sobre los límites potenciales de movimiento de precios en el mercado financiero. Su enfoque flexible permite a los usuarios personalizar las métricas de análisis de manera intuitiva, adaptándose a las necesidades específicas de cada activo operado. Funcionamiento Personalizable: Por defecto, el ATR Projeção opera considerando el 30% de la media de los últimos 10
Long Short Pro
Thalles Nascimento De Carvalho
Indicador Long & Short - Versión Pro: ¡Desbloquea el Potencial Ilimitado de tu Análisis de Mercado! Sin Restricciones para Cualquier Activo La versión Pro del Indicador Long & Short te ofrece la libertad total para usarlo con cualquier activo financiero. ¡Sin más limitaciones, aplica el mismo indicador a todos tus activos favoritos! Sin Restricciones Disfruta de todas las funciones del indicador sin ninguna limitación. La versión Pro proporciona una experiencia completa e ilimitada,
Didi Index Volume
Thalles Nascimento De Carvalho
Presentamos el Didi Index Volume, un indicador de análisis técnico desarrollado por el trader brasileño Odir Aguiar, que destaca por su enfoque avanzado y poderoso en la identificación de oportunidades en el mercado financiero. Disponible en diversas plataformas, el Didi Index Volume se ha convertido en una herramienta esencial para los traders que buscan información precisa y valiosa para sus estrategias de negociación. El indicador combina el reconocido Didi Index, creado por Odir Aguiar, con
TimeChannel
Thalles Nascimento De Carvalho
El "Timechannel" es una poderosa herramienta de análisis técnico diseñada específicamente para traders que desean obtener una comprensión más profunda y precisa de los movimientos de precios en múltiples marcos de tiempo (multi-timeframe). Este indicador es una adición esencial al conjunto de herramientas de cualquier trader serio que busca tomar decisiones comerciales informadas y basadas en datos. Características clave: - Análisis Avanzado de Múltiples Timeframes: Timechannel permite a los t
Master OBV
Thalles Nascimento De Carvalho
MasterOBV: ¡Domina las Tendencias del Mercado con Precisión! MasterOBV es un indicador de análisis técnico que combina volumen , correlación positiva y una Media Móvil (MA) para refinar la identificación de tendencias en los mercados financieros. Principales Funcionalidades: Volumen Inteligente: Analiza el volumen de negociación para identificar cambios significativos en la fuerza de la tendencia. Correlación Positiva: Incorpora activos correlacionados para una visión más amplia y pr
VolaMetrics VSA
Thalles Nascimento De Carvalho
VolaMetrics VSA | Un Aliado Poderoso en el Análisis Técnico El VolaMetrics VSA es un indicador de análisis técnico que combina la metodología Volume Spread Analysis (VSA) con un análisis detallado del volumen de operaciones . Diseñado para identificar y rastrear movimientos significativos en los precios , el VolaMetrics VSA utiliza la interacción entre volumen y spread de precios para proporcionar información valiosa que puede ayudar en la toma de decisiones de trading. Fundamentos del Volume
SwingVolumePro
Thalles Nascimento De Carvalho
Visión General SwingVolumePro es un indicador avanzado y versátil, diseñado para aplicarse a una amplia gama de activos financieros y soportar diferentes estilos de operación. Desarrollado sobre la base de un análisis riguroso de volumen y precio, ofrece señales claras y precisas que permiten a los traders de todos los niveles tomar decisiones informadas basadas en datos de alta calidad. SwingVolumePro.PDF Características Principales Versatilidad: SwingVolumePro puede aplicarse a dive
CVD SmoothFlow Pro
Thalles Nascimento De Carvalho
CVD SmoothFlow Pro - ¡Análisis de Volumen Ilimitado para Cualquier Activo! CVD SmoothFlow Pro es la solución definitiva para traders que buscan un análisis de volumen preciso e ilimitado. Utilizando el cálculo de Cumulative Volume Delta (CVD) con filtrado avanzado de ruido, la Versión Pro ofrece la flexibilidad y precisión necesarias para operar en cualquier activo financiero. ¿Qué ofrece CVD SmoothFlow Pro? Análisis Claro : Filtra el ruido y destaca los movimientos de volumen significativ
Cumulative Vol Bands
Thalles Nascimento De Carvalho
CVB Cumulative Volume Bands: ¡Potencia tus operaciones con el volumen acumulado! CVB Cumulative Volume Bands es un indicador avanzado diseñado para traders que buscan señales precisas basadas en el volumen acumulado. Utilizando bandas de volumen acumulado, este indicador ofrece lecturas claras de la presión de compra y venta en el mercado, ayudando a identificar reversiones y movimientos fuertes. Características principales: Análisis de volumen acumulado : Detecta puntos clave de
ZigWave Oscillator
Thalles Nascimento De Carvalho
ZigWave Oscillator: ¡Potencia tus operaciones con osciladores y ZigZag! El ZigWave Oscillator es la herramienta perfecta para traders que buscan precisión y claridad al analizar el mercado financiero. Este indicador combina la fuerza de los osciladores con la simplicidad visual del ZigZag, ayudándote a identificar las mejores oportunidades de compra y venta con rapidez y eficiencia. ¿Por qué elegir ZigWave Oscillator? Análisis preciso de osciladores : Integra RSI, Williams %R o CCI par
Imbalance DOM Crypto
Thalles Nascimento De Carvalho
Imbalance DOM Crypto: Potencia tus Operaciones con el Desequilibrio del Libro en Criptomonedas Oportunidades en Pequeños Movimientos de Precio Imbalance DOM Crypto es una herramienta esencial para analistas que operan con el flujo de órdenes en criptomonedas. Perfecto para scalpers, fue desarrollado para aquellos que buscan aprovechar pequeñas oscilaciones de precio con alta precisión. Con cálculos avanzados, el indicador identifica desequilibrios en el libro de ofertas, proporcionando
Times and Sales Crypto
Thalles Nascimento De Carvalho
Times and Sales Crypto: Potencia tus operaciones con Times and Sales en criptomonedas Aprovecha los pequeños movimientos de precio con precisión Times and Sales Crypto es una herramienta esencial para traders que operan con flujo de órdenes en criptomonedas. Perfecto para scalpers, está diseñado para aquellos que buscan aprovechar las pequeñas fluctuaciones de precio con alta precisión. Usando cálculos avanzados, el indicador utiliza datos de times and sales para proporcionar señales va
Filtro:
No hay comentarios
Respuesta al comentario