WPR support resistance Level
- Indicadores
- Sunnykumar R Patel
- Versión: 1.1
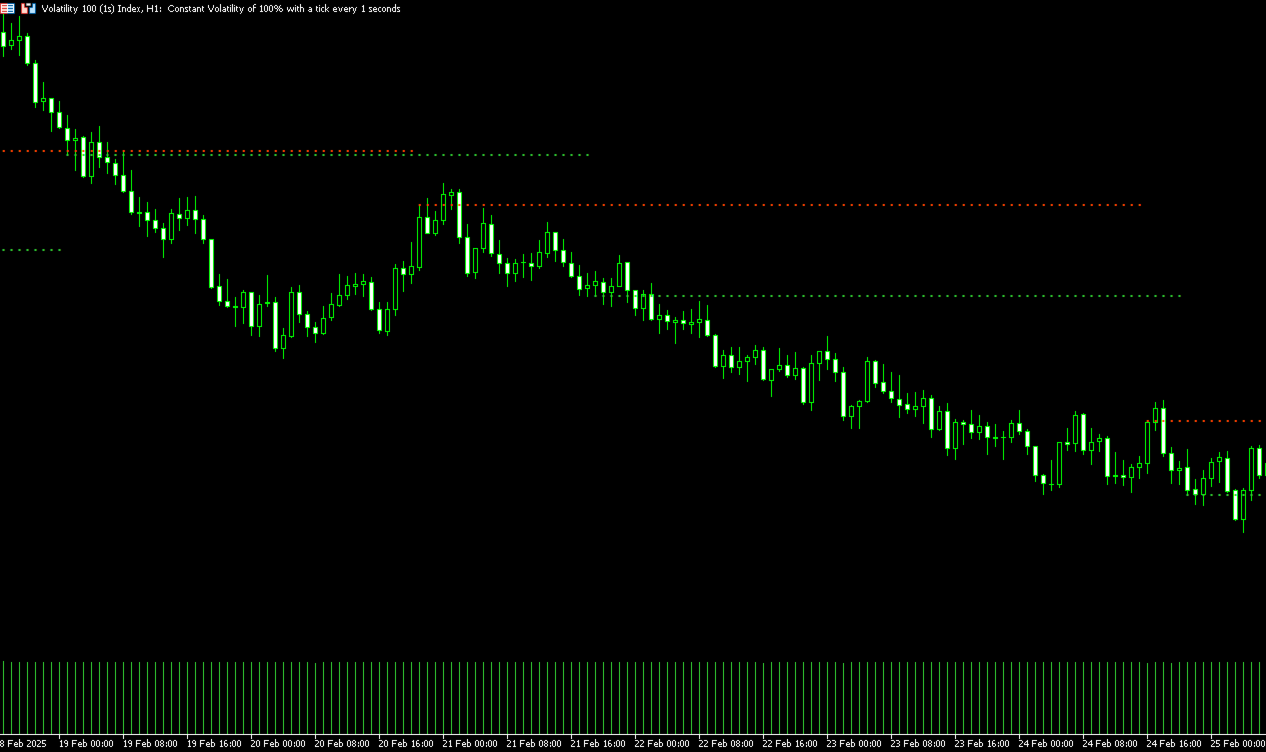
The Support and Resistance Levels Finder:
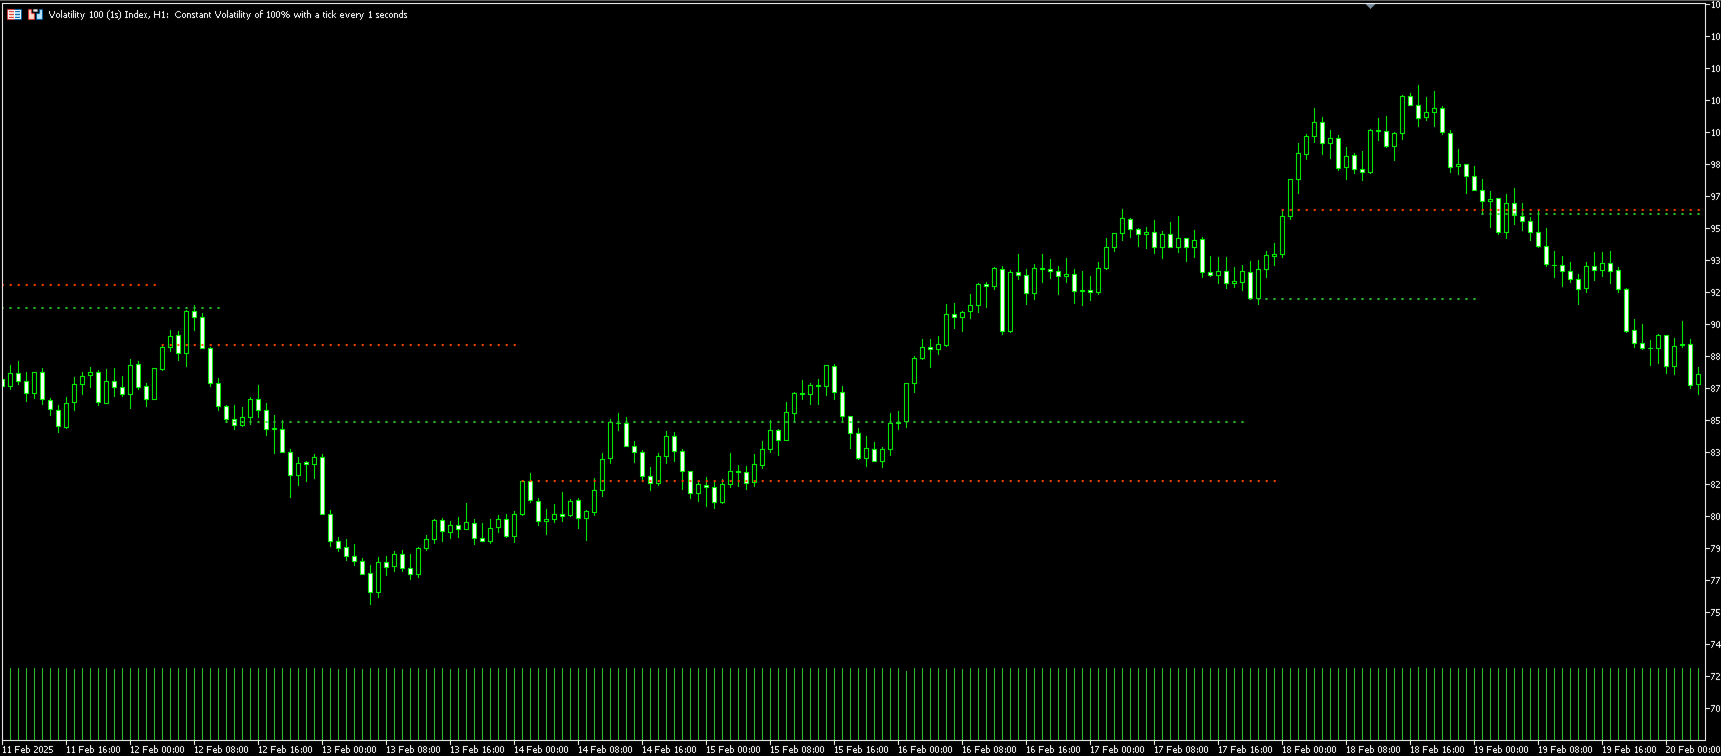
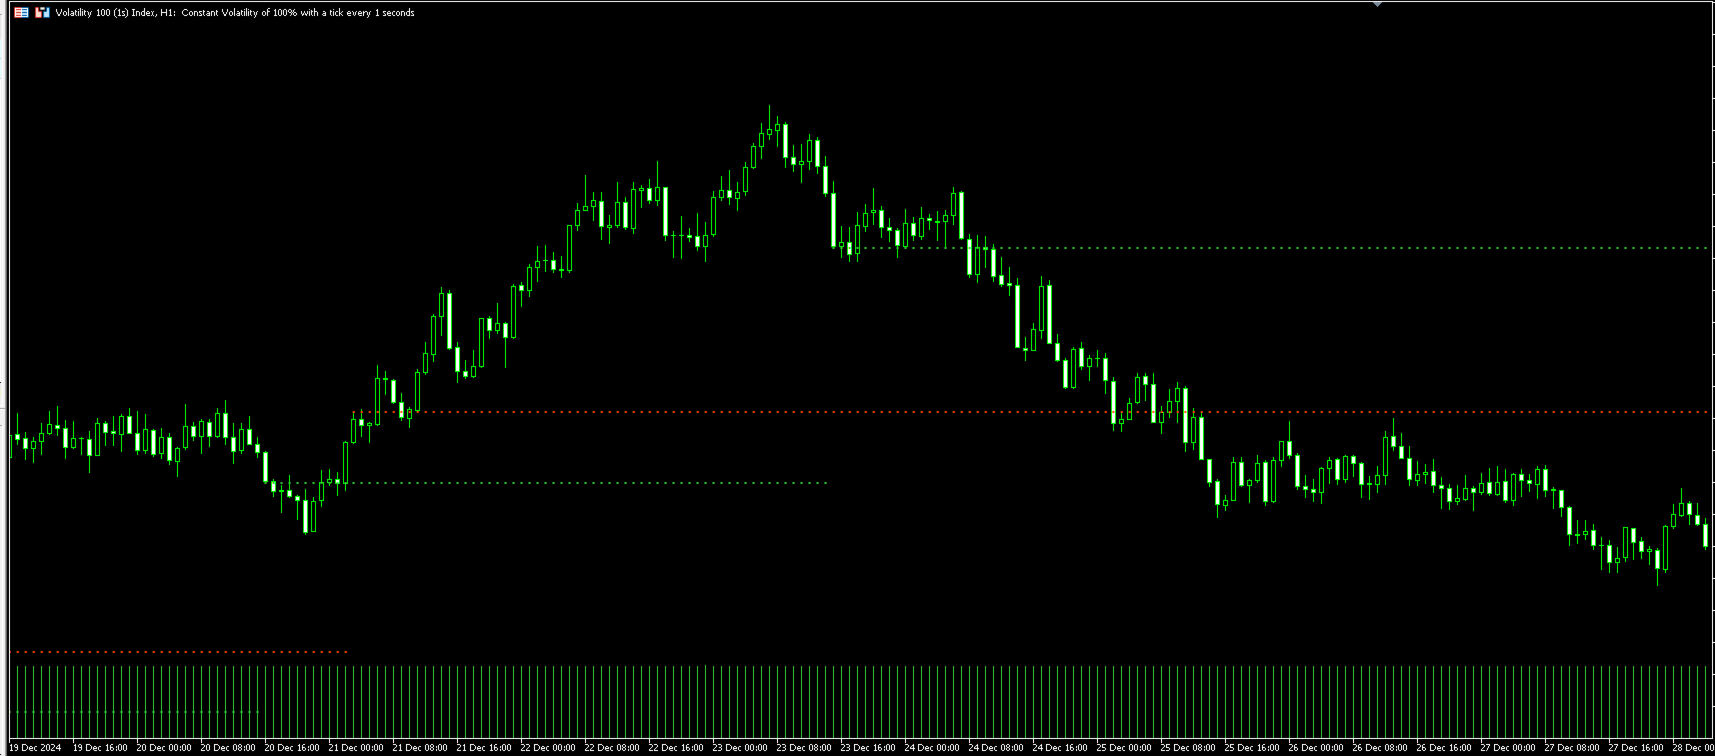
The Support and Resistance Levels Finder is an advanced tool designed to enhance technical analysis in trading. Featuring dynamic support and resistance levels, it adapts in real-time as new key points unfold on the chart, providing a dynamic and responsive analysis. Its unique multi-timeframe capability allows users to display support and resistance levels from different timeframes on any desired timeframe, offering a nuanced perspective, such as showing daily levels on a five-minute chart. Utilizing a smart algorithm that incorporates historical data sets it apart from other S&R indicators, ensuring a comprehensive analysis. The tool employs multi-parameter calculations when detecting levels, contributing to its accuracy. Users can customize the colors of support and resistance levels individually, creating a personalized visual experience. The tool also includes alert features to notify traders when the price is approaching crucial levels, enhancing timely decision-making. With convenient functionalities like a hide and show button, as well as a hotkey for quick toggling of levels' visibility, the Support and Resistance Levels Finder provides a versatile and user-friendly solution for traders seeking precision and flexibility in their technical analysis.
Features:
- Support and Resistance Level: Adjust as new important key points unfold on the chart.
- Multi timeframes Support and Resistance Levels: ability to display any timeframes levels on any other timeframe. Example daily levels on M5.
- Use smart algorithm that include historical data unlike other S&R Indicators.
- Use multi-parameters calculation when detecting levels.
- Accurate Support and Resistance Levels.
- Custom colors for Support and Resistance levels each individually.
- Alert when the price is near important levels.
- Comes with hide and show button.
- Comes with hotkey to hide and show levels.