FVG and IFVG Indicator MT4
- Indicadores
- Eda Kaya
- Versión: 1.11
- Activaciones: 10
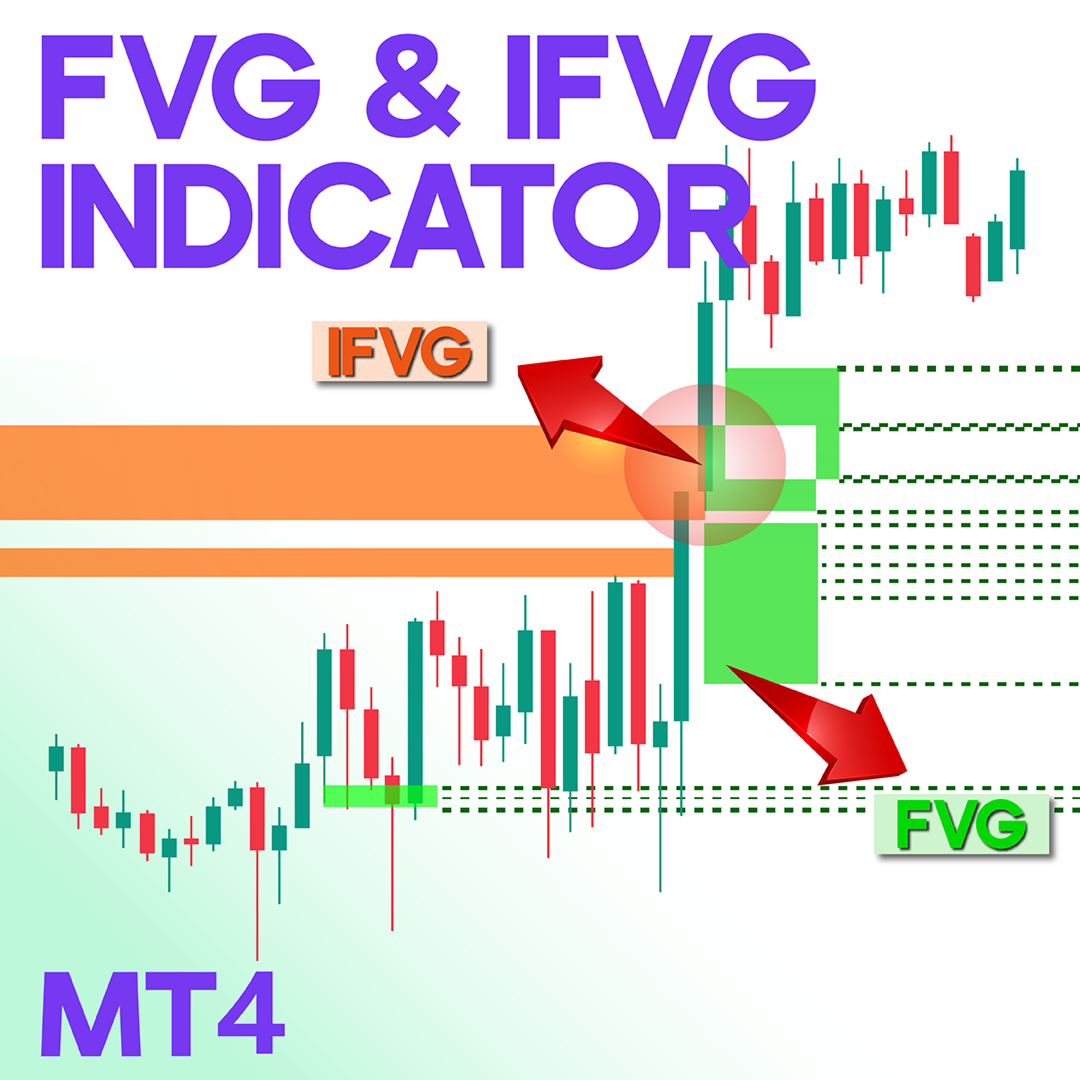
FVG and IFVG Indicator MT4
The Fair Value Gap (FVG) and Improved Fair Value Gap (IFVG) indicator for MetaTrader 4 identifies crucial liquidity zones based on the Inner Circle Trader (ICT) methodology. Fair Value Gaps emerge when rapid price fluctuations create unfilled price regions due to heightened volatility. Over time, prices often revisit these gaps. The Improved Fair Value Gaps (IFVG) function similarly but shift their role upon a breakout, acting as a support or resistance level afterward.
«Indicator Installation & User Guide»
MT4 Indicator Installation | FVG and IFVG Indicator for MT5 | ALL Products By TradingFinderLab | Best MT4 Indicator: Refined Order Block Indicator for MT4 | Best MT4 Utility: Trade Assistant Expert TF MT4 | TP & SL Tool: Risk Reward Ratio Calculator RRR MT4 | Money Management: Easy Trade Manager MT4
Indicator Specifications Table
| Category | ICT - Smart Money - Liquidity |
| Platform | MetaTrader 4 |
| Skill Level | Advanced |
| Indicator Type | Trend-following - Reversal - Breakout |
| Timeframe | Multi timeframe |
| Trading Style | All styles |
| Market | Forex - Cryptocurrency - Stocks |
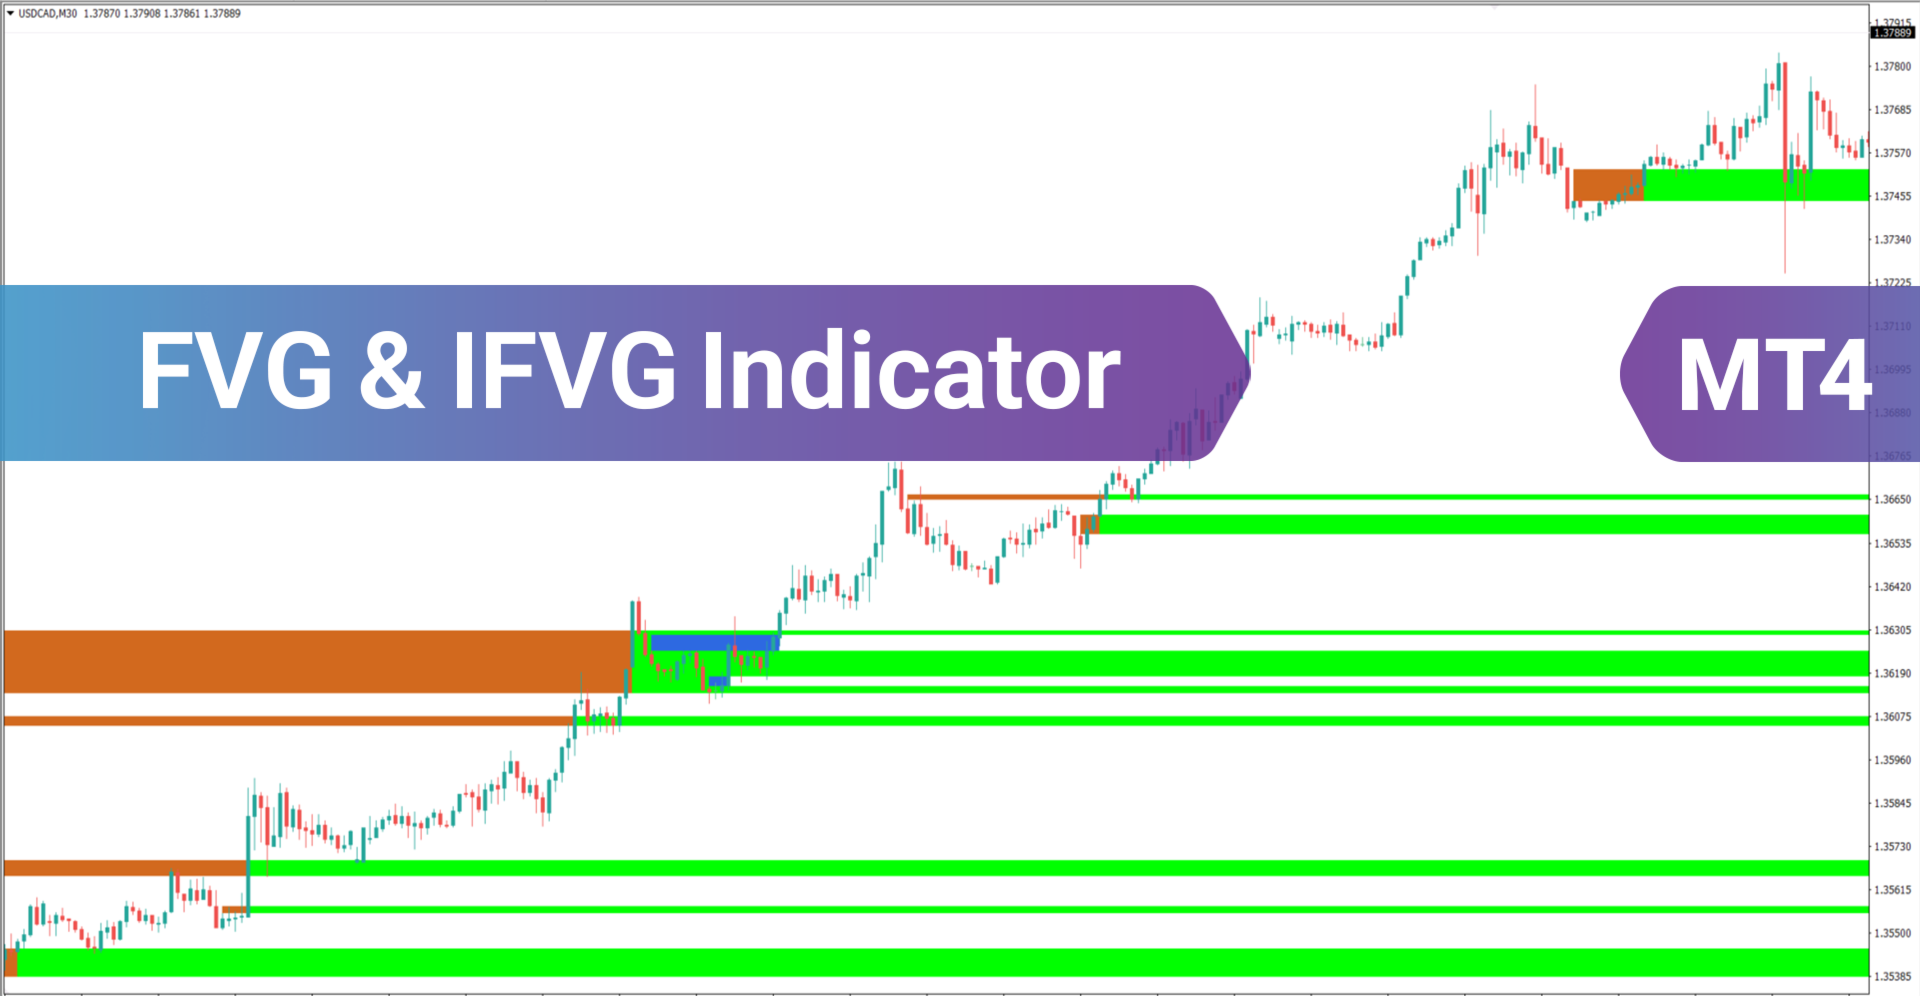
Indicator at a Glance
The FVG and IFVG zones serve as critical reversal areas where price revisits can create optimal trade entries. By automatically detecting and marking these regions, the indicator enhances the speed and accuracy of market analysis, reducing the need for manual drawing. These gaps are widely used in ICT and Smart Money trading strategies for identifying reversal opportunities.
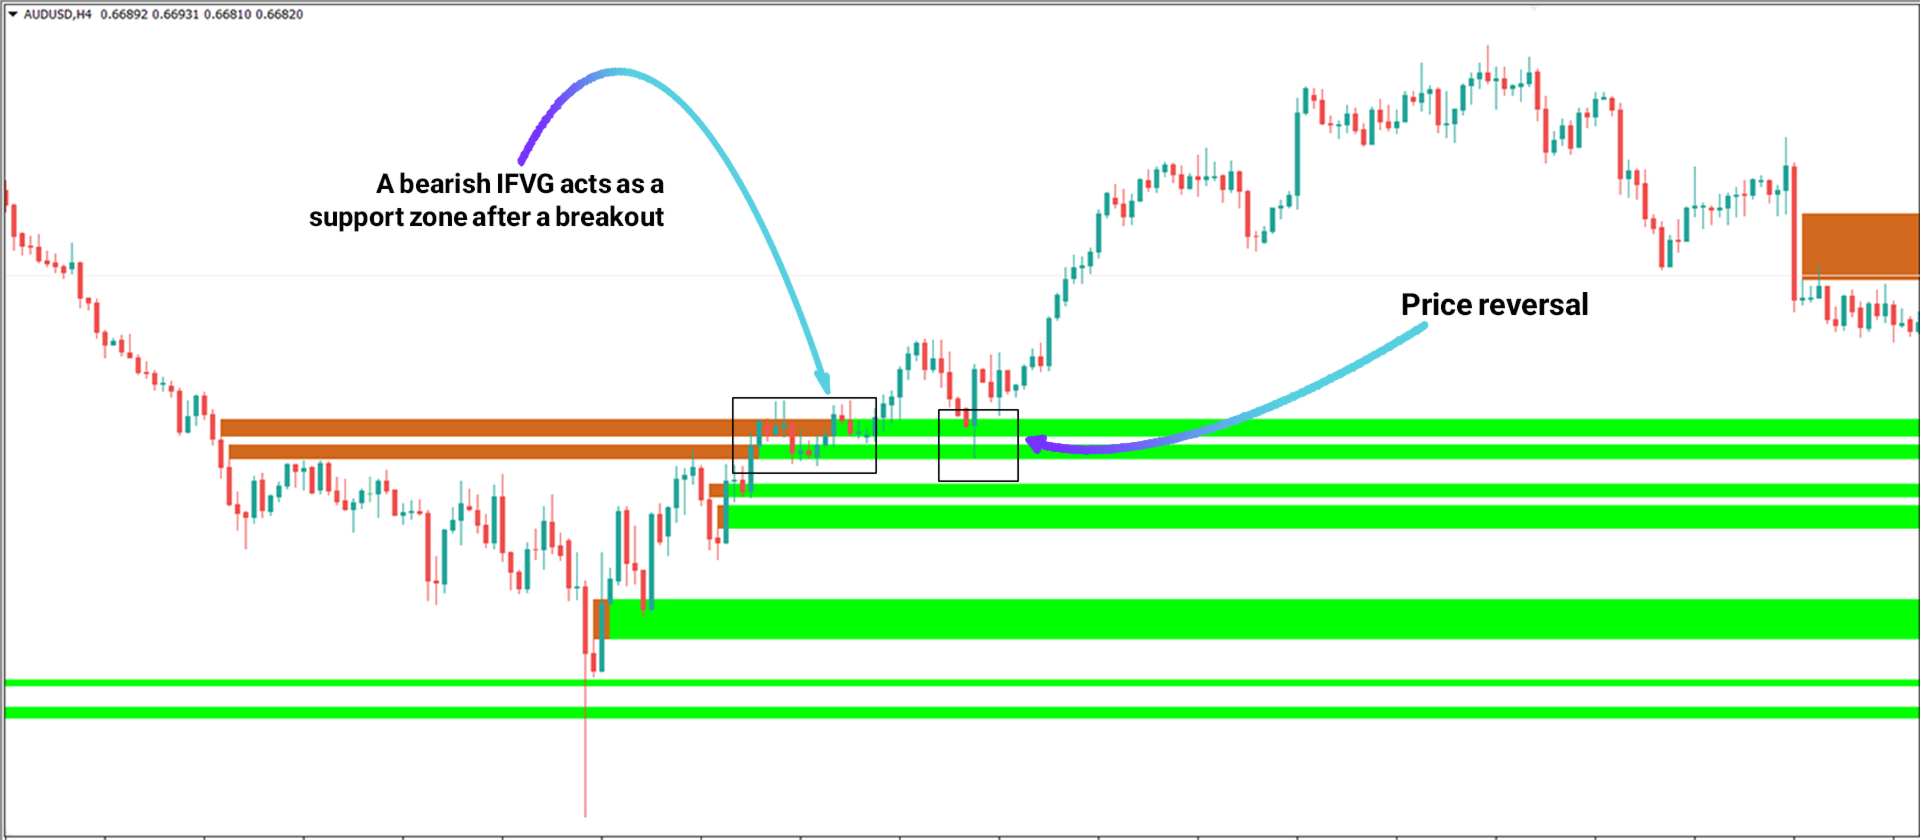
Indicator Performance in an Uptrend
Analyzing the AUD/USD pair on a 4-hour chart, the IFVG zone, initially red, turns green when broken by bullish momentum. In this scenario, the previous resistance zone converts into a support level. Once the price retraces back to this zone, it presents an ideal opportunity for opening long positions (buy trades).
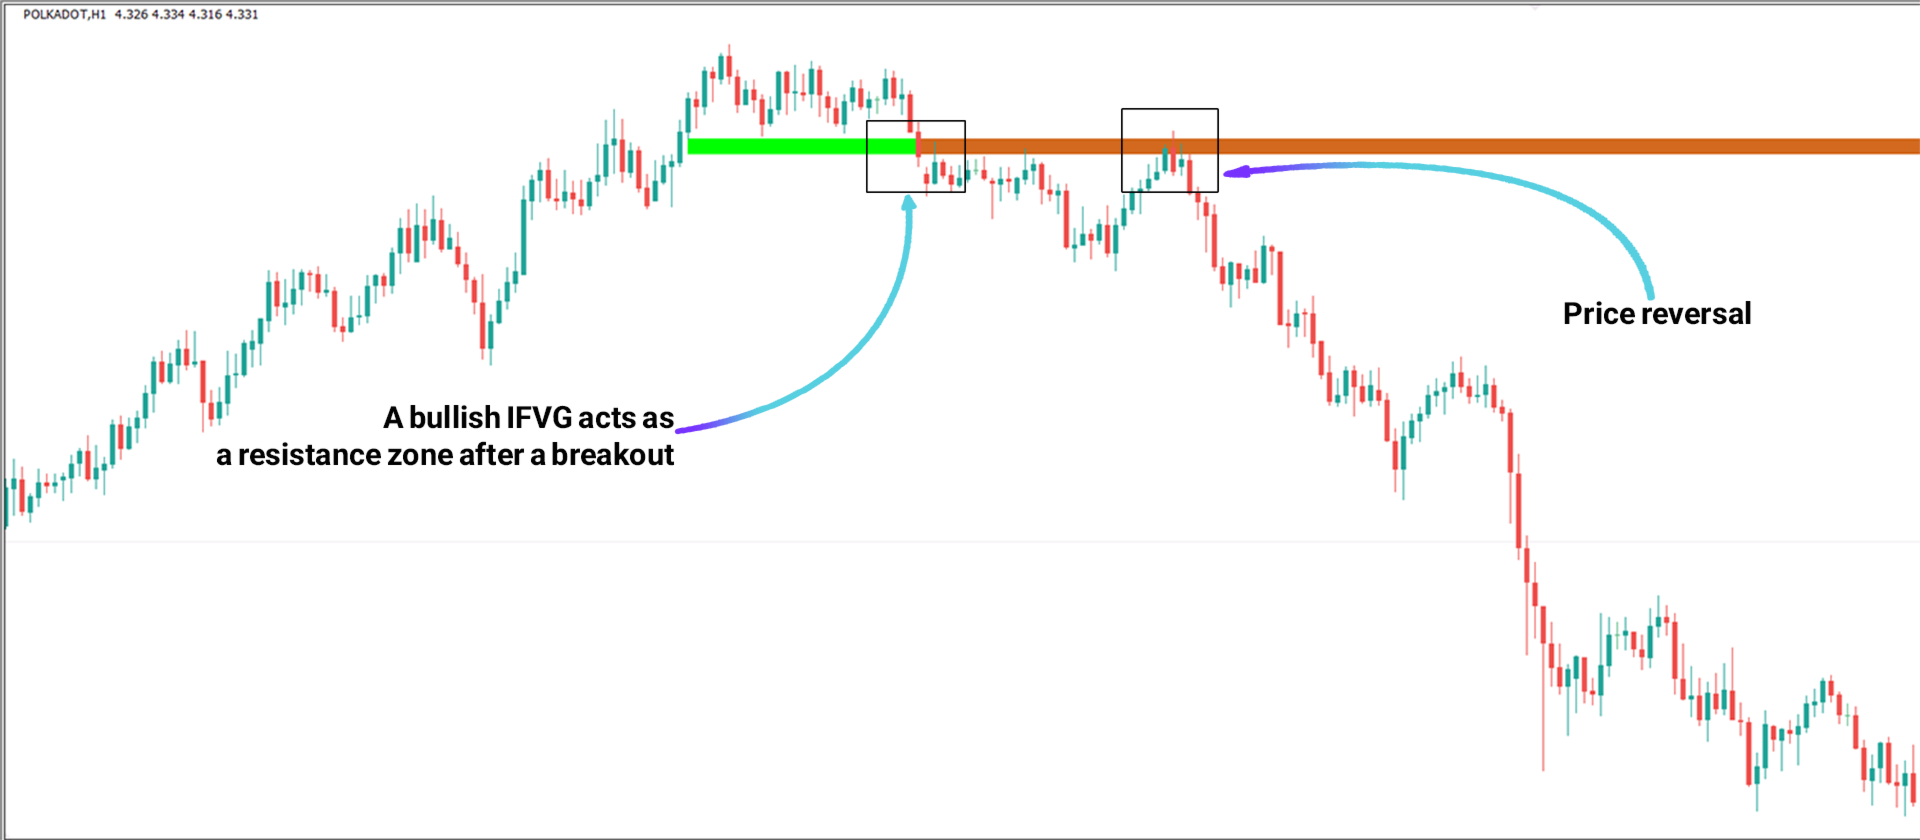
Indicator Performance in a Downtrend
Examining the Polkadot (DOT) 1-hour chart, the bullish IFVG zone shifts from green to red after a breakdown. This transition signifies a support level turning into resistance. When the price revisits the IFVG zone, it offers a strategic moment to initiate short positions (sell trades).
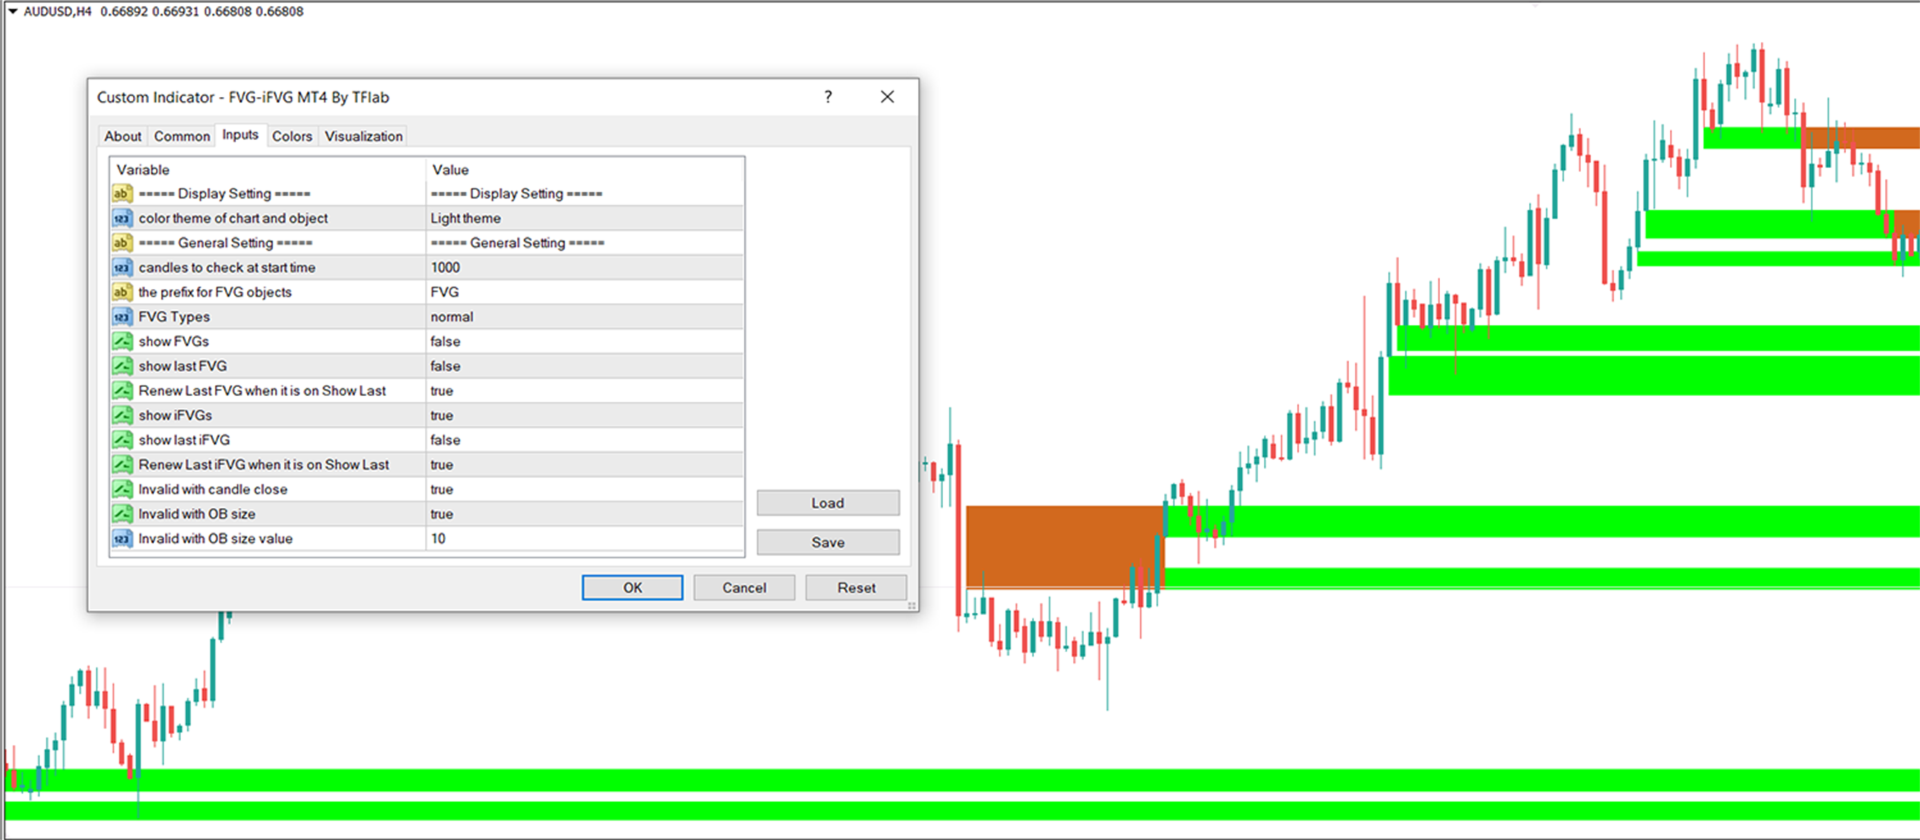
Indicator Settings
- Chart and Object Theme: Customize the chart and object colors.
- Initial Candle Check: Defines how many past candles (default: 1000) are analyzed for zone formation.
- FVG Object Prefix: Set a unique naming prefix for FVG objects.
- FVG Types: Configure different types of FVG zones.
- Show FVGs: Enable or disable FVG display.
- Show Last FVG: Display only the most recent FVG.
- Renew Last FVG: Update the last FVG dynamically.
- Show IFVGs: Toggle IFVG visibility.
- Show Last IFVG: Display only the most recent IFVG.
- Renew Last IFVG: Update the last IFVG dynamically.
- Zone Invalidation: Options to invalidate zones based on candle close or Order Block (OB) size.
- OB Size Threshold: Define the OB size for invalidation criteria.
Summary
The FVG and IFVG indicators provide automatic detection of two fundamental price reversal zones, allowing traders to pinpoint high-probability opportunities. Since price frequently revisits these areas to absorb pending liquidity, traders can leverage these zones for strategic trade entries when price movement reverse.