Drawing Assistance MT5
- Indicadores
- Sopheak Khlot
- Versión: 1.0
- Activaciones: 5
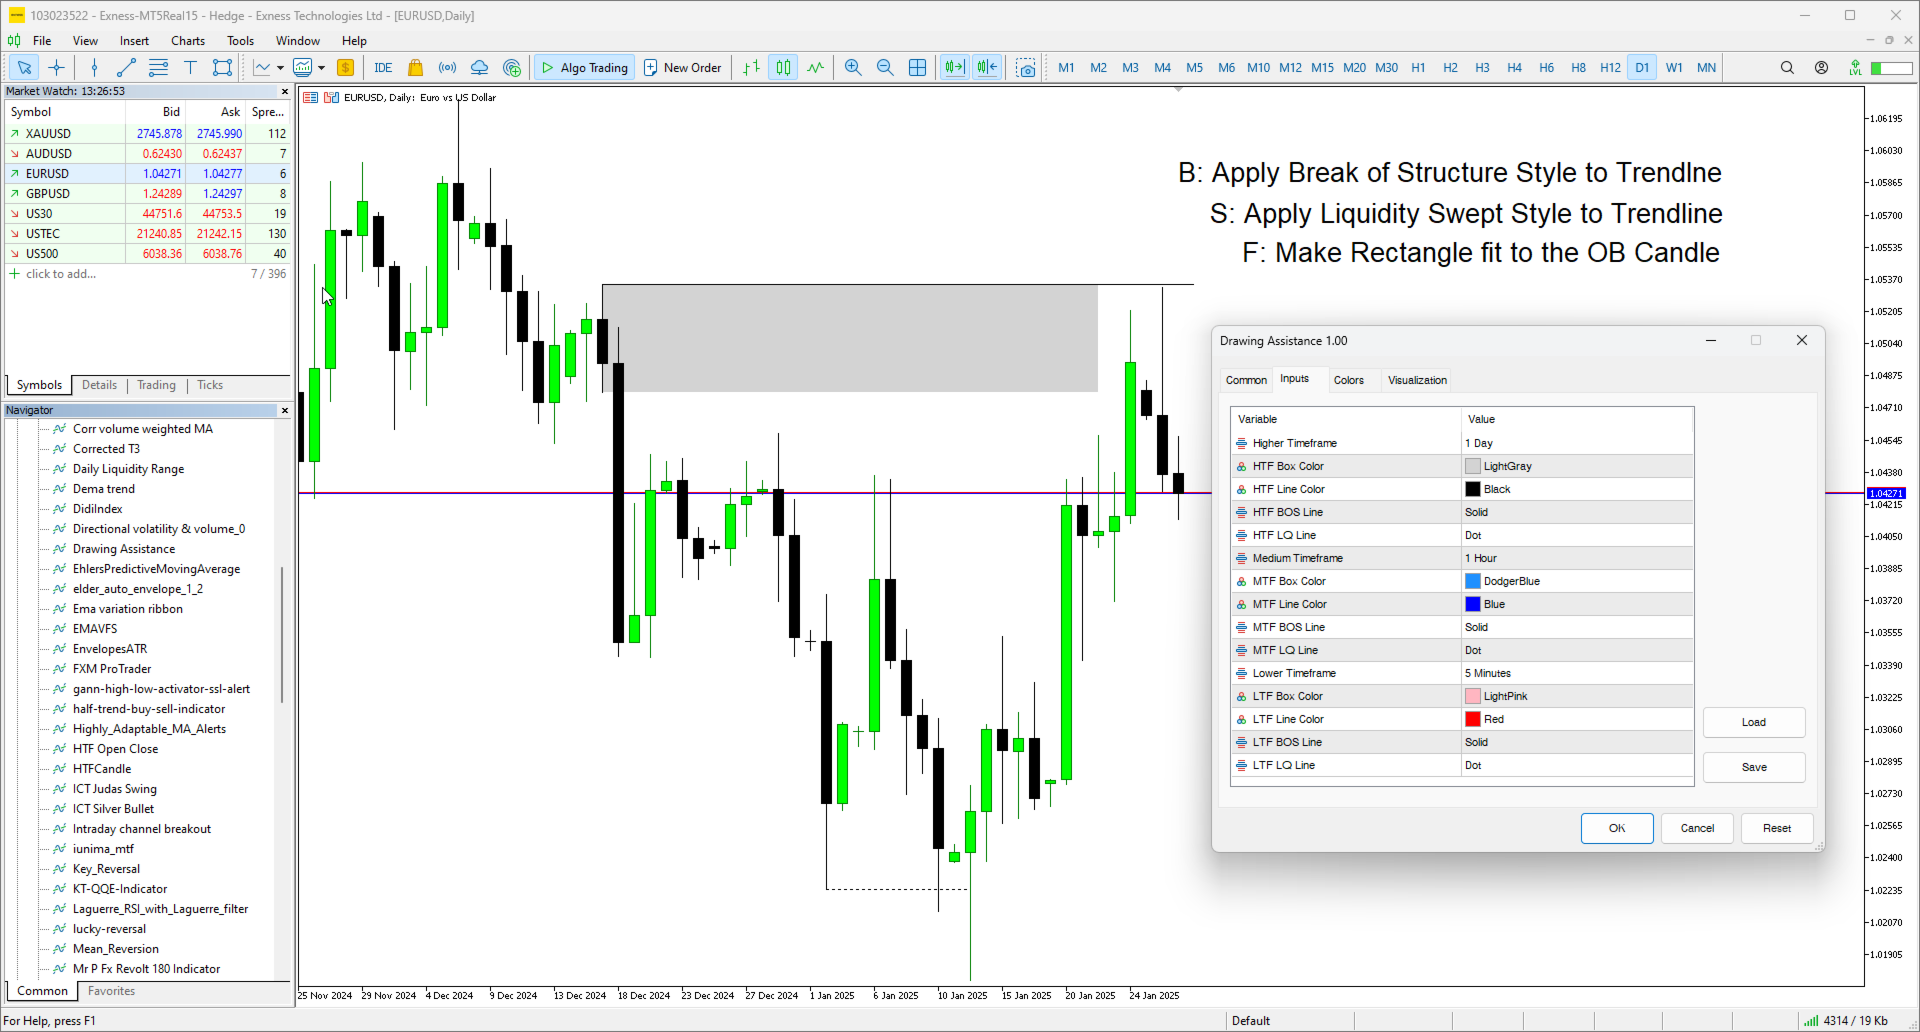
As an ICT or SMC trader you must do top-down analysis, and you struggle to make template of drawing object on Metatrader just like you normally do on Tradingview. Well, Drawing Assistance indicator will make your top-down analysis much easier on Metatrader.
- Allow to design template for 3 timeframes. (HTF, MTF and LTF).
- Each objects drawn on chart will have the color, style and visibility individually by the timeframe it was drawn on.
- Save time as all analyzing is done on Metatrader chart.