KT Range Filter Buy and Sell MT4
- Indicadores
- KEENBASE SOFTWARE SOLUTIONS
- Versión: 1.1
- Actualizado: 31 marzo 2025
- Activaciones: 10
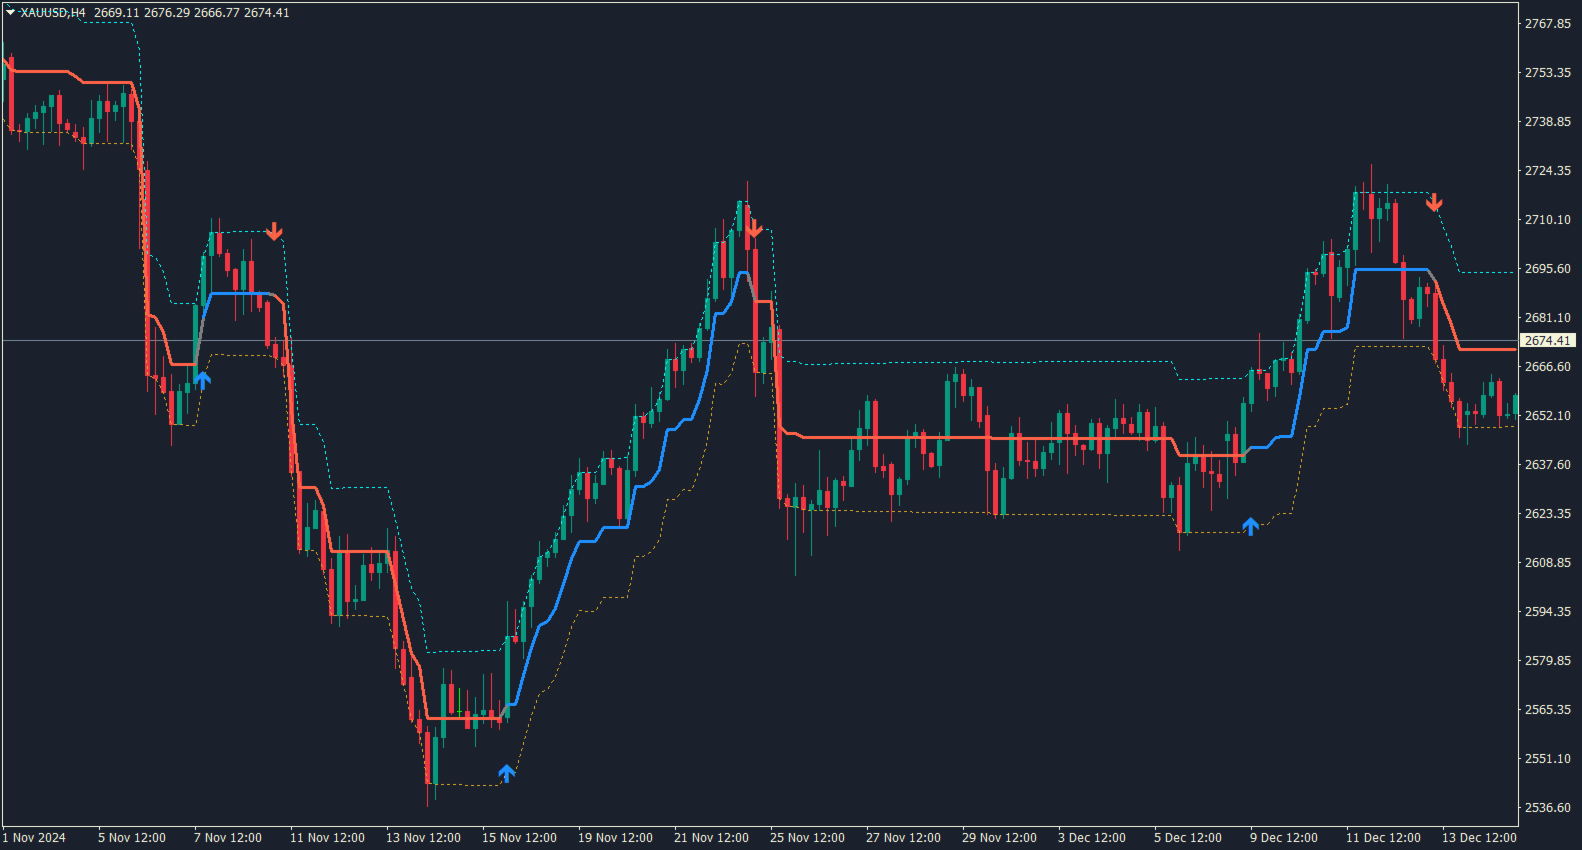
Cuenta con una estructura de tres bandas, que consiste en una línea de promedio principal acompañada por una banda superior y una inferior. Estas bandas se calculan usando un multiplicador de rango, lo que proporciona una representación visual clara del movimiento del precio dentro de límites definidos.
Características
- Ayuda a identificar tendencias y genera señales precisas de compra y venta al filtrar el ruido del mercado. Su versatilidad lo convierte en una excelente opción para traders con diferentes estilos.
- Diseñado con una interfaz fácil de usar y amplias opciones de personalización, es ideal tanto para principiantes como para traders experimentados. Ofrece información valiosa para mejorar las estrategias y decisiones de trading.
- Mantente al tanto del mercado con soporte completo para todas las alertas de MetaTrader. Esta función garantiza que siempre estés informado y no te pierdas ningún movimiento importante del mercado.
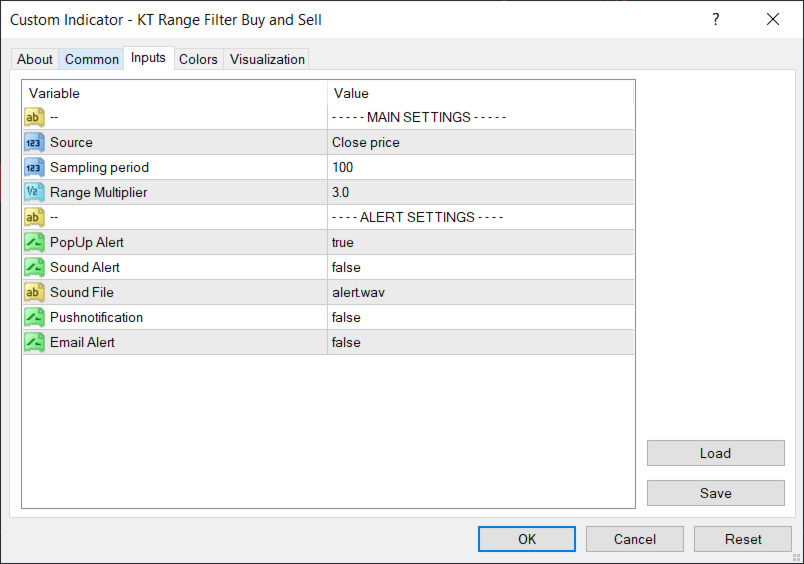
Parámetros
Está diseñado para ser fácil de usar, lo que lo hace accesible tanto para principiantes como para traders con experiencia. Su interfaz intuitiva requiere solo unos pocos ajustes simples para comenzar, permitiendo una personalización rápida según las necesidades del usuario.
Ofrece amplias opciones de personalización, lo que permite a los traders adaptarlo a sus estrategias específicas. Los usuarios pueden ajustar configuraciones como la visibilidad de las líneas de promedio y las bandas, facilitando la interpretación clara y precisa de las señales.
Resumen
En resumen, ofrece una variedad de funciones diseñadas para mejorar las decisiones de trading. Gracias a su interfaz intuitiva y opciones de personalización, se adapta a traders de todos los niveles.
Al filtrar los movimientos del precio, ayuda a resaltar tendencias importantes y rupturas, convirtiéndose en una herramienta valiosa para mejorar el rendimiento en el mercado.