• Información general
  • Comentarios
  • Discusión
  • Novedades

Pocket Option OTC GreenLine

Indicator Title: Pocket Options GreenLine Strategy

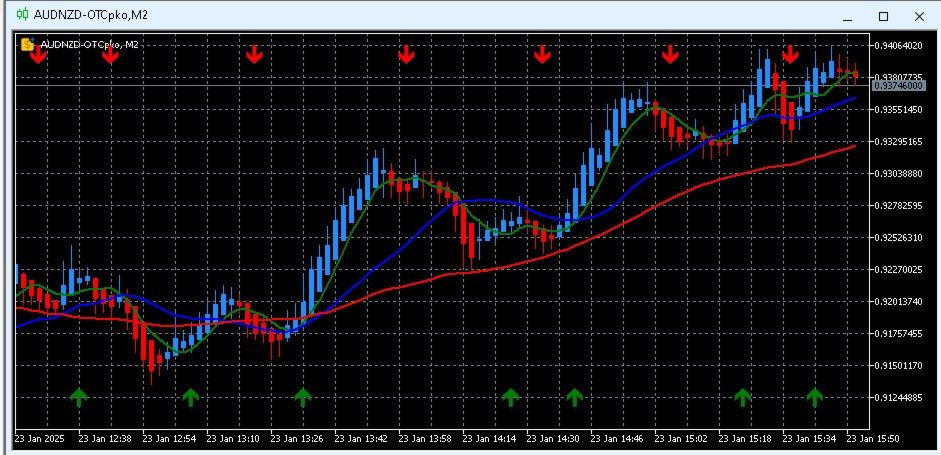
This version of the Greenline will do Sell Alerts while in the Uptrend, in other words is MA1 Crosses below MA2 with out going below MA3 then a sell alert will be issued

Some Users requested this as they want to get as many signals as possible.

SMA(7) with File Logging for Buy and Sell Alerts

Overview:

This SMA(7) indicator is designed to provide actionable Buy and Sell signals based on the interaction between price and the Simple Moving Average (SMA). It uses a methodical approach of trend confirmation based on a sequence of candles and offers visual, audio, and file-based alerts to ensure traders never miss a signal.

The indicator is particularly well-suited for OTC markets, such as Pocket Options, and is fully integrated with the AutoSignal App, AutoSignal_connect Bot, and EABiBOT for enhanced automated trading. With its user-friendly design, customizable settings, and robust trend detection logic, this tool is ideal for traders who rely on technical analysis to make confident trading decisions.

Key Features:

  1. SMA(7) Trend Detection:

    • The indicator calculates a 7-period Simple Moving Average (SMA), which acts as a reference line for identifying price trends.
    • Signals are triggered based on the position of the price relative to the SMA:
      • Buy Signal: Price crosses above the SMA, confirming an uptrend.
      • Sell Signal: Price crosses below the SMA, confirming a downtrend.
  2. Candle Confirmation Logic:

    • Signals are not triggered immediately upon a crossover but are validated by analyzing a sequence of candles:
      • For a Buy Signal, at least two consecutive green candles above the SMA are required for confirmation.
      • For a Sell Signal, at least two consecutive red candles below the SMA are required for confirmation.
    • This ensures that signals are only generated during sustained trends, reducing false positives in choppy markets.
  3. Buy and Sell Alerts:

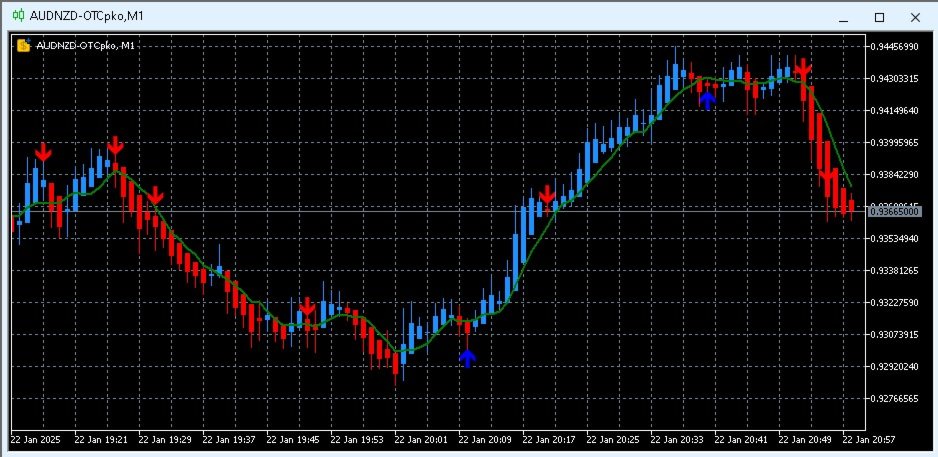
    • The indicator provides visual arrows on the chart:
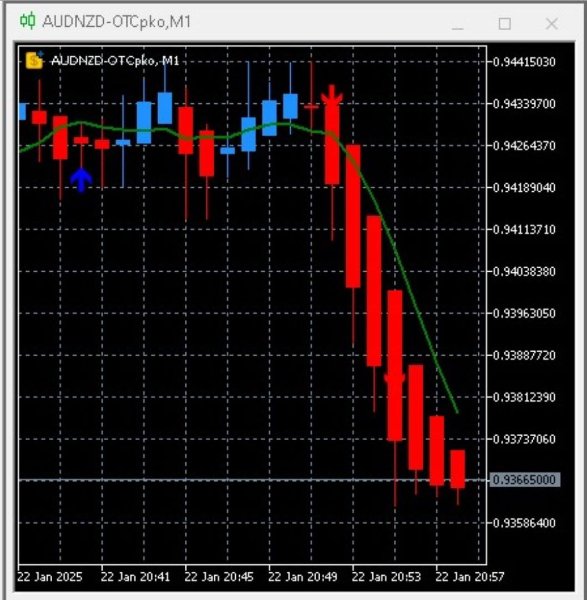
      • Blue Arrow (Buy Signal): Placed below the low of the candle, indicating an entry point.
      • Red Arrow (Sell Signal): Placed above the high of the candle, indicating an exit or short position.
    • Alerts are logged to a file ( alerts.txt ) for easy reference and review.
    • Audio Alerts notify traders of opportunities in real-time, ensuring they never miss a signal.
    • A customizable cooldown period prevents repetitive alerts within a short time frame.
  4. Integration with AutoSignal and Bots:

    • The indicator works seamlessly with the following tools for automated trading:
  5. Customizable Settings:

    • SMA Period: Users can adjust the period of the SMA to fit their trading style and market conditions.
    • Arrow Offset: The position of the Buy/Sell arrows relative to the candles is adjustable.
    • Alert Cooldown: Prevents duplicate alerts within a user-defined time frame.
    • Signal Modifications: Option to allow or disable signal settings modifications.
  6. Robust File Logging:

    • All alerts are logged to an external file ( alerts.txt ), enabling traders to review their trades and signals for better analysis and record-keeping.
  7. Designed for OTC Markets:

    • The indicator is optimized for Pocket Options OTC markets, which are known for high volatility and price trends.
    • Its trend-confirmation logic reduces noise and false signals, making it highly reliable for OTC trading.

How It Works:

  1. Calculation of SMA(7):

    • The indicator calculates a 7-period SMA using the closing prices of candles. This SMA serves as a dynamic reference line for trend identification.
  2. Signal Generation Logic:

    • Buy Signal:
      • Price must cross above the SMA.
      • Two consecutive green candles (bullish candles) must close above the SMA.
      • A blue arrow is displayed below the low of the second green candle as a visual Buy signal.
    • Sell Signal:
      • Price must cross below the SMA.
      • Two consecutive red candles (bearish candles) must close below the SMA.
      • A red arrow is displayed above the high of the second red candle as a visual Sell signal.
  3. Visual and Audio Alerts:

    • When a signal is generated, the indicator triggers:
      • A visual Buy (blue) or Sell (red) arrow on the chart.
      • An audio alert notifying the trader of the signal.
      • Logging of the alert in the alerts.txt file.
  4. File Logging:

    • Alerts are recorded in the format:

      css
      Copy Edit
      [2025.01.22 14:35:12] [EURUSD PERIOD_M1] Buy Signal | Final confirmation after green candle sequence

    • This log provides a history of all signals generated by the indicator.
  5. Prevention of False Signals:

    • The indicator ensures only valid signals are generated by requiring a specific sequence of candles to confirm the trend.
    • A cooldown period prevents repetitive alerts for the same signal, reducing noise.

Input Parameters:

  1. SMA Settings:

    • SMA_Period : Period for the Simple Moving Average (default: 7).
  2. Signal Customization:

    • SignalOffset : Distance between the signal arrows and the candle (default: 0.2).
    • AlertCooldown : Time (in seconds) to prevent duplicate alerts (default: 60).
    • AllowModifications : Allow or disallow changes to the signal logic (default: true).
  3. Visual Arrows:

    • Blue arrow for Buy signals.
    • Red arrow for Sell signals.

Who Should Use This Indicator?

  • Pocket Options Traders:
    • Optimized for OTC markets, where trends are more prominent and less random compared to regular markets.
  • Trend Traders:
    • Ideal for those who rely on moving average crossovers and candle confirmations for trade decisions.
  • Traders Using Automation:
    • The integration with AutoSignal App, AutoSignal_connect Bot, and EABiBOT makes this indicator perfect for traders looking to automate their trading processes.

Important Notes for Users:

  1. Integration Requirements:

  2. No Guarantees of Success:

    • While this indicator provides reliable signals, no guarantees of success are provided.
    • The indicator's performance depends on market conditions and the settings chosen by the user.
  3. Default Settings:

    • The indicator is set to default settings, which work well for most trading scenarios.
    • Users can adjust the settings to suit their specific trading style or market conditions.
  4. Backtesting and Demo Trading:

    • It is highly recommended to backtest the indicator on historical data and use it on a demo account before live trading.
    • Ensure you understand the signal logic and behavior before relying on it for real trades.

Summary:

The SMA(7) with File Logging for Buy and Sell Alerts indicator is a highly effective tool for OTC traders. By combining SMA crossover signals with candle confirmation logic, it ensures reliable trend-based trading opportunities. Its integration with the AutoSignal App, AutoSignal_connect Bot, and EABiBOT enables seamless automation, making it an essential addition to any trader’s toolkit.


Productos recomendados
DeMarker (DeM) indicator is another member of the Oscillator family of technical indicators. Traders use the index to determine overbought and oversold conditions, assess risk levels, and time when price exhaustion is imminent. This indicator shows DeMarker data from 9 currency pairs of your choice for all 9 timeframes. If a digital value of DeM is less or equal to DnLevel = 0.3 (or whatever number you decided to put), Green square appears. This is potentially an oversold condition and may be a
Description Trend Influencer is an indicator that determines the potential dynamics of the influence of trend wave movements on the market. The indicator is based on the value of moving averages corrected by the standard deviation. The indicator is displayed as a main dash-dotted moving average and a signal solid moving average. The signal moving average is colored blue or red depending on what type of trend is currently observed in the market. The indicator also draws inhibition levels - blue a
Delta EMA is a momentum indicator based on the changes of closing price from one bar to the next. It displays a histogram of the exponential moving average of those changes, showing magnitude and direction of trend. Positive delta values are displayed as green bars, and negative delta values are displayed as red bars. The transition from negative to positive delta, or from positive to negative delta, indicates trend reversal. Transition bars that exceed a user specified value are displayed in br
GIVE A LOOK TO MY OTHER PRODUCTS !                                                          100 % PER MONTH PROFIT---- MY NEW SIGNAL HERE ------->   https://www.mql5.com/en/signals/2162238?source=Site+Signals+My# Morning and evening star are 2 famous and reliable candlestick patterns, very helpful to understand an imminent change of trend. This indicator finds for you this patterns on your chart and send you an alert just when a pattern is 100 % formed. To make this indicator more reliable,you
Uno de los poderosos métodos de análisis es el modelado de series financieras utilizando procesos de Levy. La principal ventaja de estos procesos es que pueden usarse para modelar una gran cantidad de fenómenos, desde los más simples hasta los más complejos. Basta con decir que la idea del movimiento de los precios fractales en el mercado es solo un caso especial de los procesos de Levy. Por otro lado, con la selección adecuada de los parámetros, cualquier proceso de Levy puede representarse co
FT Power
Vitaliy Davydov
The FT Power indicator system is designed to determine the trend direction of the price chart. Consists of two histograms. The central histogram Bull/Bear Power determines the predominance of bullish or bearish power. When the indicator value is above zero, Bull/Bear Power shows that the bulls are strong, and when the histogram goes below 0, the bulls are exhausted and further growth becomes doubtful. The main histogram is used to determine the trend or flat sections of the chart and confirm the
Trend Piramide
Ignacio Agustin Mene Franco
Trend Piramide ! es un indicador que cumple con la estrategia de caza de tendencias !  donde clara mente da la señal de entrada cuando muestra el punto de color celeste cazando la tendencia con la linea azul , para la compra (BUY) donde para la venta (SELL) muestra el punto rojo con la linea de tendencia Yellow  se puede usar para cualquier temporalidad ,  siempre y cuando quieras cazar una tendencia corta o una tendencia larga .  Disponible para todos los pares de Forex y Indices Sinteticos ! W
A useful and convenient tool for traders when analyzing and making decisions. Peculiarity The main feature of this indicator is its fast algorithm . The gain in the speed of calculating the polynomial and its value of the standard deviation in comparison with classical algorithms reaches several thousand times. Also, this indicator includes a Strategy Tester with a clear visualization of transactions, an equity chart and simultaneous calculation and display of the following data in the form of
A lot of professional traders use high quality divergence signals as a part of their strategy to enter a position. Spotting correct divergences quickly can often be hard, especially if your eye isn’t trained for it yet. For this reason we’ve created a series of easy to use professional oscillator divergence indicators that are very customisable so you get only the signals you want to trade. We have this divergence indicator for RSI, MACD, Stochastics, CCI and OBV. RSI:   https://www.mql5.com/en/
Trade Sniper
Thomas Bradley Butler
Presentamos Trade Sniper: su ventaja en los mercados. Versión MT4: https://www.mql5.com/en/market/product/122371 ¿Está cansado de perder operaciones rentables o de que el mercado lo atrape? Conozca Trade Sniper, el indicador de vanguardia que aprovecha el poder de las tendencias para brindarle una ventaja muy clara en sus operaciones. Trend Sniper no es solo otro indicador común y corriente. Es una herramienta sofisticada que combina algoritmos avanzados con principios de operaciones probado
ATR Profesional
Ignacio Agustin Mene Franco
ATR Profesional .  es un indicador similar a las bollinger ,  pero este atr esta mas avanzado para hacer scalp y largos en h4 o h1 ,  cuenta con sus bandas , la estrategia es que te marca entrada cuando la vela sale de la banda ,  o hace algun rebote en el techo superior o piso inferior ,  sirve para todas las temporalidades !  sirve para los mercados de forex y indices sinteticos  tambien crypto ! Buen profit ! World Inversor .
BS Vwap 5 Bands
Bruno Gomes Falcao Seixas
The BS Vwap 5 Bands indicator is an advanced tool that integrates price and volume data, providing a comprehensive view of market dynamics. Designed with a focus on performance and tested under real trading conditions, this indicator aims to deliver valuable insights to traders. Its innovative approach combines VWAP with five distinct bands, revealing whether the price is aligned with the "fair price" and indicating overbought or oversold conditions. Additionally, the indicator offers visual cus
Coiote Volume Candle
Alexandre Moraes De Souza Lima
Candle de Volume Coiote O Candle de Volume  Coiote é um indicador que mede a variação do volume no tempo, seu corpo é pela variação do volume anterior pelo volume atual, sua direção pelo fechamento do preço. 1. identificado um topo no indicador Candle de Volume  Coiote (marcado o fechamento do preço). 2. identificado um fundo no indicador Candle de Volume Coiote (marcado o fechamento do preço). 3. fundo 3 igual fundo 2 no indicador Candle de Volume Coiote, preço no 3 é diferente de fundo 2. P
FREE
Best SAR MT5
Ashkan Hazegh Nikrou
4.33 (3)
Descripción :  nos complace presentar nuestro nuevo indicador gratuito basado en uno de los indicadores profesionales y populares en el mercado de divisas (PSAR). Este indicador es una nueva modificación del indicador Parabolic SAR original. En el indicador pro SAR puede ver el cruce entre puntos y el gráfico de precios. el cruce no es una señal, pero habla sobre el final del potencial de movimiento, puede comenzar a comprar con un nuevo punto azul y colocar un límite de pérdidas un atr antes
FREE
Improved Fair Value Gap Void MT5 The Improved Fair Value Gap (iFVG + Void) indicator for MetaTrader 5 is an advanced iteration of the traditional Fair Value Gap "FVG" indicator. Fair Value Gaps emerge following sharp price movements, marking crucial zones where supply and demand are unbalanced. Price action often gravitates back to these levels. This indicator visually marks bullish Fair Value Gaps (FVG) with green boxes and bearish Fair Value Gaps with red boxes. Additionally, it shades the use
FREE
This indicator shows data from 9 currency pairs by your choice for all 9 Time Frames. If a digital value of the RSI is less or equal to DnLevel = 30 (or whatever number you decided to put) then a Green square will appear. This is potentially an oversold condition and maybe a good time to go Long. If a digital value of the RSI is greater or equal to UpLevel = 70 (or whatever number you decided to put) then a Red square will appear. This is potentially an overbought condition and maybe a good time
Owl Smart Levels MT5
Sergey Ermolov
4.1 (29)
Versión MT4  |  FAQ El Indicador Owl Smart Levels es un sistema comercial completo dentro de un indicador que incluye herramientas de análisis de mercado tan populares como los fractales avanzados de Bill Williams , Valable ZigZag que construye la estructura de onda correcta del mercado y los niveles de Fibonacci que marcan los niveles exactos de entrada. en el mercado y lugares para tomar ganancias. Descripción detallada de la estrategia Instrucciones para trabajar con el indicador Asesor de c
Indicator summary   Индикатор информационная панель отображает значения и торговые действия, а так же выводит сводную информацию о торговых действиях, основанных на 11 встроенных индикаторах. Встроенные индикаторы: RSI (Relative Strength Index )- пересечение зоны перекупленности сверху вниз - сигнал на продажу. Пересечение зоны перепроданности снизу вверх - сигнал на покупку. При колебаниях в зоне между перекупленостью и перепроданостью сигнал формируется в зависимости от нахождения значения от
Trend and Signals MT5  indicator scans  30 trading Instruments (Forex, Metals and Indices).     It uses special algorithm on the  current market   based on   Pure Price Action   and display the overall trend and signal on the dashboard. When signals are produced the indicator sends alert and notification. Strategy for Signals This indicator uses the daily timeframe to determine the direction of the trend. The hourly timeframe is used to identify possible entries. Main trend and is determined by
This indicator is designed for M1 time frame and shows: Sum of points when the price goes up (Green Histogram). Sum of points when the price goes down (Red Histogram).  In other words, by the number and ratio of bullish points to bearish ones, you can do a technical analysis of the state of the market. If the green histogram prevails over the red one, you can conclude that at the moment the buyers are stronger than the sellers, and vice versa, if the red histogram prevails over the green, the s
The indicator highlights the points that a professional trader sees in ordinary indicators. VisualVol visually displays different volatility indicators on a single scale and a common align. Highlights the excess of volume indicators in color. At the same time, Tick and Real Volume, Actual range, ATR, candle size and return (open-close difference) can be displayed. Thanks to VisualVol, you will see the market periods and the right time for different trading operations. This version is intended f
FREE
CoioteAverageSpreed
Alexandre Moraes De Souza Lima
O indicador CoioteAverageSpreed é uma releitura do indicador AverageSpreed. Ele mostra a relação de esforço x resultado entre o volume e a volatilidade do preço. Com o volume heatmap é possível identificar visualmente se o preço foi deslocado com uma quantidade maior de volume e se o deslocamento do preço apresentou maior resultado ou não. É possível identificar momentos de ignição e exaustão do movimento, além de injeções de fluxo para dar continuidade a um movimento.
Time to Trade Trading timing indicator is based on market volatility through 2 ATR indicators to determine the timing of a transaction. The indicator determines the times when the market has strong volatility in trend. When histogram is greater than 0 (blue) is a strong market, when histogram is less than 0 (yellow) is a weak market. Should only trade within histograms greater than 0. Based on the histogram chart, the first histogram value is greater than 0 and the second histogram appears, this
FREE
The chaos wave
Letlhogo Mokgatle
This is the best indicator we have created by far, this indicator replicates the well known heiken ashi indicator,  but with a more precise entry point, this indicator can work on all time-frames and is strong on all the time frames , this indicator does not repaint nor does it lag , this indicator strategy combined with price action will change your trading experience , elevate your experience to the next level.
Very special indicator of Joe Dinapoli which is a derivative from traditional MACD indicator. It shows the precise price, at which MACD will show line crossing and trend shifting. Also, this level is known one period ahead of time.You can constantly reassess your current position by looking at this studying a variety of timeframes. When you are in a trade, you have a feel for how much time you have for the trade to go your way by looking at the distance between the MACD Predictor line and the l
Binary Options Assistant (BOA) COLD Signals Indicator provides signals based on Amalia Trader Binary Options Strategy. Indicators: Keltner & Stochastic Stop missing trades, stop jumping from chart to chart looking for trade set-ups and get all the signals on 1 chart! U se any of the BOA Signals Indicator with the  Binary Options Assistant (BOA) Multi Currency Dashboard .  All BOA Signal Indicator settings are adjustable to give you more strategy combinations. The signals can be seen visually a
TK Rainbow
Nguyen Trung Khiem
5 (1)
Indicador TK - Rainbow Descripción: El indicador TK - Rainbow es una herramienta robusta para el análisis técnico, diseñada para proporcionar una visión clara de las tendencias del mercado a través de un enfoque de múltiples líneas. Con 30 líneas calculadas en diferentes períodos, ofrece un análisis extenso de los movimientos de precios. El indicador utiliza un esquema de dos colores para resaltar las tendencias alcistas y bajistas, lo que facilita la interpretación de las condiciones del mercad
FREE
This indicator works on every currency pairs and time frames (TF). One input parameter: nPeriod - number of bars for histogram calculation. I recommend to optimize nPeriod value for each TF. If Green histogram poles are crossing the zero line from below then Long position may be opened. If Red histogram poles are crossing the zero line from above then Long position may be opened.
Brief description The ContiStat indicator calculate statistic frequency of green (up) and red (down) movement in the chart and determine movement dynamics (silver curve). There are two key parameters to understand the ContiStat principle: Block height and Block count . The ContiStat engine convert instrument price chart move to Blocks of constant height (price) regardles of how much time it take. Example 1: Block height is set to 50. DE30 index price make move from 15230 to 15443 in an hour. 4 g
Many indicators are based on the classical indicator Moving Average . The indicator All_TF_MA shows crossing of 2 MA from each TimeFrames . You will be able to change main input parameters for each MA for every TF. Example for M1 TF: Period1_Fast = 5 Method1_Fast = MODE_EMA Price1_Fast = PRICE_CLOSE Period1_Slow = 21 Method1_Slow = MODE_SMA Price1_Slow = PRICE_TYPICAL
Los compradores de este producto también adquieren
Trend Screener Pro MT5
STE S.S.COMPANY
4.89 (72)
Desbloquee el poder del comercio de tendencias con el indicador Trend Screener: ¡su solución definitiva para el comercio de tendencias impulsada por lógica difusa y un sistema multidivisa!Mejore su comercio de tendencias con Trend Screener, el revolucionario indicador de tendencias impulsado por lógica difusa. Es un poderoso indicador de seguimiento de tendencias que combina más de 13 herramientas y funciones premium y 3 estrategias comerciales, lo que lo convierte en una opción versátil para co
FX Volume MT5
Daniel Stein
4.72 (18)
FX Volume: Experimente el Verdadero Sentimiento del Mercado desde la Perspectiva de un Bróker Resumen Rápido ¿Desea llevar su estrategia de trading a otro nivel? FX Volume ofrece información en tiempo real sobre cómo los traders minoristas y los brókers están posicionados, mucho antes de que aparezcan informes retrasados como el COT. Ya sea que busque beneficios consistentes o simplemente quiera una ventaja más profunda en los mercados, FX Volume le ayuda a identificar desequilibrios important
Golden Trend Indicator MT5
Noha Mohamed Fathy Younes Badr
4.86 (14)
Golden Trend indicator  is The best indicator for predicting trend movement this indicator never lags and never repaints and never back paints    and give  arrow buy and sell    before the candle appear  and it will help you and  will make your trading decisions clearer its work on all currencies and  gold and crypto and all time frame This unique  indicator uses very secret algorithms to catch the  trends, so you can trade using this indicator and see the trend clear on charts  manual guide and
FX Power MT5 NG
Daniel Stein
5 (10)
FX Power: Analiza la Fuerza de las Divisas para Decisiones de Trading Más Inteligentes Descripción General FX Power es tu herramienta esencial para comprender la fuerza real de las principales divisas y el oro en cualquier condición de mercado. Al identificar divisas fuertes para comprar y débiles para vender, FX Power simplifica las decisiones de trading y descubre oportunidades de alta probabilidad. Ya sea que quieras seguir las tendencias o anticipar reversiones utilizando valores extremos
IX Power MT5
Daniel Stein
4.83 (6)
IX Power: Descubre perspectivas de mercado para índices, materias primas, criptomonedas y forex Descripción general IX Power es una herramienta versátil diseñada para analizar la fortaleza de índices, materias primas, criptomonedas y símbolos de forex. Mientras que FX Power ofrece la máxima precisión para pares de divisas mediante el uso de datos de todos los pares disponibles, IX Power se centra exclusivamente en los datos del mercado del símbolo subyacente. Esto convierte a IX Power en una e
FX Levels MT5
Daniel Stein
5 (2)
FX Levels: Zonas de Soporte y Resistencia con Precisión Excepcional para Todos los Mercados Resumen Rápido ¿Busca una manera confiable de identificar niveles de soporte y resistencia en cualquier mercado — ya sean divisas, índices, acciones o materias primas? FX Levels combina el método tradicional “Lighthouse” con un enfoque dinámico vanguardista, ofreciendo una precisión casi universal. Gracias a nuestra experiencia real con brokers y a las actualizaciones automáticas diarias más las de tiem
TPSpro RFI Levels MT5
Roman Podpora
4.53 (19)
INSTRUCCIONES       RUSO   -   ING        Se   recomienda utilizar con un indicador.       -       TPSpro   TENDENCIA PRO -   Versión MT5 Un elemento clave en el trading son las zonas o niveles desde los que se toman las decisiones de compra o venta de un instrumento de trading. A pesar de los intentos de los principales actores de ocultar su presencia en el mercado, inevitablemente dejan rastros. Nuestra tarea era aprender a identificar estos rastros e interpretarlos correctamente. Funciones p
TPSproTREND PrO MT5
Roman Podpora
4.47 (17)
TPSpro TREND PRO  - is a trend indicator that automatically analyzes the market and provides information about the trend and each of its changes, as well as giving signals for entering trades without redrawing! The indicator uses each candle, analyzing them separately. referring to different impulses - up or down impulse. Exact entry points into transactions for currencies, crypto, metals, stocks, indices!  ИНСТРУКЦИЯ RUS         INSTRUCTIONS  ENG       R ecommended to use with an indicator   -
Quantum TrendPulse
Bogdan Ion Puscasu
5 (12)
Presentamos   Quantum TrendPulse   , la herramienta de trading definitiva que combina el poder de   SuperTrend   ,   RSI   y   Stochastic   en un indicador integral para maximizar su potencial de trading. Diseñado para traders que buscan precisión y eficiencia, este indicador le ayuda a identificar tendencias del mercado, cambios de impulso y puntos de entrada y salida óptimos con confianza. Características principales: Integración con SuperTrend:   siga fácilmente la tendencia predominante del
Support And Resistance Screener está en un indicador de nivel para MetaTrader que proporciona múltiples herramientas dentro de un indicador. Las herramientas disponibles son: 1. Cribador de estructura de mercado. 2. Zona de retroceso alcista. 3. Zona de retroceso bajista. 4. Puntos pivotes diarios 5. Puntos de pivote semanales 6. Puntos Pivotes mensuales 7. Fuerte soporte y resistencia basado en patrón armónico y volumen. 8. Zonas de nivel de banco. OFERTA POR TIEMPO LIMITADO: El indicador de so
RelicusRoad Pro MT5
Relicus LLC
4.78 (18)
Ahora $ 147 (aumentando a $ 499 después de algunas actualizaciones) - Cuentas ilimitadas (PC o Mac) Manual de usuario de RelicusRoad + Videos de capacitación + Acceso al grupo privado de Discord + Estado VIP UNA NUEVA MANERA DE VER EL MERCADO RelicusRoad es el indicador comercial más poderoso del mundo para divisas, futuros, criptomonedas, acciones e índices, y brinda a los comerciantes toda la información y las herramientas que necesitan para mantenerse rentables. Brindamos análisis técnico
Gold Stuff mt5
Vasiliy Strukov
4.92 (173)
Gold Stuff mt5: un indicador de tendencia diseñado específicamente para el oro, también se puede usar en cualquier instrumento financiero. El indicador no se vuelve a dibujar ni se retrasa. El marco de tiempo recomendado es H1. IMPORTANTE! Póngase en contacto conmigo inmediatamente después de la compra para obtener instrucciones y bonificación!   Puede obtener una copia gratuita de nuestro indicador Strong Support y Trend Scanner, por favor envíe un mensaje privado. ¡a mí! PARÁMETROS Draw Ar
Bill Williams Advanced
Siarhei Vashchylka
5 (10)
Bill Williams Advanced is designed for automatic chart analysis using Bill Williams' "Profitunity" system. The indicator analyzes four timeframes at once. Manual (Be sure to read before purchasing) Advantages 1. Automatically analyzes the chart using the "Profitunity" system of Bill Williams. The found signals are placed in a table in the corner of the screen. 2. Equipped with a trend filter based on the Alligator indicator. Most of the system signals are recommended to be used only according t
Este tablero muestra los últimos   patrones armónicos   disponibles para los símbolos seleccionados, por lo que ahorrará tiempo y será más eficiente /   versión MT4 . Indicador gratuito:   Basic Harmonic Pattern Columnas del indicador Symbol:   aparecerán los símbolos seleccionados Trend :   alcista o bajista Pattern :   tipo de patrón (gartley, mariposa, murciélago, cangrejo, tiburón, cifrado o ABCD) Entry :   precio de entrada SL:   precio de stop loss TP1:   1er precio de toma de beneficios
Matrix Arrow Indicator MT5
Juvenille Emperor Limited
5 (13)
Matrix Arrow Indicator MT5   es una tendencia única 10 en 1 que sigue un indicador   100% sin repintado   de marcos temporales múltiples que se puede usar en todos los símbolos/instrumentos:   divisas ,   materias primas ,   criptomonedas ,   índices ,   acciones .  Matrix Arrow Indicator MT5  determinará la tendencia actual en sus primeras etapas, recopilando información y datos de hasta 10 indicadores estándar, que son: Índice de movimiento direccional promedio (ADX) Índice de canales de prod
Ante todo, vale la pena enfatizar que esta Herramienta de Trading es un Indicador No Repintado, No Redibujado y No Retrasado, lo que la hace ideal para el trading profesional. Curso en línea, manual del usuario y demostración. El Indicador de Conceptos de Acción del Precio Inteligente es una herramienta muy potente tanto para traders nuevos como experimentados. Combina más de 20 indicadores útiles en uno solo, combinando ideas avanzadas de trading como el Análisis del Trader del Círculo Interi
FX Dynamic: Rastrea la volatilidad y las tendencias con un análisis ATR personalizable Descripción general FX Dynamic es una herramienta potente que emplea los cálculos de Average True Range (ATR) para brindar a los traders información incomparable sobre la volatilidad diaria e intradía. Al establecer umbrales de volatilidad claros —por ejemplo, 80%, 100% y 130%— puedes identificar rápidamente oportunidades de beneficio o recibir alertas cuando el mercado excede sus rangos habituales. FX Dynam
Introduciendo       Quantum Breakout PRO   , el innovador indicador MQL5 que está transformando la forma en que comercia con Breakout Zones. Desarrollado por un equipo de comerciantes experimentados con experiencia comercial de más de 13 años,       Desglose cuántico PRO       está diseñado para impulsar su viaje comercial a nuevas alturas con su innovadora y dinámica estrategia de zona de ruptura. El indicador de ruptura cuántica le dará flechas de señal en las zonas de ruptura con 5 zonas ob
Este es un genial indicador para MT5 que ofrece señales precisas para entrar en una transacción sin redibujar. Se puede aplicar a cualquier activo financiero: fórex, criptomonedas, metales, acciones, índices. Nos dará valoraciones bastante precisas y nos dirá cuándo es mejor abrir y cerra una transacción. Eche un vistazo  al vídeo  (6:22), ¡contiene un ejemplo de procesamiento de una sola señal que ha amortizado el indicador! La mayoría de los tráders mejoran sus resultados comerciales durante l
Primero que todo, vale la pena enfatizar que este Sistema de Trading es un Indicador No Repintado, No Redibujado y No Retrasado, lo que lo hace ideal tanto para el trading manual como para el automatizado. Curso en línea, manual y descarga de ajustes preestablecidos. El "Sistema de Trading Inteligente MT5" es una solución completa de trading diseñada para traders nuevos y experimentados. Combina más de 10 indicadores premium y presenta más de 7 estrategias de trading robustas, lo que lo convier
Easy Breakout MT5
Mohamed Hassan
5 (3)
After your purchase, feel free to contact me for more details on how to receive a bonus indicator called VFI, which pairs perfectly with Easy Breakout for enhanced confluence!     Easy Breakout MT5   is a powerful price action trading system built on one of the most popular and widely trusted strategies among traders: the   Breakout strategy ! This indicator delivers crystal-clear Buy and Sell signals based on breakouts from key support and resistance zones. Unlike typical breakout indicators
Gartley Hunter Multi
Siarhei Vashchylka
5 (10)
Gartley Hunter Multi - An indicator for searching for harmonic patterns simultaneously on dozens of trading instruments and on all possible timeframes. Manual (Be sure to read before purchasing) | Version for MT4 Advantages 1. Patterns: Gartley, Butterfly, Shark, Crab. Bat, Alternate Bat, Deep Crab, Cypher 2. Simultaneous search for patterns on dozens of trading instruments and on all possible timeframes 3. Search for patterns of all possible sizes. From the smallest to the largest 4. All fou
Trend Line Map Pro MT5
STE S.S.COMPANY
4.09 (11)
El indicador Trend Line Map es un complemento para Trend Screener Indicator. Funciona como un escáner para todas las señales generadas por el evaluador de tendencias (Trend Line Signals). Es un escáner de líneas de tendencia basado en el indicador de evaluación de tendencias. Si no tiene el indicador Trend Screener Pro, Trend Line Map Pro no funcionará. It's a Trend Line Scanner based on Trend Screener Indicator. If you don't have Trend Screener Pro Indicator,     the Trend Line Map Pro will n
Este es posiblemente el indicador de reconocimiento automático de formación de precios más completo que puede encontrar para la plataforma MetaTrader. Detecta 19 patrones diferentes, toma las proyecciones de Fibonacci tan en serio como usted, muestra la zona de reversión potencial (PRZ) y encuentra niveles adecuados de stop-loss y take-profit. [ Guía de instalación | Guía de actualización | Solución de problemas | FAQ | Todos los productos ] Detecta 19 formaciones de precios armónicos diferen
Este panel descubre y muestra las zonas de   Oferta   y   Demanda   en el gráfico, tanto en modo scalping como a largo plazo, dependiendo de su estrategia de trading para los símbolos seleccionados. Además, el modo de escáner del tablero le ayuda a comprobar todos los símbolos deseados de un vistazo y no perder ninguna posición adecuada /   Versión MT4 Indicador gratuito:   Basic Supply Demand Características Le permite ver las oportunidades de negociación en   múltiples pares de divisas ,
QM Pattern Scanner MT5
Reza Aghajanpour
5 (3)
Contact me  to send you instruction and add you in group. QM (Quasimodo) Pattern is based on Read The Market(RTM) concepts. The purpose of this model is to face the big players of the market (financial institutions and banks), As you know in financial markets, big traders try to fool small traders, but RTM prevent traders from getting trapped. This style is formed in terms of price candles and presented according to market supply and demand areas and no price oscillator is used in it. RTM conc
Volumatic VIDyA MT5
Duc Hoan Nguyen
5 (1)
Special offer : ALL TOOLS , just $35 each! New tools   will be   $30   for the   first week   or the   first 3 purchases !  Trading Tools Channel on MQL5 : Join my MQL5 channel to update the latest news from me Volumatic VIDYA (Variable Index Dynamic Average) es un indicador avanzado diseñado para rastrear tendencias y analizar la presión de compra-venta en cada fase de una tendencia. Utilizando el Promedio Dinámico de Índice Variable (Variable Index Dynamic Average) como técnica principal de s
Auto Order Block with break of structure based on ICT and Smart Money Concepts (SMC) Futures Break of Structure ( BoS )             Order block ( OB )            Higher time frame Order block / Point of Interest ( POI )    shown on current chart           Fair value Gap ( FVG ) / Imbalance   -  MTF      ( Multi Time Frame )    HH/LL/HL/LH  -  MTF      ( Multi Time Frame )  Choch  MTF      ( Multi Time Frame )  Volume Imbalance     ,  MTF          vIMB Gap’s Power of 3 Equal High / Low’s  
Dark Absolute Trend   is an Indicator for intraday trading. This Indicator is based on   Trend Following  strategy but use also candlestick patterns and Volatility. We can enter in good price with this Indicator, in order to follow the main trend on the current instrument. It is advised to use low spread ECN brokers. This Indicator does   Not repaint   and   N ot lag . Recommended timeframes are M5, M15 and H1. Recommended working pairs: All. I nstallation and  Update Guide   -  Troubleshooting
CONTACT US  after purchase to get the Indicator Manual. Try Now—Limited 50% Discount for First 10 Buyers! Download the  Metatrader 4 Version Due to regulatory restrictions, our service is unavailable in certain countries such as India, Pakistan, and Bangladesh. William Delbert Gann (W.D. Gann) was an exceptional market analyst, whose trading technique was based on a complex blend of mathematics, geometry, astrology, and ancient mathematics which proved to be extremely accurate. A Note from t
Otros productos de este autor
EMA Crossover and Trend Alert Indicator for Pocket Options Updated version, Fixed multi Buy or Sell Icons on every candle, and refined the Math Logic so multi alerts are not triggered. Updated Print Statement which prints to alerts.txt file in the common files folder for Future Web Request App sends signals to Pocket options App without the use of AutoSignal_connection bot. Updated Version works with Heiken Ashi or Regular Candles. Overview: The EMA Crossover and Trend Alert Indicator is a ver
SuperTrend Indicator with Alerts Description The Super_Trend Indicator is a powerful tool for identifying market trends and potential reversal points using a combination of the following technical indicators: Commodity Channel Index (CCI) : The indicator detects shifts in momentum, confirming trends above or below user-defined trigger levels. Exponential Moving Average (EMA) : Acts as a trend filter to validate BUY and SELL signals for better accuracy. Super Trend Lines : A bright lime green lin
Indicator Overview Update 2-23-2025 This Newest version has been giving me a 70% win ratio on Pocket options, Give it a try download the Demo Update 1-13-2025 This newest Version will work with the up coming Web Request App that will replace the AutoSignal_connection bot. please check out the telegram group : "TRADEBOT EARLY ACCESS" for access to this new improved Bot Purpose This   MT5 indicator   analyzes 3-minute Heiken Ashi candles and generates   Buy/Sell signals   based on the crossing of
Combined RSI and Stochastic Indicator for MT5 The Combined RSI and Stochastic Indicator integrates the Relative Strength Index (RSI) with the Stochastic Oscillator to provide traders with enhanced trend and momentum analysis. This powerful tool is designed for MetaTrader 5 (MT5) and offers a robust system for identifying buy and sell opportunities based on trend confirmation and stochastic crossovers. Key Features: 1. Dual Indicator Integration RSI (Relative Strength Index): Configurable RSI per
MACD Alerts
Matthew Palulis
MACD Crossover with Alerts, Colored Histogram, and Zero Line Arrows Overview: The MACD Crossover Indicator is a powerful tool for traders seeking to identify trend direction and momentum shifts. This enhanced version of the classic MACD includes features like visual markers on crossover points, customizable histogram colors, and real-time alerts, making it ideal for decision-making in fast-paced markets. Features: Dynamic Histogram Coloring: The histogram changes color based on its value: Green
Vortex Indicator with Alert System Tested with MT5 App for the Pocket Options Trading Overview: The Vortex Indicator with Alert System is an advanced MetaTrader 5 (MT5) tool designed to help traders identify trend direction and potential entry/exit points with ease. Leveraging the Vortex Indicator's ability to detect market momentum, this script adds visual signals and customizable alerts for crossovers, making it ideal for manual and semi-automated trading strategies. Tested specifically with
Indicator Title: Custom Heiken Ashi and Moving Averages-Based Signal Indicator for OTC Markets Works off the RedLine Strategy. Overview: This custom indicator is designed specifically for traders working with OTC stocks on platforms like Pocket Options. It utilizes a powerful combination of Heiken Ashi candles and three exponentially smoothed moving averages (EMAs) to detect trends and provide highly reliable Buy and Sell signals . The indicator seamlessly integrates with the EABiBOT , AutoSigna
Pocket Options Keltner Channel with MA v3.12  Indicator Name: Keltner Channel v3.12 – Advanced Trend & Signal Indicator ️ Version: 3.12 Release Date: 2024 Platform: MetaTrader 5 (MT5) Category: Trend Indicators Description Keltner Channel v3.12 is an advanced trend-following indicator designed to enhance trading decisions by combining Keltner Channels , Moving Averages (MA1 & MA2) , and Buy/Sell Signal Alerts . This indicator helps traders identify breakouts, trend reversals, and
Filtro:
No hay comentarios
Respuesta al comentario
Versión 6.5 2025.01.27
Version 6.5