VWAP FanMaster
- Indicadores
- Thalles Nascimento De Carvalho
- Versión: 1.5
- Actualizado: 30 enero 2025
📈 VWAP FanMaster: ¡Domina la Estrategia de Pullback con Precisión!
VWAP FanMaster es el indicador definitivo para traders que buscan entradas precisas y pullbacks efectivos. 🎯 Combina la potencia del VWAP (Precio Medio Ponderado por Volumen) con las líneas de Fibonacci Fan, proporcionando un mapa claro de zonas de interés en el mercado.
Características Principales
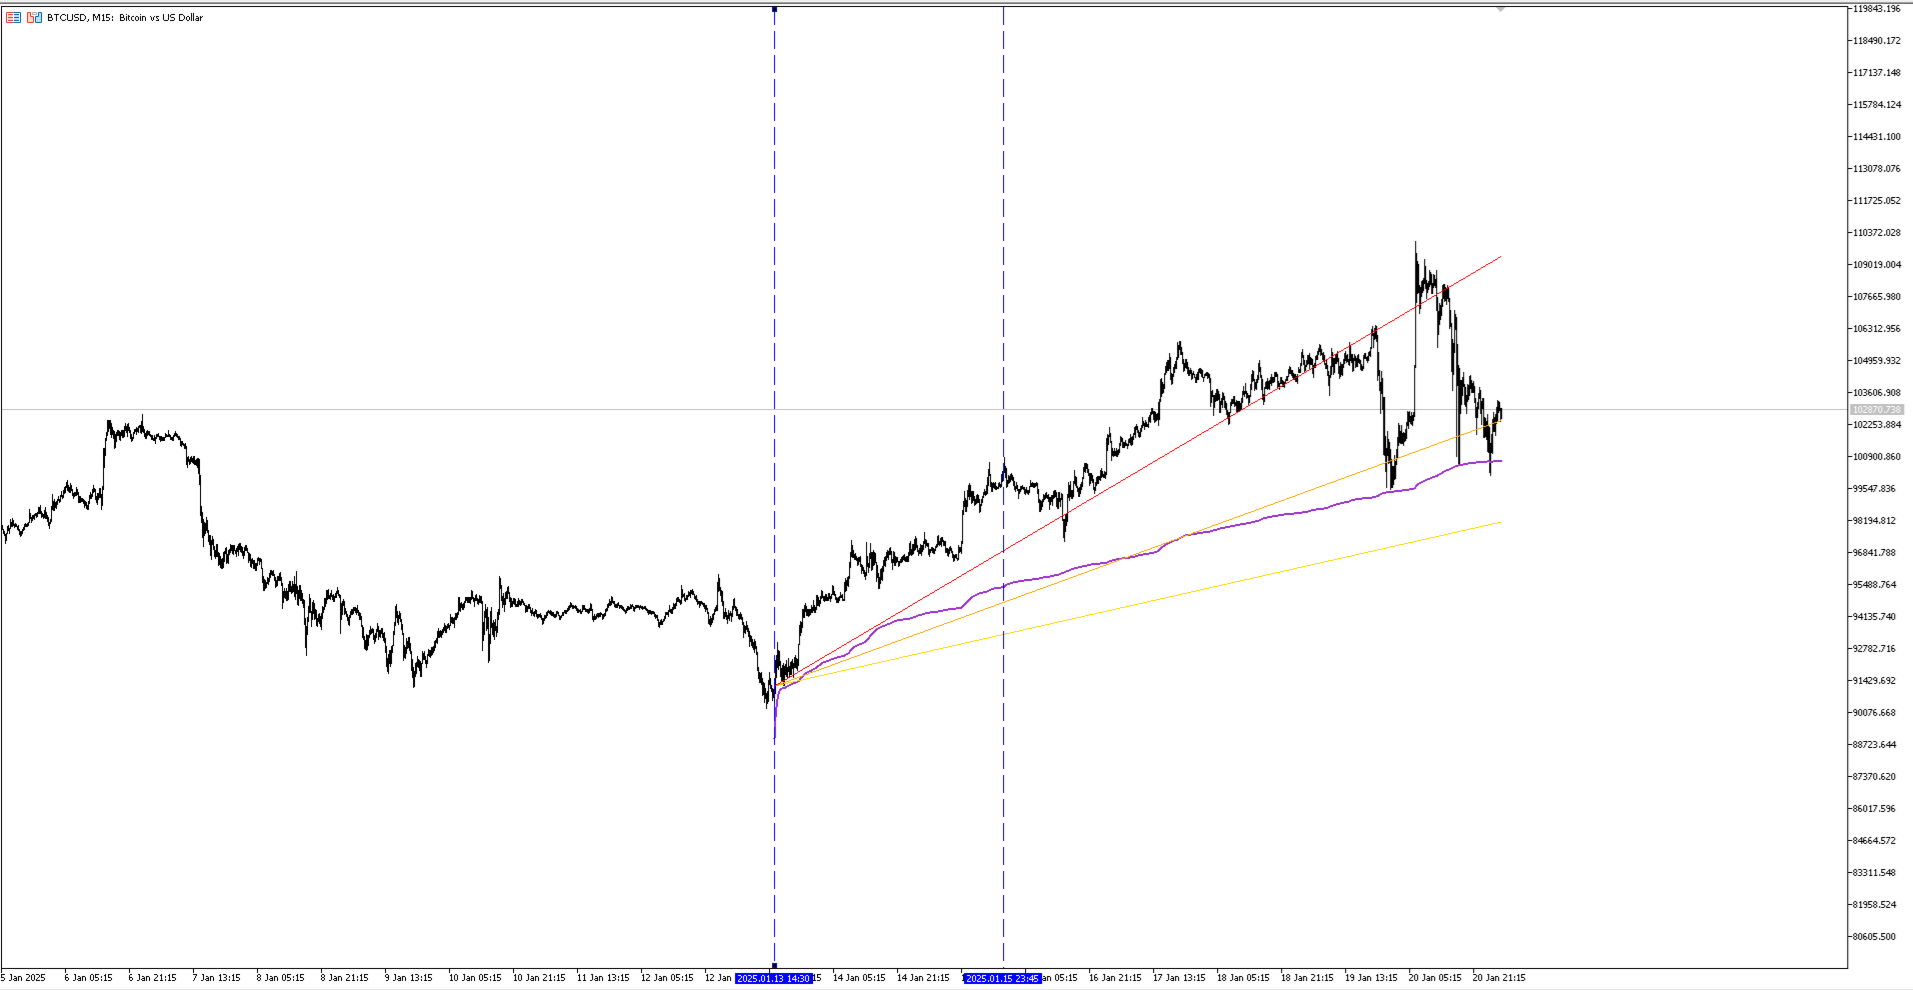
✨ Simple pero potente: Solo mueve las líneas verticales y el indicador trazará automáticamente el VWAP y las líneas de Fibonacci Fan.
🚀 Estrategia inteligente: Espera a que el precio regrese a las zonas trazadas para capturar pullbacks perfectos en los niveles de soporte y resistencia.
📊 Herramienta visual avanzada: Identifica rápidamente áreas de confluencia de precio para tomar decisiones de trading más seguras.
¿Por Qué Elegir VWAP FanMaster?
🔹 Fácil de usar, incluso para principiantes.
🔹 Mejora la precisión de tus operaciones al combinar dos herramientas de análisis poderosas.
🔹 Optimiza la gestión de riesgos con proyecciones claras y consistentes.
💡 ¡Optimiza tus estrategias y domina el mercado con VWAP FanMaster!