Visual Momentum Stability Indicator
- Indicadores
- AL MOOSAWI ABDULLAH JAFFER BAQER
- Versión: 1.21
- Actualizado: 10 marzo 2025
- Activaciones: 5
Visual Momentum Stability Indicator
Description:
The Visual Momentum Stability Indicator is a cutting-edge tool designed to assist traders in identifying market stability and momentum shifts with precision. Priced at $65, this indicator empowers you to make data-driven decisions by analyzing the interplay between momentum and stability across various timeframes. It is not optimized and is created specifically for you to fine-tune and adapt to your unique trading strategy.
This indicator combines momentum analysis with stability thresholds, providing a clear visual representation of when the market is poised for potential reversals or continuation trends. It is a versatile addition to your trading toolbox, suitable for scalping, swing trading, or long-term trend analysis.
Core Logic Behind the Indicator:
Momentum Detection: The indicator tracks momentum strength by analyzing price acceleration and deceleration. It uses a proprietary formula to calculate the momentum index, highlighting periods of increased market activity and potential breakouts.
Stability Zones: Stability zones are determined by evaluating price volatility and consistency within a defined range. These zones act as buffers, indicating when the market is less likely to experience sudden movements, making it ideal for strategic entry and exit points.
Dynamic Thresholds: The indicator adjusts dynamically to changing market conditions, ensuring that the signals remain relevant and accurate. Thresholds for momentum shifts and stability are recalibrated based on recent price behavior.
Entry and Exit Logic:
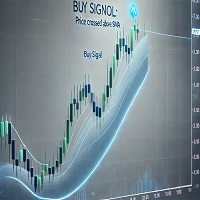
Entry: When the momentum line crosses above the stability threshold, it signals a potential bullish trend. Conversely, a downward cross indicates bearish momentum.
Exit: The indicator suggests exiting trades when momentum starts to wane or when price action enters a stability zone, signaling consolidation.
Visual Alerts: Clear visual cues are provided directly on your chart, allowing you to interpret market conditions at a glance. These include color-coded zones and trend lines for easy identification of trading opportunities.
Why Choose This Indicator?
Customizable: Tailor it to suit your trading style and optimize it for maximum performance.
Versatile: Works across all instruments and timeframes, from forex and commodities to indices and cryptocurrencies.
Insightful: Combines two critical market aspects—momentum and stability—to give you a comprehensive market view.
Additional Features:
User-friendly interface.
Lightweight and does not lag your trading platform.
Backtesting compatibility to validate its performance.
Need Support? If you have any questions or need assistance, feel free to contact me via direct message. I’m here to help you make the most out of this powerful tool.


