Price Action Band
- Indicadores
- Gi-Seok Im
- Versión: 2.1
- Actualizado: 25 marzo 2020
- Activaciones: 5
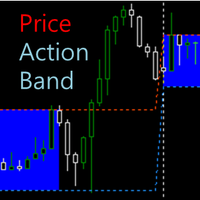
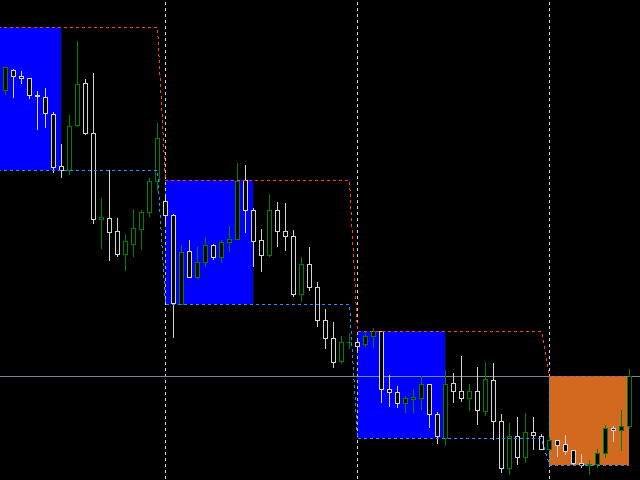
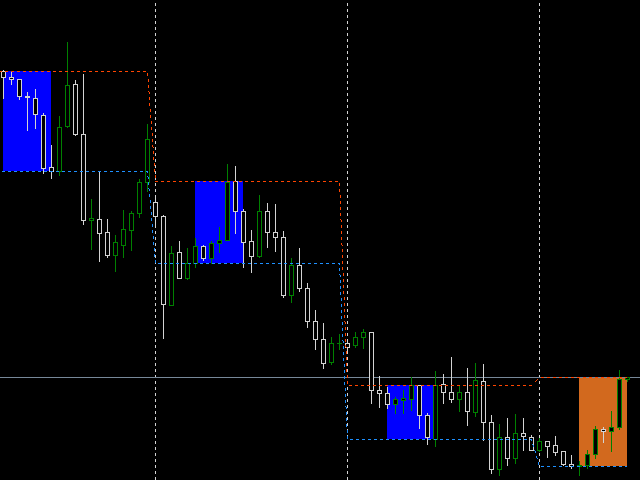
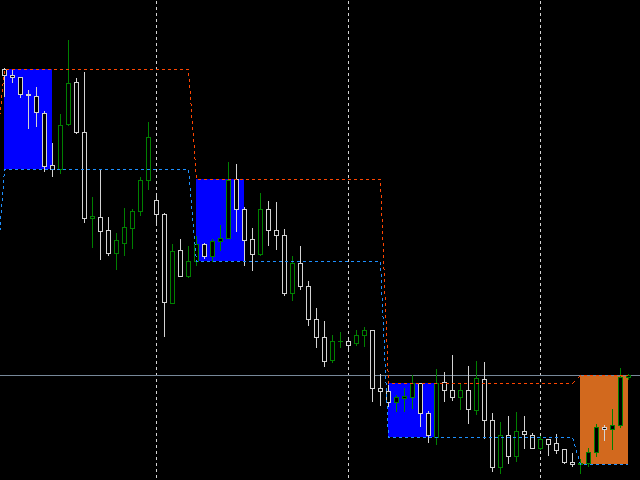
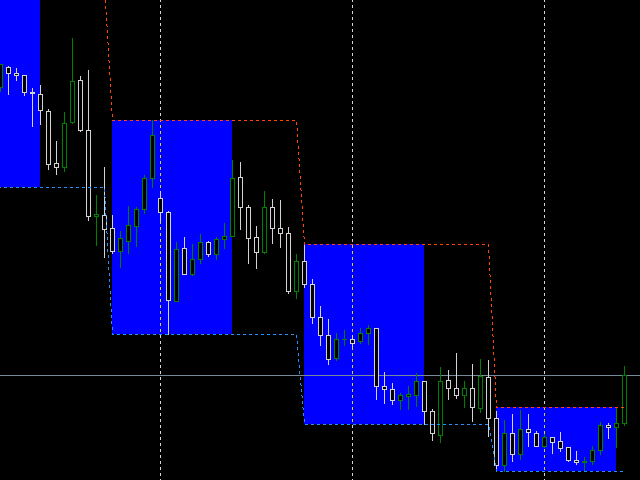
The indicator displays high and low Price Band computed from the period of time.
It also contains Price Box based on the both prices.
You can measure the box channel in a day by this Price Box and can observe the Price Action in the extended area of the Price Band.
Your trading decision will be concluded via watching the Price Action in the Band.
How To Use
There are two major external variables, BandSTime and BandETime.
This means the start time and the end time respectively to calculate the Price Band.
And the indicator measures the highest/lowest price within this period of time.
You can designate the time like this:
- "0000", "1200"
- "1045", "20" (= "1045", "2000")
- "5", "17" (= "0500", "1700")
- "0", "0" (= "0000"(yesterday), "0000"(today))
- "20", "10" (= "2000"(yesterday), "1000"(today))
To use the time format as "1045", the timeframe of a chart should be M1 or M5 or M15.
If the BandSTime and BandETime are "5" and "12" (or "0500", "1200"), this means that the Price Band is determined from 05:00:00 to 11:59:59.
The BandETime itself is not included in the examine period.
The last two time formats are very interesting!
If you set the BoxSTime as greater or equal to BoxETime, BoxSTime is converted to the time of yesterday.
The "yesterday" is calculated based on trading day and the loss of bar or weekend gap is moderately considered.
The Price Box has two colors, one for the past bars and the other for the current bars.
If the current time is greater or equal to BoxSTime and less than BoxETime, the values of the Price Band and Price Box are adjusted correctly.
This is an indicator for day trading using box range. Set the range of time according to your favorite. It can be set within the Asia or Europe or New York session time or any period of time from any hour to any one. The minutes part is dependent on the time frame of a chart.
For example, you can set the BandSTime and BandETime to Asia and Europe session time (approximately "0000" ~ "0700" or "0" ~ "7", server time) and watch the action(moving) of the price within that period of time, then can decide to enter position expecting the direction at the New York session time.
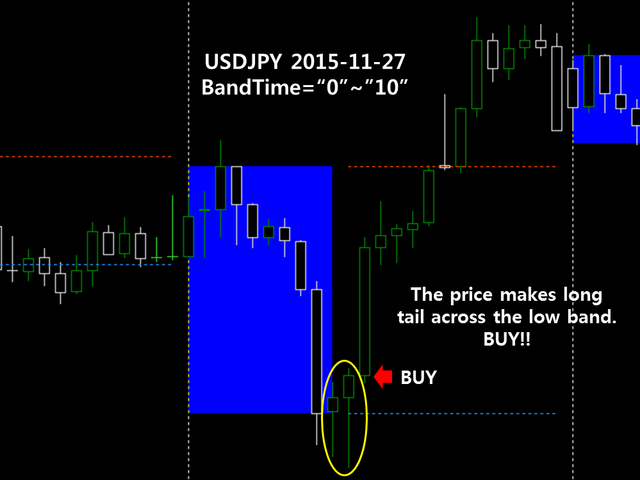
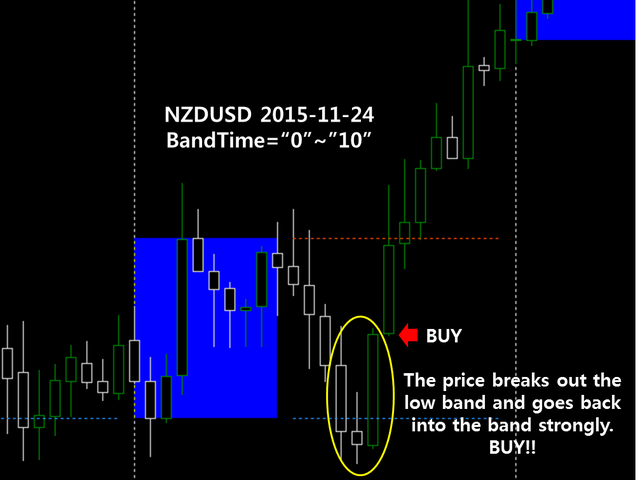
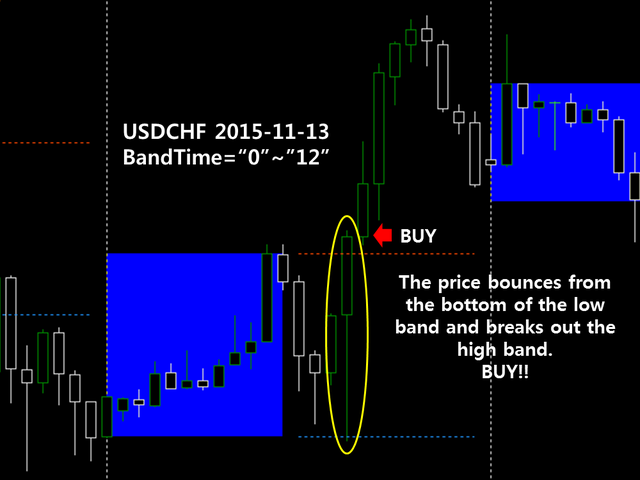
This indicator helps you to figure out the price moving within the box range or after the range showing whether the price will
- bounces at the band line
- breaks out the band line (include rolling back to the band line and bouncing again or breaking back the line)
- be locked in the box range
The Price Box (blue rectangle) is the box range reflecting the time period you set. See the price action in the Box and Band Line following the Box. You can get a hint.
Test it first using the strategy tester and you can find that this indicator is tested in all possible circumstances that can cause an error:
- with past bars or current bars
- absence of some bars in a week or between weeks
- every tick or open price only
- forward or reverse time designation
and this indicator:
- jumps over the unnecessary calculation
- adjusts already-calculated values when the current value records new high or low one
Inputs
Mandatory:
- BandSTime: Start time to calculate the Price Band ("0000")
- BandETime: End time to calculate the Price Band ("1200")
Optional:
- TakePrice: Price taken to calculate the Price Band (Open_Close, Hi_Low)
- ShowLine: Shows the Price Band (true)
- SeamlessLine: Shows all parts of the Price Band (true)
- DailyLine: Keep constant value of the Price Band in a day (true. No effect when SeamlessLine=false or BandSTime>=BandETime)
- LineStyle: Line style of the Price Band (STYLE_DOT)
- ShowBox: Shows the Price Box (true)
- FilledBox: Fill the Price Box (true)
- BoxStyle: Line style of the Price Box (STYLE_DOT)
- BoxColorBeforeETime: Color of the Price Box for the current bars (Chocolate)
- BoxColorAfterETime: Color of the Price Box for the past bars (Blue)
I launched a signal using my own time pattern with this indicator.
Go to "Signals - MetaTrader 4" and click "Filter" (at the right end of the page) and type "Time Pattern" and then press Enter. You will find it.
