• Información general
  • Comentarios
  • Discusión

Profile SR

Description of Support and Resistance Indicator Based on Volume Profile for MetaTrader 4

Introduction

The financial market is an arena where traders and investors constantly seek ways to gain a competitive edge. One of the most widely used and respected concepts in any market is support and resistance. These levels represent key price zones where supply and demand balance out, and where significant decisions are made by participants who drive the market.

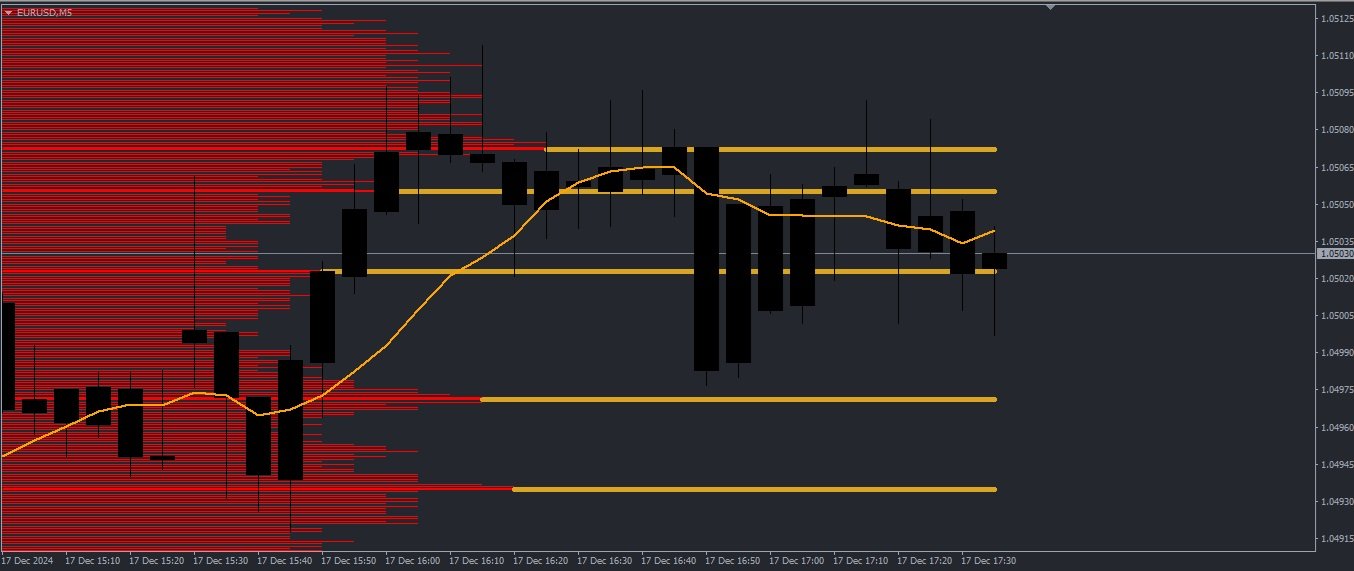
Our Support and Resistance Indicator with Volume Profile for MetaTrader 4 was specifically developed for traders who want to precisely identify the most contested regions by major players. It not only plots static horizontal levels but uses Volume Profile analysis to map areas where trading volume was the highest. This offers a powerful advantage to traders in Forex and Binary Options, providing a clear understanding of the “battle” between buyers and sellers.

Throughout this description, we will outline the key features of the indicator, the benefits of using it, and how it can be effectively applied to various trading strategies.

What is Volume Profile?

Before diving into the details of the indicator, it is essential to understand the concept of Volume Profile.

Volume Profile is a technical analysis tool that represents the distribution of trading volume at different price levels. Unlike traditional volume, which is displayed linearly at the bottom of the chart, Volume Profile is shown horizontally alongside the price. It shows exactly where volume was most intense, helping traders identify significant levels where buyers and sellers most heavily competed.

This information is extremely valuable because major market participants (often referred to as “players”) tend to concentrate their orders at certain levels. As a result, levels that exhibit the highest traded volume often become regions of strong support or resistance.

How Does the Indicator Work?

The Support and Resistance Indicator with Volume Profile for MetaTrader 4 works in real-time to identify and plot the most critical support and resistance regions based on volume.

  1. Analyzing the Most Contested Levels: The indicator scans recent price history and identifies areas where the highest volume was traded. These are the levels where buyers and sellers fought most intensely, creating critical zones that the market frequently respects.

  2. Automatic Plotting on the Chart: Once identified, the support and resistance levels are automatically plotted on the chart. This allows traders to quickly visualize the most relevant regions for their trades.

  3. Dynamic Updates: As price moves and new volume data emerges, the indicator automatically adjusts the levels, ensuring traders always have access to up-to-date information.

  4. Highlighting Strong Regions: The indicator differentiates the strongest levels (with the highest volume) from secondary levels, allowing traders to focus on the most likely zones for reversals or trend continuation.

Key Features of the Indicator

  • Extreme Precision: Levels are based on actual trading volume, ensuring high accuracy in identifying support and resistance.
  • Automatic Plotting: Traders do not need to manually draw support and resistance levels. The indicator does this automatically based on volume analysis.
  • Full Compatibility with MetaTrader 4: The indicator is easy to install and works seamlessly on any asset or timeframe in MetaTrader 4.
  • Level Differentiation: The indicator visually highlights the strongest levels, enabling a more focused and efficient trading approach.
  • Versatility: It can be used across various markets, including Forex, Indices, Commodities, and Binary Options.

Benefits of Using the Indicator

  1. Greater Precision in Support and Resistance: By using volume as the basis for identifying levels, the indicator removes the subjectivity of manual drawing.

  2. More Reliable Decision-Making: Knowing where major players concentrated their orders allows traders to make more informed decisions.

  3. Reversal and Continuation Strategies: The indicator is ideal for traders who operate both reversals at support and resistance and confirmations of breakouts.

  4. Risk Reduction: With more precise levels, traders can position stops and take profits more strategically, improving risk management.

  5. Increased Confidence: Both beginner and advanced traders can trade with more confidence, as the levels are based on objective data, not subjective opinions.

How to Use the Indicator in Different Strategies

  1. Reversal Trades:

    • Wait for the price to test a strong support or resistance level identified by the indicator.
    • Confirm the signal with a candlestick pattern or another complementary indicator, such as RSI or MACD.
    • Position your entry, stop, and take profit based on the identified structure.
  2. Breakout Trades:

    • Monitor the strongest levels generated by the Volume Profile.
    • If the price breaks out with above-average volume, enter in the direction of the breakout.
    • Use the broken level as support or resistance to position your stop loss.
  3. Binary Options:

    • Use the levels as points of reversal for short-term trades.
    • Combine the indicator with the appropriate expiration time.

Indicator Settings

The indicator has flexible settings to suit different trading profiles:

  • Volume Analysis Period: Define how many candles will be considered for the analysis.
  • Volume Filter: Adjust to show only levels with volume above a specific threshold.
  • Customizable Colors: Choose different colors for support, resistance, and intensity levels.

Conclusion

The Support and Resistance Indicator with Volume Profile for MetaTrader 4 is an essential tool for any trader seeking precision and objectivity in their operations. By accurately identifying the most contested levels by major players, the indicator provides a significant edge, allowing traders to operate with greater security and confidence.

Whether for Forex, Binary Options, or other markets, this indicator is the perfect choice for those who trade support and resistance. Its combination of volume and price results in highly accurate levels, helping traders identify the most relevant regions and maximize their results in the financial market.

Invest in smarter analysis and transform your strategies with the power of Volume Profile!


Productos recomendados
VR Cub
Vladimir Pastushak
VR Cub es un indicador para obtener puntos de entrada de alta calidad. El indicador fue desarrollado para facilitar los cálculos matemáticos y simplificar la búsqueda de puntos de entrada a una posición. La estrategia comercial para la cual se diseñó el indicador ha demostrado su eficacia durante muchos años. La simplicidad de la estrategia comercial es su gran ventaja, que permite que incluso los operadores novatos negocien con éxito con ella. VR Cub calcula los puntos de apertura de posiciones
Voenix
Lorentzos Roussos
4.58 (12)
Patrones armónicos , escáner y comerciante  Patrones incluidos: patrón ABCD patrón garley patrón de murciélago patrón de cifrado 3Patrón de unidades patrón de cisne negro Patrón de cisne blanco Patrón Quasimodo o patrón Over Under Patrón de murciélago alternativo patrón de mariposa Patrón de cangrejo profundo patrón de cangrejo patrón de tiburón Patrón FiveO patrón de cabeza y hombros patrón de triángulo ascendente Patrón uno dos tres Y 8 patrones personalizados Voenix es un escáner de patrones
I just sell my products in Elif Kaya Profile , any other websites are stolen old versions, So no any new updates or support. - Lifetime update free -   Real price is 1000$   - Limited Discount (It is now 299$) Welcome, Bitcoin Expert opens automatically trade with Highly profit, Fixed Stop loss. After purchase, You can receive  Gold Trade Expert  for  Free ! Contact me for this  BONUS ! No Martingale, No Grid, No Scam Strategy Tester is not covered critical news. Bitcoin is a cryptocurrency, a
El indicador "Auto FIBO Pro" de Crypto_Forex es una gran herramienta auxiliar para operar. - El indicador calcula y coloca automáticamente en el gráfico los niveles de Fibonacci y las líneas de tendencia locales (color rojo). - Los niveles de Fibonacci indican áreas clave donde el precio puede revertirse. - Los niveles más importantes son 23,6 %, 38,2 %, 50 % y 61,8 %. - Puede usarlo para scalping de reversión o para operar en cuadrículas de zonas. - También existen muchas oportunidades para m
Alpha Trend sign has been a very popular trading tool in our company for a long time. It can verify our trading system and clearly indicate trading signals, and the signals will not drift. Main functions: Based on the market display of active areas, indicators can be used to intuitively determine whether the current market trend belongs to a trend market or a volatile market. And enter the market according to the indicator arrows, with green arrows indicating buy and red arrows indicating se
Introduction to X3 Chart Pattern Scanner X3 Cherart Pattern Scanner is the non-repainting and non-lagging indicator detecting X3 chart patterns including Harmonic pattern, Elliott Wave pattern, X3 patterns, and Japanese Candlestick patterns. Historical patterns match with signal patterns. Hence, you can readily develop the solid trading strategy in your chart. More importantly, this superb pattern scanner can detect the optimal pattern of its kind. In addition, you can switch on and off individu
Trend Ray
Andriy Sydoruk
The indicator shows the potential trend direction by cyclical-wave dependence. Thus, all the rays of the intersection will be optimal rays, in the direction of which the price is expected to move, taking into account the indicator period. Rays can be used as a direction for potential market movement. But we must not forget that the approach must be comprehensive, the indicator signals require additional information to enter the market.
Next level of trend trading here. Possibility 75%, the indicator analyzes the current market to determine short (small dot), middle (circle with a dot inside) and long (cross with a circle and a dot inside) trends.  Wingdings characters of  Aqua color represents the beginning of the UP trend. Wingdings characters of  Orange color represents the beginning of the DOWN trend. Possibility 75% Indicator will improve your trading in the world of forex, commodities, cryptocurrencies and indices.
Trendiness Index
Libertas LLC
5 (3)
"The trend is your friend" is one of the best known sayings in investing, because capturing large trendy price movements can be extremely profitable. However, trading with the trend is often easier said than done, because many indicators are based on price reversals not trends. These aren't very effective at identifying trendy periods, or predicting whether trends will continue. We developed the Trendiness Index to help address this problem by indicating the strength and direction of price trend
Trend Line Chart Pattern Signals  Is a traders Tool for Signals based on Strong  Patterns Formed By a pair of robust trend lines. They FOR WITH DIFFERENT POPULAR PATTERNS ON CHARTS LIKE – TRIANGLES, FLAGS,RANGE , ASCENDING TRIANGLES, DESCENDING PATTERNS, PENNANTS ETC. The TREND LINES  form  dynamically  on running bars. The  sensitivity  of the trend lines can be changed by custom settings. The  Buy and Sell Signals Generate upon Break Of the Trend Line + "Close" of the same bar above the previo
Indicador único que implementa un enfoque profesional y cuantitativo para el comercio de reversión a la media. Aprovecha el hecho de que el precio se desvía y vuelve a la media de manera predecible y medible, lo que permite reglas claras de entrada y salida que superan ampliamente las estrategias comerciales no cuantitativas. [ Installation Guide | Update Guide | Troubleshooting | FAQ | All Products ] Señales comerciales claras Sorprendentemente fácil de operar Colores y tamaños personalizables
The Penta-O is a 6-point retracement harmonacci pattern which usually precedes big market movements. Penta-O patterns can expand and repaint quite a bit. To make things easier this indicator implements a twist: it waits for a donchian breakout in the right direction before signaling the trade. The end result is an otherwise repainting indicator with a very reliable trading signal. The donchian breakout period is entered as an input. [ Installation Guide | Update Guide | Troubleshooting | FAQ | A
El Capturador de Tendencias: La Estrategia del Capturador de Tendencias con Indicador de Alerta es una herramienta versátil de análisis técnico que ayuda a los traders a identificar las tendencias del mercado y los posibles puntos de entrada y salida. Presenta una Estrategia dinámica del Capturador de Tendencias, adaptándose a las condiciones del mercado para una clara representación visual de la dirección de la tendencia. Los traders pueden personalizar los parámetros para que se ajusten a su
FREE
Antabod Gamechanger
Rev Anthony Olusegun Aboderin
*Antabod GameChanger Indicator – Transform Your Trading!*   Are you tired of chasing trends too late or second-guessing your trades? The *Antabod GameChanger Indicator* is here to *revolutionize your trading strategy* and give you the edge you need in the markets!   Why Choose GameChanger? *Accurate Trend Detection* – GameChanger identifies trend reversals with *pinpoint accuracy*, ensuring you enter and exit trades at the optimal time.   *Clear Buy & Sell Signals* – No more guesswork! T
Trend Flasher Trend is your friend is the age old saying quote in trading arena, there are though many ways to gauge the trend and its direction, more scientific measure and logically meaningful will be an ATR break outs to identify and spot the trend and its acceleration, so we created this easy to use trend identification panel and optimized super trend based multi time frame panel entry system to aid and help the traders to make their trading decision. Unique Features of Trend Flasher 1. H
FreqoMaster
Stanislav Korotky
The main idea of this indicator is rates analysis and prediction by Fourier transform. The indicator decomposes exchange rates into main harmonics and calculates their product in future. The indicator shows 2 price marks in history, depicting price range in the past, and 2 price marks in future with price movement forecast. Buy or sell decision and take profit size are displayed in a text label in the indicator window. The indicator uses another indicator as an engine for calculations - FreqoMet
Trend PA
Mikhail Nazarenko
5 (3)
The Trend PA indicator uses   Price Action   and its own filtering algorithm to determine the trend. This approach helps to accurately determine entry points and the current trend on any timeframe. The indicator uses its own algorithm for analyzing price changes and Price Action. Which gives you the advantage of recognizing, without delay, a new nascent trend with fewer false positives. Trend filtering conditions can be selected in the settings individually for your trading style. The indicator
Harvest GOLD USES THE TREND WAVE INDICATOR AND IT CAN IDENTIFY THE BEGINNING AND THE END OF A NEW WAVE TREND MOVEMENT. AS AN OSCILLATOR, THE INDICATOR IDENTIFIES THE OVERBOUGHT AND OVERSOLD ZONES. IT WORKS GREAT TO CATCH THE SHORT TERM PRICE REVERSALS AND USES A MARTINGALE STRATEGY TO CLOSE ALL TRADES IN PROFIT. USE DEFAULT SETTINGS ON H1 OR HIGHER TIME FRAME ON ANY PAIR FOR MORE ACCURATE TRADES WHY THIS EA : Smart entries calculated by 3 great strategies The EA can be run on even a $30000
Un patrón de cabeza y hombros es una formación de gráfico que se asemeja a una línea de base con tres picos, los dos exteriores tienen una altura cercana y el medio es el más alto. Predice una inversión de tendencia alcista a bajista y se cree que es uno de los patrones de inversión de tendencia más confiables. Es uno de varios patrones principales que indican, con diversos grados de precisión, que una tendencia está llegando a su fin. [ Guía de instalación | Guía de actualización | Solución de
Trend Scanner
Vladimir Kalendzhyan
4.33 (6)
By purchasing this indicator, you have the right to receive a free copy of one of   my other indicator's or advisor’s!  (All future updates are included. No limits) . To get it , please contact me by  mql5 message ! The Trend Scanner trend line indicator displays the trend direction and its changes. The indicator works on all currency pairs and  timeframes. The indicator simultaneously displays multiple readings on the price chart: the support and resistance lines of the currency pair, the exist
Introducing the "Magic Trades" for MetaTrader 4 – your ultimate tool for precision trading in dynamic markets. This innovative indicator revolutionizes the way you perceive market trends by harnessing the power of advanced analysis to detect subtle changes in character, paving the way for optimal trading opportunities. The Magic Trades Indicator is designed to empower traders with insightful entry points and well-defined risk management levels. Through its sophisticated algorithm, this indicato
EARLY REMINDER: The Starting price is 65 price will rise soon up to 365$ and then 750$ after first 10 copies of sales. Grab this offer now! Introduction Hello, traders! Welcome to the demonstration of the Forex Beast Indicator , a comprehensive tool designed to assist aspiring traders in navigating the complexities of the forex market. This indicator incorporates seven essential components to provide a well-rounded trading experience: Moving Averages Colored Zones Support and Resistance Levels
Owl smart levels
Sergey Ermolov
4.24 (37)
Versión MT5  |   FAQ El   Indicador Owl Smart Levels   es un sistema comercial completo dentro de un indicador que incluye herramientas de análisis de mercado tan populares como   los fractales avanzados de Bill Williams , Valable ZigZag que construye   la estructura de onda correcta   del mercado y   los niveles de Fibonacci   que marcan los niveles exactos de entrada. en el mercado y lugares para tomar ganancias. Descripción detallada de la estrategia Instrucciones para trabajar con el indi
KT Horizontal Lines MT4
KEENBASE SOFTWARE SOLUTIONS
In MetaTrader, plotting multiple   horizontal lines   and then tracking their respective price levels can be a hassle. This indicator automatically plots multiple horizontal lines at equal intervals for setting price alerts, plotting support and resistance levels, and other manual purposes. This indicator is suitable for Forex traders who are new and looking for chances to make quick profits from buying and selling. Horizontal lines can help traders find possible areas to start trading when the
Key level wedge pro
Presley Annais Tatenda Meck
5 (1)
We have combined all of our beloved indicators the likes of: Key level order block , Key level supply and demand , Key level liquidity grab and Key level wedge into one single indicator and dashboard. Whats new Dashboard : There is an easy access dashboard for all your needs. Multi-timeframe button : There is now a multi-timeframe option for Order Blocks and Supply and demand zones, making it easy to see higher timeframe zones easily on the current timeframe by just clicking the desired timefra
I just sell my products in Elif Kaya Profile , any other websites are stolen old versions, So no any new updates or support. - Lifetime update free -   Real price is 80$   - 40% Discount ( It is 49$ now ) Contact me for instruction, any questions! Related Product:  Gold Expert  ,  Professor EA - Non-repaint Introduction Flag patterns are an important tool for technical traders in the stock market. When interpreting a flag pattern, it is important to wait for the pattern to pick a direction b
Diamond Trend
Segundo Calvo Munoz
Indicador que identifica la tendencia, así como puntos de entrada. Usar para entradas a favor de tendencia. Aunque este indicador es muy preciso identificando entradas, siempre se recomienda usar otro indicador de soporte para confirmar. Recuerda buscar los Activos y Timeframes que mejor se adapten a tu operativa... Válido tanto para Scalping como para entradas de Largo Plazo Por favor, utiliza un Gráfico de Barras para poder visualizar el indicador correctamente Inputs: EMA Value for Long Term
KT Renko Patterns MT4
KEENBASE SOFTWARE SOLUTIONS
2.33 (3)
KT Renko Patterns analiza el gráfico Renko ladrillo por ladrillo para encontrar patrones gráficos populares que son ampliamente utilizados por los traders en diferentes mercados financieros. En comparación con los gráficos basados en tiempo, los patrones son más fáciles de identificar en los gráficos Renko debido a su aspecto limpio y sin ruido. KT Renko Patterns incluye múltiples patrones Renko, muchos de los cuales están explicados en detalle en el libro “Profitable Trading with Renko Charts
The Th3Eng PipFinite indicator is based on a very excellent analysis of the right trend direction with perfect custom algorithms. It show the true direction and the best point to start trading. With StopLoss point and Three Take Profit points. Also it show the right pivot of the price and small points to order to replace the dynamic support and resistance channel, Which surrounds the price. And Finally it draws a very helpful Box on the left side on the chart includes (take profits and Stop loss
Los compradores de este producto también adquieren
Cycle Maestro
Stefano Frisetti
NOTE: CYCLEMAESTRO is distributed only on this website, there are no other distributors. Demo version is for reference only and is not supported. Full versione is perfectly functional and it is supported CYCLEMAESTRO , the first and only indicator of Cyclic Analysis, useful for giving signals of TRADING, BUY, SELL, STOP LOSS, ADDING. Created on the logic of Serghei Istrati and programmed by Stefano Frisetti ; CYCLEMAESTRO is not an indicator like the others, the challenge was to interpret only t
Enigmera
Ivan Stefanov
5 (7)
ENIGMERA: El núcleo del mercado Importante: La demostración de MQL5.com se ejecuta en el Strategy Tester y puede no reflejar completamente la funcionalidad de Enigmera. Consulta la descripción, las capturas de pantalla y el video para más detalles. ¡No dudes en contactarme si tienes alguna pregunta! El código del indicador ha sido completamente reescrito. La versión 3.0 añade nuevas funcionalidades y elimina errores acumulados desde el inicio del indicador. Introducción Este indicador y sistem
PZ Harmonacci Patterns
PZ TRADING SLU
3.17 (6)
Este es posiblemente el indicador de reconocimiento automático de formación de precios más completo que puede encontrar para la plataforma MetaTrader. Detecta 19 patrones diferentes, toma las proyecciones de Fibonacci tan en serio como usted, muestra la zona de reversión potencial (PRZ) y encuentra niveles adecuados de stop-loss y take-profit. [ Guía de instalación | Guía de actualización | Solución de problemas | FAQ | Todos los productos ] Detecta 19 formaciones de precios armónicos diferen
TrendMaestro
Stefano Frisetti
5 (3)
note: this indicator is for METATRADER4, if you want the version for METATRADER5 this is the link:  https://www.mql5.com/it/market/product/108106 TRENDMAESTRO ver 2.4 TRENDMAESTRO recognizes a new TREND in the bud, he never makes mistakes. The certainty of identifying a new TREND is priceless. DESCRIPTION TRENDMAESTRO identifies a new TREND in the bud, this indicator examines the volatility, volumes and momentum to identify the moment in which there is an explosion of one or more of these data a
This is a mini version(One pair) of Advanced Detector of Trend Reversal and Continuance known as TrueTrendStarM(TTSm25). It is a sensitive and Predictive indicator of Price Trends for Professional traders. ( WEEKEND DISCOUNT OFF ! )( ATTENTION BUYERS:- PLEASE CONTACT ME FOR HOW BEST TO USE THE INDICATOR FOR MAXIMUM PROFITS )    It detects high odds changes in Price Trend direction long before other indicator detects it. I have been working on it since 2019.    This is possible due to fractal
Bomb Bank Signal
Igor Pereira Calil
5 (1)
Señal de Bomb Bank: su indicador de confianza en MetaTrader 4 Bomb Bank Signal es un poderoso indicador para MetaTrader 4, diseñado para identificar las tendencias más relevantes en el mercado financiero. Si buscas una herramienta que anticipe los movimientos con precisión, el Bomb Bank es el aliado que necesitas. Cómo funciona: Este indicador combina tres métodos distintos (análisis de volumen, cierre de velas y tendencia simétrica) para detectar y señalar oportunidades de compra y venta. B
Gann Zone Pro
Kirill Borovskii
This indicator identifies and displays zones, as it were areas of strength, where the price will unfold. The indicator can work on any chart, any instrument, at any timeframe. The indicator has two modes. The indicator is equipped with a control panel with buttons for convenience and split into two modes. Manual mode: To work with manual mode, you need to press the NEW button, a segment will appear. This segment is stretched over the movement and the LVL button is pressed. The level is displayed
Hello Dear Trader, Today Im Telling You About The "Golden Scalp System V1 " Metatrader4 Golden Scalp System Scalper with EMA   This is a  Scalper strategy   based on ( Exponential moving average) EMA . Time frame: H1 Pair: EUR/USD, GBP/USD,AUD/USD XAU/USD Platform Mt4   Indicators for Scalper with Ema: 300  EMA (Exponential Moving Average) ; 500 EMA (Expontial Moving Average); Stochastic   (5,3,3)   Long Entry 1) 300  EMA   > 500  EMA . 2) Find significant levels of support. 3) Wait for the c
Full Forex Market View Dashboard
Opengates Success International
5 (2)
VISTA COMPLETA DEL MERCADO FOREX Indicador del tablero Este es un indicador personalizado creado para brindar a los comerciantes una visión completa de lo que está sucediendo en el mercado. Utiliza datos en tiempo real para acceder al mercado y mostrar toda la información necesaria para realizar transacciones exitosas. INSTALACIÓN: Antes de adjuntar este indicador a su gráfico de ventana, vaya al panel Market Watch de su MT4 y OCULTE todos los pares de divisas que no necesita ni opere y deje
Magic M2
Tuan Anh Dao
4.5 (8)
------ GOOD LUCK   -----   (Telegram: @MagicBinary) The indicator allows you to trade binary options. T his indicator give high winning ratio with over 20 years of backtesting  The recommended time frame is М1 and the expiration time is 3, 5 minutes. The indicator suitable for Auto and Manual trading. A possible signal is specified as a arrows above/under a candle. You can entry current candle /intrabar or can wait until candle close Arrows are not re-painted Trade sessions: Any/ Rec
Por supuesto, aquí tienes la traducción al español: Presentamos el Indicador de Astronomía para MT4: Tu Compañero Celestial Definitivo en el Trading ¿Estás listo para elevar tu experiencia de trading a alturas celestiales? No busques más allá de nuestro revolucionario Indicador de Astronomía para MT4. Esta innovadora herramienta trasciende los indicadores de trading tradicionales, aprovechando el poder de algoritmos complejos para proporcionarte una visión astronómica sin igual y cálculos de pre
Trade Invest Pro - Boss in the world of cryptocurrency! This indicator is ideal for cryptocurrency trading! Work on Trade Invest Pro took us half a year! But not in vain! Now only accurate signals near support - resistance levels! He showed himself well on timeframes m5 m15 for binary options! Optionally, it can be configured for forex for timeframes m30 and more! Reacts well to news! Doesn't paint! and does not disappear from the schedule! As soon as a red arrow appears, open a deal fo
ZO Trend
Trung Le Hoang
4 (4)
Important!! ZO Trend can't work on MN timeframe. /*--------------------------------------------------------------------------------------------------------------------------------------------------------------------------------------------- ZO Trend an indicator used to search for entry point. With the session candle algorithm on many timeframe, ZO Trend creates an area for traders find good Entry Point. ZO SYSTEM BASIC SETUP :  https://www.youtube.com/watch?v=qdNOXHWozNw ZO TREND User guide : 
La VELOCIDAD DE TRANSACCIÓN es el indicador de mayor calidad que muestra dónde y cuándo se acumulan grandes órdenes en el mercado y los beneficios de ello. Detecta los cambios de tendencia en una fase muy temprana. Es a la vez un indicador y un sistema de trading. El concepto es único e increíblemente rentable. En Forex, el volumen de ticks se denomina engañosamente volumen. En realidad, se trata de la variación del precio por unidad de tiempo, que de hecho es la VELOCIDAD DE TRANSACCIÓN. Este
Dark Sniper
Dmitriy Kashevich
Dark Sniper pointer indicator.  Complete absence of redrawing   The percentage of correct indicator forecasts depends on your settings; the default is period 7 (performed better) The arrow indicates the direction of the next candle and the possible direction of the trend in the future.  Suitable for small timeframes m1 and m5  It is recommended to open transactions from 1 to 2 candles.  The signal appears on the current candle. Open a trade on the next one since the signal is being generat
Market Interest
Paul Edunyu Carissimo
Indicador de interés del mercado: su ventaja en el análisis del sentimiento comercial Beneficios clave: Cuantifica la participación de los participantes del mercado en tiempo real Combina la acción del precio y la dinámica del volumen. Revela el sentimiento oculto del mercado más allá de los indicadores tradicionales Adaptable a múltiples marcos temporales y activos. Sistema de alerta temprana para posibles cambios de tendencias Ventajas para el comerciante: Identificar períodos de aumento/dismi
Risk Reward ratio indicator for MT4  BING Risk Reward indicator is a powerful, basic, very needed tool for every trader. Clearly visualize Open Price , Stop Loss , and Top Profit levels on your graphs with easy-to-see colors and trendlines. Does BING Risk Reward show alerts? Of course! BING Risk Reward Indicator offers all Alerts available for the MT4 platform(Email, Popups, Sound, and Push). It shows alerts on Open Price , Stop Loss , and Top Profit. That way, besides easily seeing what is go
Automatic, live & interactive picture of all trendlines. Assign push, email and sound alerts to the lines of your choice and be informed about price rollback, breakout, rollback after breakout, number of rollbacks, line expiration by double breakout. Correct, drag or delete the lines and interactively tune the line system. https://youtu.be/EJUo9pYiHFA . Chart examples https: //www.mql5.com/en/users/efficientforex Price Interaction Events All events are effective immediately and only after one
The indicator displays the probable ( Support and resistance ) levels. The indicator draws horizontal and trend levels of support and resistance. The indicator settings: Trends - the mode for displaying trend lines or horizontal lines of support and resistance Yes - display trend lines only No - display horizontal lines only UseResource - use the resources built into the indicator. Yes - use the ZigZag indicator from the resources of the product. No - use a custom ZigZag indicator. HistoryBar -
The indicator of a Professional Trader is an arrow indicator for predicting the direction of price movement. I have been working on this indicator since 2014. You can use this indicator as your main indicator, use its entry signals, and use it as your only indicator to find entry points. About the product: Recommended TF [H4-D1-W1]   . The indicator predicts the direction of the next candle. Fits a variety of tools; Flexibility in settings for different instruments and intervals through the MO
The [GRAFF] III manual trading system is based on multiple MetaTrader (MT4) indicators. Together, the entire PACK of GRAFF III indicators makes an advanced trading tool. The system consists of over 20 different custom-built indicators which have been carefully selected and tested in the long term to produce strong and efficient trading signals. The particular indicators are based on different mathematical formulas, so the entire system is calibrated to remove false signals from its own indicator
This indicator allows you to see the strength of the trend on all timeframes. It can be used for all currency pairs. The indicator can be displayed in the form of a column (from left to right): status buy / sell / strong buy / strong sell, strength of the trend in percentage, pips last candle, body candle now, remaining time, and the timeframe of M1 to MN. Information contained below (from left to right): total trend percent, sell percent, buy percent.
You can fins our other products from link : https://www.mql5.com/en/users/drbastem/seller   Also, you can ask all your questins from email : haskayafx@gmail.com or mobile : +90 530 867 5076 or @MehmetBastem    on telegram application This indicator is used to determine the trend. Standard Osma indicator is used. It has the indicator warning system: beep, e-mail and has three types of alerts, including messages to mobile phone. It shows the best performance on the chart of 5 minutes. When the
You can fins our other products from link : https://www.mql5.com/en/users/drbastem/seller   Also, you can ask all your questins from email : haskayafx@gmail.com or mobile : +90 530 867 5076 or @MehmetBastem    on telegram application This indicator is used to determine the trend. Standard Three Moving Average and ADX indicators are used. It has the indicator warning system (audio, e-mail) and three types of alerts, including messages to mobile phone. It shows the best performance on M5. When
This indicator is used to determine the trend. Standard Three Moving Average and ADX indicators are used. It has the indicator warning system (audio, e-mail) and three types of alerts, including messages to mobile phone. It shows the best performance on M5. When the trend value reaches the value set, the warning system is activated. This indicator works only with Forex symbols. Inputs SoundAlarm = true - Sound Alert Sendmail=true - Send an e-mail in case of a buy or sell signal Sendnotification
You can fins our other products from link : https://www.mql5.com/en/users/drbastem/seller   Also, you can ask all your questins from email : haskayafx@gmail.com or mobile : +90 530 867 5076 or @MehmetBastem    on telegram application This indicator is used to determine the trend. Standard MACD indicator is used. It has the indicator warning system: beep, e-mail and has three types of alerts, including messages to mobile phone. It shows the best performance on the chart of 5 minutes. When the
Smooth price for Monarch MT4
Konstantin Gruzdev
3.67 (3)
The Smooth Price technical indicator is used for plotting a smoothed line as close to the price of the financial instrument as possible, and serves to eliminate its noise components. The indicator is part of the Monarch trading system, but here it is presented as an independent technical analysis tool. The indicator is based on the cluster digital filter , which, unlike the ClusterSMA , is applied directly to the price time series. Smooth Price does not redraw (except the very last, zero bar) an
A simplistic indicator informing a user on RSI divergence by sending messages to mobile device and email. The indicator draws 2 vertical lines, marking two RSI extrema that formed the divergence. You get the alert, open the charts and make a decision. The indicator does not show past divergences, thus when you attach it to a chart for the first time you see nothing. Graphics and alerts will appear as soon as divergences do. Drop it in Tester to see how it works. Parameters: RSIPeriod - number of
ZLevels
Sergio Andres Zuleta Lopez
Este indicador está basado en la metodología del Market Profile, que contiene el Z-Zone , a diferencia de este último, permite la visualización de múltiples marcos de tiempo en un mismo gráfico.  Esta metodología ha mostrado ser muy efectiva para: Disminuir el número de ventanas para analizar o hacer seguimiento a un activo. Visualizar zonas importantes de resistencia (RoZ), soporte (SoZ) y distribución media (PoC) en diferentes periodos de tiempo.  Definir zonas para tomar utilidades y ubicar s
Otros productos de este autor
SR arrows liquid lines
Teresinha Moraes Correia
In the fifth update , the indicator now aims to predict the direction of the next candle, issuing a buy or sell arrow precisely when the conditions are met. Since its first version, which showed support and resistance levels on the chart, up to the current version 5, many improvements have been made. One of the key changes is the removal of visual support and resistance levels to prevent memory overload. This is no longer necessary, as arrows are now issued when the price is near or touches th
Value Chart Probability
Teresinha Moraes Correia
This updated version of the Value Chart indicator introduces new parameters in the way the indicator is calculated. Its main objective is to analyze the current range and attempt to predict the direction of the ongoing candle, displaying an arrow indicating where the candle is expected to move. The calculation structure is based on the last 1,000 candles. First, a weighted average is calculated for each candle. Then, the modified Value Chart calculation is applied to determine the range and str
Volume Cluster Indicator for MetaTrader 4: Advanced Analysis of Support, Resistance, and Market Dynamics The Volume Cluster Indicator for MetaTrader 4 is a powerful tool designed for traders seeking an in-depth understanding of market dynamics. It provides detailed insights into volume behavior within each candlestick, highlighting levels where volume is "overpriced" and areas of weakness. This enables precise identification of support and resistance zones, making it indispensable for traders le
Trend Colored Average
Teresinha Moraes Correia
This custom indicator for MetaTrader 4 is a powerful tool designed to help traders of all experience levels identify clear trends in the financial market. It is built to provide precise visual support, eliminating the confusion and subjectivity often associated with chart analysis. Additionally, it ensures that you can stay in a profitable position throughout the entire duration of a trend, avoiding premature exits before the movement is fully realized. Identifying Clear Trends The foundation o
Ultimate Binary Options
Teresinha Moraes Correia
Ultimate Binary Options: The Best Indicator for Your Binary Options Trading If you're looking for a reliable, efficient, and powerful way to boost your results in binary options trading, Ultimate Binary Options is the perfect solution for you. This indicator was developed to provide traders with unparalleled accuracy, delivering success rates above 90% . But it's not just about numbers—it's about turning your strategies into consistently winning trades. What Makes Ultimate Binary Options S
Filtro:
No hay comentarios
Respuesta al comentario