• Información general
  • Comentarios
  • Discusión

TrendWave BB

A professional-grade Bollinger Bands percentage analyzer.

Transform your trading strategies with the BBPCT Indicator, an advanced Bollinger Band Percentage indicator developed by iDevelop.expert. This tool is tailored to provide traders with a clear and actionable visualization of price movements relative to Bollinger Bands, along with insightful overbought and oversold signals.

Key Features:

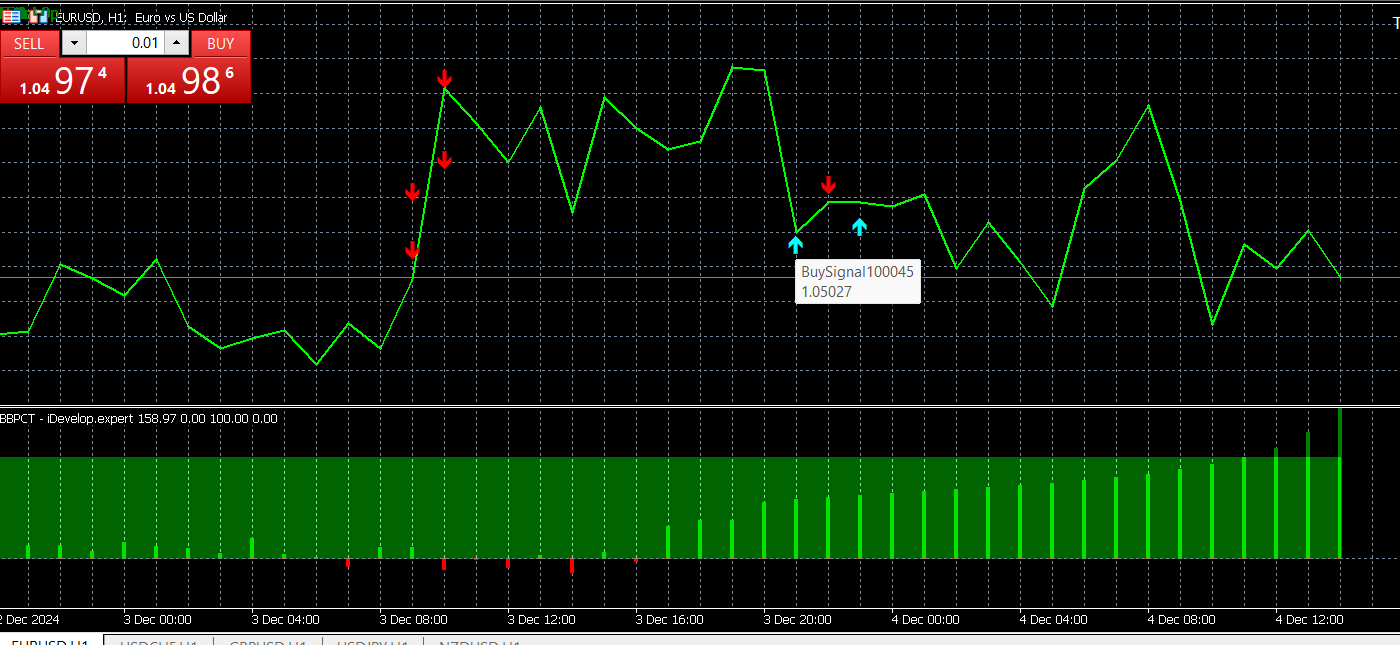
  1. Dynamic Histogram Visualization:

    • A dual-colored histogram for quick identification:
      • Green bars indicate positive price movements.
      • Red bars highlight negative price movements.
    • Provides a clear view of the position of prices relative to the Bollinger Bands.
  2. Oversold and Overbought Zones:

    • Automatically highlights overbought (red) and oversold (green) zones on the chart.
    • Empowers traders to identify potential reversal points effortlessly.
  3. Customizable Parameters:

    • Adjustable Bollinger Band period ( length ) and multiplier for tailoring the indicator to specific trading styles.
    • Define your own overbought and oversold levels to match your strategy.
  4. Signal Arrows for Entries:

    • Automatically generates buy signals when prices exit the oversold zone.
    • Triggers sell signals when prices exit the overbought zone.
    • Enhances decision-making with precise entry points, displayed directly on the chart.
  5. User-Friendly Design:

    • Neatly plotted in a separate window for easy interpretation without cluttering the price chart.
    • Adjustable color schemes and widths to suit personal preferences.
  6. Reliable Calculations:

    • Employs a robust algorithm to calculate Bollinger Bands and standard deviations dynamically.
    • Ensures accuracy and consistency across various timeframes and symbols.

Why Choose BBPCT?

BBPCT simplifies Bollinger Band analysis by providing a percentage-based perspective, giving traders an intuitive way to gauge price action within a band. Its visual clarity and actionable signals make it an essential tool for day traders, swing traders, and technical analysts alike.

How It Works:

  • The indicator calculates the Bollinger Band values and positions the closing price as a percentage relative to the bands.
  • It highlights this percentage using positive and negative histograms, enabling rapid assessment of price behavior.
  • Overbought and oversold conditions are filled with shaded regions to guide traders visually.
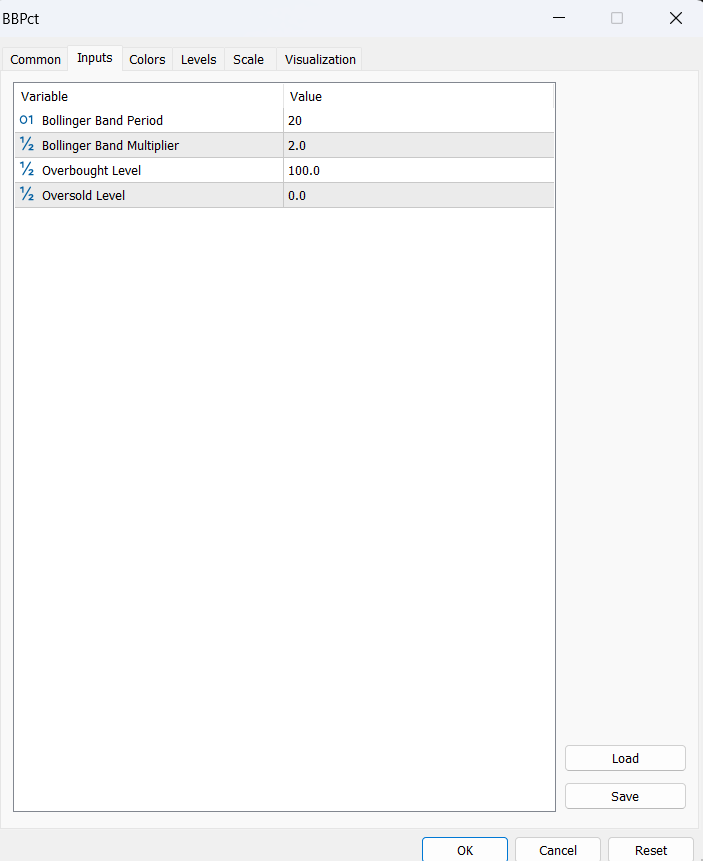
Input Parameters:

  • Length: Defines the period for the Bollinger Bands (default: 20).
  • Multiplier: Sets the deviation multiplier for the bands (default: 2.0).
  • Overbought Level: Indicates the overbought threshold (default: 100).
  • Oversold Level: Indicates the oversold threshold (default: 0).

Usage Tips:

  • Combine with trend-following indicators for confirmation.
  • Adjust the multiplier and levels based on market volatility.
  • Use on multiple timeframes for comprehensive market analysis.

Discover the power of enhanced Bollinger Band analysis. Try the BBPCT Indicator today and elevate your trading to new heights!

For more information, visit iDevelop.expert.


Productos recomendados
Indicator details The Moving Average Retracement Boundaries(M.A.R.B) shows the average retracement level above or below the given moving average.It shows the first upper boundary (which is the average retracement above the moving average ),the second upper boundary (which is double the first upper boundary),the first lower boundary (which is the average retracement below the moving average) and the second lower boundary (which is double the first lower boundary). How to use it 1.It can be used
FREE
La esencia del sistema consiste en la identificación del momento de formación de la vela compuesta "de vuelta" con características determinadas (tamaño de la vela en puntos, estructura de sombras).En el análisis de las velas japonesas el análogo de estas velas de vuelta son "Martillo" (Hammer) y "Hombre colgado" (Hanging Man), pero en este sistema el cuerpo de la vela no tiene que ser obligatoriamente pequeño, y la vela resultante se construye de varias velas. Parámetros de entrada del sistema:
FREE
Easy GOLD MT5
Franck Martin
3.97 (32)
Easy Gold is the latest addition to the BotGPT family. It is surprising and very powerful. It is ideal for beginners due to its simplicity.  There is absolutely nothing to do, it's 100% automated, simply indicate the percentage of risk you want to take per trade and the EA is ready. Whatever your capital, the EA takes care of everything. Optimized on (XAUUSD).  Unleash all the power with the professional version (AGI Gold) and its connection to the neural network, available in my store. My othe
FREE
Free automatic Fibonacci is an indicator that automatically plots a Fibonacci retracement based on the number of bars you select on the BarsToScan setting in the indicator. The Fibonacci is automatically updated in real time as new highest and lowest values appears amongst the selected bars. You can select which level values to be displayed in the indicator settings. You can also select the color of the levels thus enabling the trader to be able to attach the indicator several times with differe
FREE
Follow The Line MT5
Oliver Gideon Amofa Appiah
4.52 (29)
This indicator obeys the popular maxim that: "THE TREND IS YOUR FRIEND" It paints a GREEN line for BUY and also paints a RED line for SELL. (you can change the colors). It gives alarms and alerts of all kinds. IT DOES NOT REPAINT and can be used for all currency pairs and timeframes. Yes, as easy and simple as that. Even a newbie can use it to make great and reliable trades. NB: For best results, get my other premium indicators for more powerful and reliable signals. Get them here: https://www.m
FREE
Multi-timeframe trend indicator based on the ADX / ADXWilder indicator with Fibonacci levels The indicator shows trend areas using ADX or ADXWilder indicator data from multiple timeframes. The impulse mode of the indicator allows you to catch the beginning of a trend, and several "Screens" with different timeframes allow you to filter out market noise. Fibonacci levels are added to the price chart, which have flexible settings. How the indicator works: if PDI is greater than NDI, then   it`s
FREE
Mitimom
Danil Poletavkin
The indicator is based on Robert Miner's methodology described in his book "High probability trading strategies" and displays signals along with momentum of 2 timeframes. A Stochastic oscillator is used as a momentum indicator. The settings speak for themselves period_1 is the current timeframe, 'current' period_2 is indicated - the senior timeframe is 4 or 5 times larger than the current one. For example, if the current one is 5 minutes, then the older one will be 20 minutes The rest of the s
FREE
Технический индикатор Trend Moving Average позволяет определить глобальное направление рынка. Данный технический индикатор создан для того, чтобы определить «линию наименьшего сопротивления» рынка и понять в какую сторону направлен тренд. Помимо классического использования МА, индикатор позволяет понять направленность рынка на основе динамики его значений. Так, если значение индикатора демонстрируют переход с нисходящего значения в восходящее (и наоборот) - это является дополнительным торговым с
FREE
HighLow MT5
Azamat Mullayanov
4 (2)
The indicator plots two lines by High and Low prices. The lines comply with certain criteria. The blue line is for buy. The red one is for sell. The entry signal - the bar opens above\below the lines. The indicator works on all currency pairs and time frames It can be used either as a ready-made trading system or as an additional signal for a custom trading strategy. There are no input parameters. Like with any signal indicator, it is very difficult to use the product during flat movements. You
FREE
This indicator is the mql version of the   Smoothed   Heiken Ashi Candles. Heikin-Ashi charts resemble   candlestick charts , but have a smoother appearance as they track a range of price movements, rather than tracking every price movement as with candlesticks. Because the Heikin Ashi candlesticks are calculated based on averages, the candlesticks will have smaller shadows than a regular Japanese candlestick. Just like with regular Japanese candlesticks, with a Heikin Ashi candlestick, the sm
FREE
Trend indicator based on the ADX / ADXWilder indicator The indicator shows trend areas using ADX or ADXWilder indicator data. How the indicator works: if PDI is greater than NDI, then it`s bullish movement; if PDI is less than NDI, then it`s bearish movement; if ADX is less than or equal to the filter value specified in the parameters, then there is no movement state. Input parameters of the indicator: Calculate Timeframe - timeframe for calculation; ADX Type - type of ADX calculation based
FREE
IQuantum
Evgeniy Scherbina
The indicator IQuantum shows trading signals for 10 symbols in the daily chart: AUDCAD, AUDUSD, EURUSD, GBPCAD, GBPCHF, GBPUSD, NZDUSD, USDCAD, USDCHF, and USDJPY. Signals of the indicator are produced by 2 neural models which were trained independently from one another. The inputs for the neural models are normalised prices of the symbols, as well as prices of Gold, Silver and markers of the current day. Each neural model was trained in 2 ways. The Ultimate mode is an overfitted neural model
FREE
PFKBreakOut
Stanislav Korotky
This indicator displays breakouts on Point-And-Figure-like or Kagi-like custom symbol charts, generated by special expert advisers, such as PointFigureKagiCharts . This indicator is applicable only for custom instruments generated in appropriate way (with time-invariant bars which are multiples of a predefined box size). It makes no sense to apply it to other charts. The breakouts in up or down direction are marked by arrows. The breakout price is found at crossing of one of imaginary lines of
FREE
Main Indicator Description: RosMaFin Triple Insight CCI Navigator is an advanced technical indicator that combines the power of three popular indicators - CCI (Commodity Channel Index), Bollinger Bands, and Moving Average - in one comprehensive window. This versatile tool provides traders with a complex view of market conditions and helps identify potential trading opportunities with greater precision. Key Features: Display of all three indicators in one window for efficient analysis Fully custo
FREE
The Scaled Awesome Oscillator (SAO) represents a refined adaptation of the Awesome Oscillator, aimed at establishing consistent benchmarks for identifying market edges. Unlike the standard Awesome Oscillator, which records the variation in pips across different commodities, the only unchanging reference point is the zero line. This limitation hampers investors and traders from pinpointing specific levels for trend reversals or continuations using the traditional Awesome Indicator, a creation of
FREE
High Low Open Close
Alexandre Borela
4.98 (42)
Si te gusta este proyecto, deja una revisión de 5 estrellas. Este indicador dibuja los precios abiertos, altos, bajos y finales para los especificados período y se puede ajustar para una zona horaria específica. Estos son niveles importantes considerados por muchos institucionales y profesionales comerciantes y puede ser útil para que usted sepa los lugares donde podrían ser más activo. Los períodos disponibles son: Día previo. Semana anterior. Mes anterior. Barrio anterior. Año anterior. O:
FREE
Bollinger Bands B
Flavio Javier Jarabeck
4.5 (2)
John Bollinger created this indicator in 2010 as a way to read the original indicator (Bollinger Bands) in a more "technical" way, shown as an oscillator. The typical range of the Bollinger Bands %B is 0 - 0.5 - 1.0, where "0" represents the lower band, the "0.5" the middle band, and "1" the upper band. The line on the indicator represents the Closing prices. As simple as that. SETTINGS Bollinger Bands period of analysis Standard Deviation multiplier Shift Price type to be analyzed If you like
FREE
El indicador identifica cuando ocurre una divergencia entre el precio y un indicador u oscilador. Identifica divergencias tanto regulares como ocultas. Combinado con sus propias reglas y técnicas, este indicador le permitirá crear (o mejorar) su propio sistema poderoso. Características Puede detectar divergencias para los siguientes osciladores / indicadores:       MACD, OsMA, estocásticos, RSI, CCI, RVI, Awesome, ADX, ATR, OBV, índice compuesto, MFI y Momentum. Solo se puede seleccionar un osc
FREE
Indicador Heiken Ashi MT5 Mejore su análisis técnico con el indicador Heiken Ashi MT5. Esta poderosa herramienta transforma los datos de precios estándar en velas más suaves y orientadas a la tendencia, facilitando la identificación de tendencias del mercado y posibles puntos de inversión. Características principales: Identificación clara de tendencias: Distinga visualmente entre tendencias alcistas y bajistas con diferentes colores de velas. Reducción del ruido: Filtre las fluctuaciones de pre
FREE
Santa Donchian
Marco Aurelio Cestari
4.5 (2)
Santa Donchian Indicator  is an efficient way to detect support, resistence and break outs in any market. The Donchian channel measures the high and the low of a previously defined range.  Typically, a trader would look for a well-defined range and then wait for the price to break out to either one side for a trade entry trigger. Advantages Never repaints, never backpaints, never recalculates. Works in all symbols and all timeframes. Perfect trend filter for any strategy or expert advisor. Full
FREE
Este innovador indicador de medición de la fuerza de la moneda de INFINITY es un ayudante indispensable para los revendedores y comerciantes que negocian en el largo plazo. El sistema de Análisis de fortaleza / debilidad de las monedas ha sido conocido y utilizado en el mercado por los principales operadores del mundo. Cualquier comercio de arbitraje no está completo sin este análisis. Nuestro indicador determina fácilmente la fuerza de las monedas subyacentes entre sí. Muestra gráficos de líne
FREE
The indicator highlights the points that a professional trader sees in ordinary indicators. VisualVol visually displays different volatility indicators on a single scale and a common align. Highlights the excess of volume indicators in color. At the same time, Tick and Real Volume, Actual range, ATR, candle size and return (open-close difference) can be displayed. Thanks to VisualVol, you will see the market periods and the right time for different trading operations. This version is intended f
FREE
This indicator is a zero-lag indicator and displays  strength of trend change . True Trend  Oscillator Pro works best in combination with True Trend Moving Average Pro that displays exact trend as is. Oscillator value is exact price change in given direction of the trend. True Trend Moving Average Pro: https://www.mql5.com/en/market/product/103586 If you set PERIOD input parameter to 1 this indicator becomes a sharpshooter for binary options. Developers can use True Trend Oscillator in Exper
FREE
Advanced Trend Builder is a trend indicator using the original calculation algorithm. ATB can be used on any data and timeframe. My recommendation use for calculation numbers 4 - 16 - 64 - 256 and so on ..., but this is only recommendation. The middle of the trend wave is a special place where market behavior is different, when developed ATB was main idea to find the middle of the wave trend. Input parameters: Bars will be used for calculation - number of bars used for a trend line calculation.
FREE
Ema Cross Alert V1
Paul Conrad Carlson
Alert Indicator for exponential moving average cross blue arrow for buy alert , fast ema 14 crosses above 50 pink arrow for sell alert , fast ema 14 crosses below 50 Default 14 ema fast & 50 ema slow add these indicators to chart Full Alerts , push, email, phone  inputs for moving average lengths and alarm on off settings Please contact for help of an indicator alert suggestion 
FREE
El   Nadaraya-Watson Envelope   es un indicador basado en regresión no paramétrica que ayuda a los traders a identificar tendencias, niveles de soporte y resistencia con bandas suaves y adaptativas. A diferencia de los promedios móviles tradicionales o las envolventes basadas en desviación estándar, este indicador aplica   regresión kernel de Nadaraya-Watson , ajustándose dinámicamente a los movimientos del precio, reduciendo el retraso y manteniendo la capacidad de respuesta. Características
FREE
Price Action Finder MT5
Siarhei Vashchylka
5 (10)
The Price Action Finder indicator is an indicator of entry points, which is designed to search and display patterns of the Price Action system on a price chart. The indicator is equipped with a system of trend filters, as well as a system of alerts and push notifications. Manual (Be sure to read before purchasing) | Version for MT4 Advantages 1. Patterns: Pin bar, Outside bar, Inside bar, PPR, Power bar, Hanging man, Inverted hammer 2. Pattern filtering system. Removes countertrend patterns from
SSA Trend Predictor
Roman Korotchenko
4.5 (4)
This indicator extracts a trend from a price series and forecasts its further development. Algorithm is based on modern technique of Singular Spectral Analysis ( SSA ). SSA is used for extracting the main components (trend, seasonal and wave fluctuations), smoothing and eliminating noise. It does not require the series to be stationary, as well as the information on presence of periodic components and their periods. It can be applied both for trend and for another indicators. Features of the me
FREE
DMC Donchian Channel
Deibson Carvalho
5 (2)
What are Donchian Channels? Donchian Channels are three lines generated by moving average calculations that comprise an indicator formed by upper and lower bands around a mid-range or median band. The upper band marks the highest price of a security over N periods while the lower band marks the lowest price of a security over N periods. The area between the upper and lower bands represents the Donchian Channel. Career futures trader Richard Donchian developed the indicator in the mid-twentieth c
FREE
The indicator detects and displays М. Gartley's Butterfly pattern. The pattern is plotted by the extreme values of the ZigZag indicator (included in the resources, no need to install). After detecting the pattern, the indicator notifies of that by the pop-up window, a mobile notification and an email. The pattern and wave parameters are displayed on the screenshots. The default parameters are used for demonstration purposes only in order to increase the amount of detected patterns. Parameters z
Los compradores de este producto también adquieren
Trend Screener Pro MT5
STE S.S.COMPANY
4.89 (74)
Desbloquee el poder del comercio de tendencias con el indicador Trend Screener: ¡su solución definitiva para el comercio de tendencias impulsada por lógica difusa y un sistema multidivisa!Mejore su comercio de tendencias con Trend Screener, el revolucionario indicador de tendencias impulsado por lógica difusa. Es un poderoso indicador de seguimiento de tendencias que combina más de 13 herramientas y funciones premium y 3 estrategias comerciales, lo que lo convierte en una opción versátil para co
Golden Trend Indicator MT5
Noha Mohamed Fathy Younes Badr
4.88 (16)
Golden Trend indicator  is The best indicator for predicting trend movement this indicator never lags and never repaints and never back paints    and give  arrow buy and sell    before the candle appear  and it will help you and  will make your trading decisions clearer its work on all currencies and  gold and crypto and all time frame This unique  indicator uses very secret algorithms to catch the  trends, so you can trade using this indicator and see the trend clear on charts  manual guide and
FX Levels MT5
Daniel Stein
5 (3)
FX Levels: Zonas de Soporte y Resistencia con Precisión Excepcional para Todos los Mercados Resumen Rápido ¿Busca una manera confiable de identificar niveles de soporte y resistencia en cualquier mercado — ya sean divisas, índices, acciones o materias primas? FX Levels combina el método tradicional “Lighthouse” con un enfoque dinámico vanguardista, ofreciendo una precisión casi universal. Gracias a nuestra experiencia real con brokers y a las actualizaciones automáticas diarias más las de tiem
IX Power MT5
Daniel Stein
4.83 (6)
IX Power: Descubre perspectivas de mercado para índices, materias primas, criptomonedas y forex Descripción general IX Power es una herramienta versátil diseñada para analizar la fortaleza de índices, materias primas, criptomonedas y símbolos de forex. Mientras que FX Power ofrece la máxima precisión para pares de divisas mediante el uso de datos de todos los pares disponibles, IX Power se centra exclusivamente en los datos del mercado del símbolo subyacente. Esto convierte a IX Power en una e
FX Volume MT5
Daniel Stein
4.82 (17)
FX Volume: Experimente el Verdadero Sentimiento del Mercado desde la Perspectiva de un Bróker Resumen Rápido ¿Desea llevar su estrategia de trading a otro nivel? FX Volume ofrece información en tiempo real sobre cómo los traders minoristas y los brókers están posicionados, mucho antes de que aparezcan informes retrasados como el COT. Ya sea que busque beneficios consistentes o simplemente quiera una ventaja más profunda en los mercados, FX Volume le ayuda a identificar desequilibrios important
FX Power MT5 NG
Daniel Stein
5 (11)
FX Power: Analiza la Fuerza de las Divisas para Decisiones de Trading Más Inteligentes Descripción General FX Power es tu herramienta esencial para comprender la fuerza real de las principales divisas y el oro en cualquier condición de mercado. Al identificar divisas fuertes para comprar y débiles para vender, FX Power simplifica las decisiones de trading y descubre oportunidades de alta probabilidad. Ya sea que quieras seguir las tendencias o anticipar reversiones utilizando valores extremos
CBT Quantum Maverick Sistema de Comercio de Opciones Binarias de Alta Eficiencia CBT Quantum Maverick es un sistema de opciones binarias de alto rendimiento diseñado para traders que buscan precisión, simplicidad y un enfoque disciplinado. No requiere personalización: el sistema está optimizado para resultados efectivos desde el primer momento. Simplemente sigue las señales, que se pueden dominar con un poco de práctica. Características clave: Precisión de señales: Señales basadas en la próxim
TPSproTREND PrO MT5
Roman Podpora
4.69 (16)
TPSpro TREND PRO  - is a trend indicator that automatically analyzes the market and provides information about the trend and each of its changes, as well as giving signals for entering trades without redrawing! The indicator uses each candle, analyzing them separately. referring to different impulses - up or down impulse. Exact entry points into transactions for currencies, crypto, metals, stocks, indices!  ИНСТРУКЦИЯ RUS         INSTRUCTIONS  ENG       R ecommended to use with an indicator   -
FX Dynamic: Rastrea la volatilidad y las tendencias con un análisis ATR personalizable Descripción general FX Dynamic es una herramienta potente que emplea los cálculos de Average True Range (ATR) para brindar a los traders información incomparable sobre la volatilidad diaria e intradía. Al establecer umbrales de volatilidad claros —por ejemplo, 80%, 100% y 130%— puedes identificar rápidamente oportunidades de beneficio o recibir alertas cuando el mercado excede sus rangos habituales. FX Dynam
Este es un genial indicador para MT5 que ofrece señales precisas para entrar en una transacción sin redibujar. Se puede aplicar a cualquier activo financiero: fórex, criptomonedas, metales, acciones, índices. Nos dará valoraciones bastante precisas y nos dirá cuándo es mejor abrir y cerra una transacción. Eche un vistazo  al vídeo  (6:22), ¡contiene un ejemplo de procesamiento de una sola señal que ha amortizado el indicador! La mayoría de los tráders mejoran sus resultados comerciales durante l
Este tablero muestra los últimos   patrones armónicos   disponibles para los símbolos seleccionados, por lo que ahorrará tiempo y será más eficiente /   versión MT4 . Indicador gratuito:   Basic Harmonic Pattern Columnas del indicador Symbol:   aparecerán los símbolos seleccionados Trend :   alcista o bajista Pattern :   tipo de patrón (gartley, mariposa, murciélago, cangrejo, tiburón, cifrado o ABCD) Entry :   precio de entrada SL:   precio de stop loss TP1:   1er precio de toma de beneficios
Matrix Arrow Indicator MT5
Juvenille Emperor Limited
5 (13)
Matrix Arrow Indicator MT5   es una tendencia única 10 en 1 que sigue un indicador   100% sin repintado   de marcos temporales múltiples que se puede usar en todos los símbolos/instrumentos:   divisas ,   materias primas ,   criptomonedas ,   índices ,   acciones .  Matrix Arrow Indicator MT5  determinará la tendencia actual en sus primeras etapas, recopilando información y datos de hasta 10 indicadores estándar, que son: Índice de movimiento direccional promedio (ADX) Índice de canales de prod
Gartley Hunter Multi
Siarhei Vashchylka
5 (9)
Gartley Hunter Multi - An indicator for searching for harmonic patterns simultaneously on dozens of trading instruments and on all possible timeframes. Manual (Be sure to read before purchasing) | Version for MT4 Advantages 1. Patterns: Gartley, Butterfly, Shark, Crab. Bat, Alternate Bat, Deep Crab, Cypher 2. Simultaneous search for patterns on dozens of trading instruments and on all possible timeframes 3. Search for patterns of all possible sizes. From the smallest to the largest 4. All fou
Gold Stuff mt5
Vasiliy Strukov
4.92 (173)
Gold Stuff mt5: un indicador de tendencia diseñado específicamente para el oro, también se puede usar en cualquier instrumento financiero. El indicador no se vuelve a dibujar ni se retrasa. El marco de tiempo recomendado es H1. IMPORTANTE! Póngase en contacto conmigo inmediatamente después de la compra para obtener instrucciones y bonificación!   Puede obtener una copia gratuita de nuestro indicador Strong Support y Trend Scanner, por favor envíe un mensaje privado. ¡a mí! PARÁMETROS Draw Ar
TPSpro RFI Levels MT5
Roman Podpora
4.53 (19)
INSTRUCCIONES       RUSO   -   ING        Se   recomienda utilizar con un indicador.       -       TPSpro   TENDENCIA PRO -   Versión MT5 Un elemento clave en el trading son las zonas o niveles desde los que se toman las decisiones de compra o venta de un instrumento de trading. A pesar de los intentos de los principales actores de ocultar su presencia en el mercado, inevitablemente dejan rastros. Nuestra tarea era aprender a identificar estos rastros e interpretarlos correctamente. Funciones p
Ante todo, vale la pena enfatizar que esta Herramienta de Trading es un Indicador No Repintado, No Redibujado y No Retrasado, lo que la hace ideal para el trading profesional. Curso en línea, manual del usuario y demostración. El Indicador de Conceptos de Acción del Precio Inteligente es una herramienta muy potente tanto para traders nuevos como experimentados. Combina más de 20 indicadores útiles en uno solo, combinando ideas avanzadas de trading como el Análisis del Trader del Círculo Interi
Atomic Analyst MT5
Issam Kassas
4.32 (19)
En primer lugar, vale la pena enfatizar que este Indicador de Trading no repinta, no redibuja y no se retrasa, lo que lo hace ideal tanto para el trading manual como para el automatizado. Manual del usuario: configuraciones, entradas y estrategia. El Analista Atómico es un Indicador de Acción del Precio PA que utiliza la fuerza y el impulso del precio para encontrar una mejor ventaja en el mercado. Equipado con filtros avanzados que ayudan a eliminar ruidos y señales falsas, y aumentan el poten
Bill Williams Advanced
Siarhei Vashchylka
5 (9)
Bill Williams Advanced is designed for automatic chart analysis using Bill Williams' "Profitunity" system. The indicator analyzes four timeframes at once. Manual (Be sure to read before purchasing) Advantages 1. Automatically analyzes the chart using the "Profitunity" system of Bill Williams. The found signals are placed in a table in the corner of the screen. 2. Equipped with a trend filter based on the Alligator indicator. Most of the system signals are recommended to be used only according t
Support And Resistance Screener está en un indicador de nivel para MetaTrader que proporciona múltiples herramientas dentro de un indicador. Las herramientas disponibles son: 1. Cribador de estructura de mercado. 2. Zona de retroceso alcista. 3. Zona de retroceso bajista. 4. Puntos pivotes diarios 5. Puntos de pivote semanales 6. Puntos Pivotes mensuales 7. Fuerte soporte y resistencia basado en patrón armónico y volumen. 8. Zonas de nivel de banco. OFERTA POR TIEMPO LIMITADO: El indicador de so
Quantum Trend Sniper
Bogdan Ion Puscasu
4.73 (51)
Introduciendo       Indicador Quantum Trend Sniper   , el innovador indicador MQL5 que está transformando la forma en que identificas y negocias los cambios de tendencia. Desarrollado por un equipo de comerciantes experimentados con experiencia comercial de más de 13 años,       Indicador de francotirador de tendencia cuántica       está diseñado para impulsar su viaje comercial a nuevas alturas con su forma innovadora de identificar cambios de tendencia con una precisión extremadamente alta. *
RelicusRoad Pro MT5
Relicus LLC
4.78 (18)
Ahora $ 147 (aumentando a $ 499 después de algunas actualizaciones) - Cuentas ilimitadas (PC o Mac) Manual de usuario de RelicusRoad + Videos de capacitación + Acceso al grupo privado de Discord + Estado VIP UNA NUEVA MANERA DE VER EL MERCADO RelicusRoad es el indicador comercial más poderoso del mundo para divisas, futuros, criptomonedas, acciones e índices, y brinda a los comerciantes toda la información y las herramientas que necesitan para mantenerse rentables. Brindamos análisis técnico
Quantum TrendPulse
Bogdan Ion Puscasu
5 (13)
Presentamos   Quantum TrendPulse   , la herramienta de trading definitiva que combina el poder de   SuperTrend   ,   RSI   y   Stochastic   en un indicador integral para maximizar su potencial de trading. Diseñado para traders que buscan precisión y eficiencia, este indicador le ayuda a identificar tendencias del mercado, cambios de impulso y puntos de entrada y salida óptimos con confianza. Características principales: Integración con SuperTrend:   siga fácilmente la tendencia predominante del
TW Trend Scalper Indicator: TW Scalper Shoot te brinda una experiencia de trading única al utilizar las últimas estrategias de trading y tecnología de inteligencia artificial. Este producto satisface las diversas necesidades de los traders scalpers al proporcionar dos categorías distintas de señales: Prueba este excepcional producto hoy y comienza tu experiencia única hacia convertirte en un scalper de tendencias. Además, recibe un producto valorado en $37 como regalo. Categorías de señales
El Indicador de Cuadrados de Gann es una herramienta poderosa de análisis de mercado basada en el artículo "Fórmula Matemática para Predicciones de Mercado" escrito por W.D. Gann, que se basa en conceptos matemáticos para el análisis. Incorpora elementos de las técnicas de Gann relacionadas con los cuadrados de 144, 90 y 52, así como el cuadrado de 9. Además, incluye el método del  sobre cómo combinar el cuadrado de 9 con canales y patrones de estrellas. Manual del Usuario y Modo de Uso: Antes d
ICT, SMC, SMART MONEY CONCEPTS, SMART MONEY, Smart Money Concept, Support and Resistance, Trend Analysis, Price Action, Market Structure, Order Blocks, BOS/CHoCH,   Breaker Blocks ,  Momentum Shift,   Supply&Demand Zone/Order Blocks , Strong Imbalance,   HH/LL/HL/LH,    Fair Value Gap, FVG,  Premium  &   Discount   Zones, Fibonacci Retracement, OTE, Buy Side Liquidity, Sell Side Liquidity, BSL/SSL Taken, Equal Highs & Lows, MTF Dashboard, Multiple Time Frame, BigBar, HTF OB, HTF Market Structure
BookMap HeatMap
Roberto Spadim
1 (2)
This Indicator creates a heatmap based on depth of market of the current symbol or another symbol. Other symbol is useful when you trade futures market and a contract has 'mini' and 'full' split. For example, in Brazil (B3 - BMF&Bovespa), WDO and DOL are future Forex contract of BRL/USD (where 1 DOL = 5 WDO) and big banks work mostly with DOL (where liquidity is important). Please use with M1 timeframe , objects are too small to be displayed at higher timeframes (MT5 limit). The number of level
Black Dragon indicator mt5
Ramil Minniakhmetov
4.83 (58)
El indicador de detección de tendencias complementará cualquier estrategia y también se puede utilizar como una herramienta independiente. Ventajas Fácil de usar, no sobrecarga el gráfico con información innecesaria; Puede usarse como filtro para cualquier estrategia; Tiene niveles integrados de soporte y resistencia dinámicos, que se pueden usar tanto para obtener ganancias como para establecer límites de pérdidas; El indicador no cambia de color después de que se cierra la vela;  Funciona e
Berma Bands
Muhammad Elbermawi
5 (3)
El indicador de bandas de Berma (BB) es una herramienta valiosa para los operadores que buscan identificar y aprovechar las tendencias del mercado. Al analizar la relación entre el precio y las bandas de Berma, los operadores pueden discernir si un mercado se encuentra en una fase de tendencia o de rango. Visita el [ Blog de Berma Home ] para saber más. Las bandas de Berma se componen de tres líneas distintas: la banda de Berma superior, la banda de Berma media y la banda de Berma inferior. Esta
Gold Trend 5
Sergei Linskii
3.5 (2)
Tendencia del oro : se trata de un buen indicador técnico bursátil. El algoritmo del indicador analiza el movimiento del precio de un activo y refleja la volatilidad y las posibles zonas de entrada. Las mejores señales del indicador: - Para VENTA = histograma rojo + puntero rojo CORTO + flecha amarilla de señal en la misma dirección. - Para COMPRA = histograma azul + puntero azul LARGO + flecha de señal aqua en la misma dirección. Ventajas del indicador: 1. El indicador produce señales co
Introduciendo       Quantum Breakout PRO   , el innovador indicador MQL5 que está transformando la forma en que comercia con Breakout Zones. Desarrollado por un equipo de comerciantes experimentados con experiencia comercial de más de 13 años,       Desglose cuántico PRO       está diseñado para impulsar su viaje comercial a nuevas alturas con su innovadora y dinámica estrategia de zona de ruptura. El indicador de ruptura cuántica le dará flechas de señal en las zonas de ruptura con 5 zonas ob
Otros productos de este autor
CandleSculptor: Master the Art of Candlestick Patterns and Take Your Trading to the Next Level! Unlock the power of advanced candlestick pattern recognition with CandleSculptor , the ultimate indicator for traders who want to gain a competitive edge in the markets. Whether you're a beginner or an experienced trader, CandleSculptor will help you spot key market reversal and continuation signals instantly, right on your chart. Key Features: Accurate Candlestick Pattern Detection: Automatically ide
The SuperTrend Indicator is a powerful trend-following tool that overlays directly on your price chart. Designed to help traders identify prevailing trends and potential reversals, this indicator uses Average True Range (ATR) calculations to dynamically adjust to market volatility. The intuitive color-coded display ensures clear visualization of trend changes. Key Features: Dynamic Trend Identification: Utilizes ATR-based calculations to provide responsive support/resistance levels in line with
Filtro:
No hay comentarios
Respuesta al comentario