• Información general
  • Comentarios
  • Discusión
  • Novedades

Aroon Indicator MT5

If you love this indicator, please leave a positive rating and comment, it will be a source of motivation to help me create more products <3

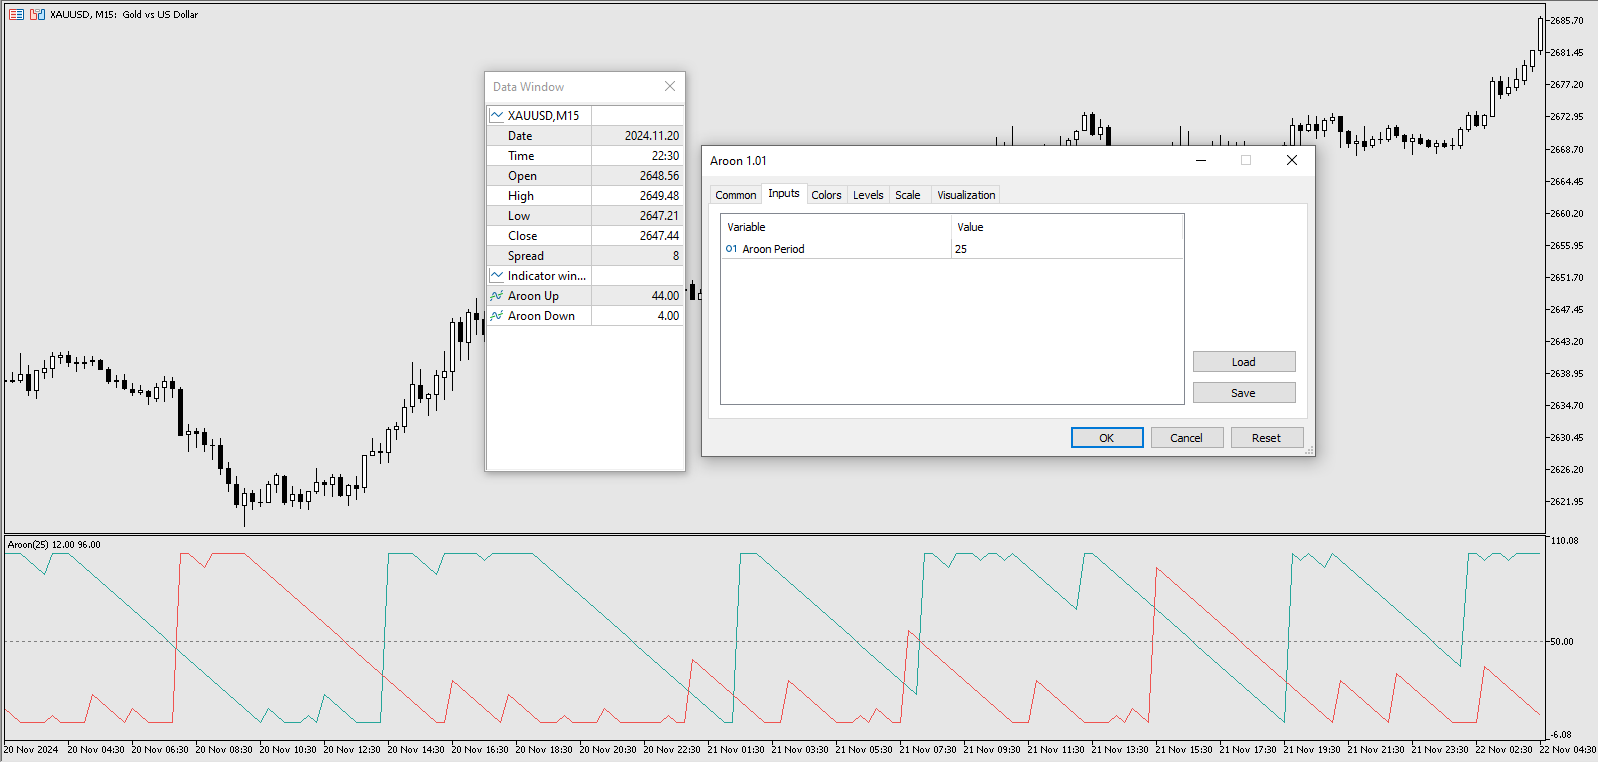
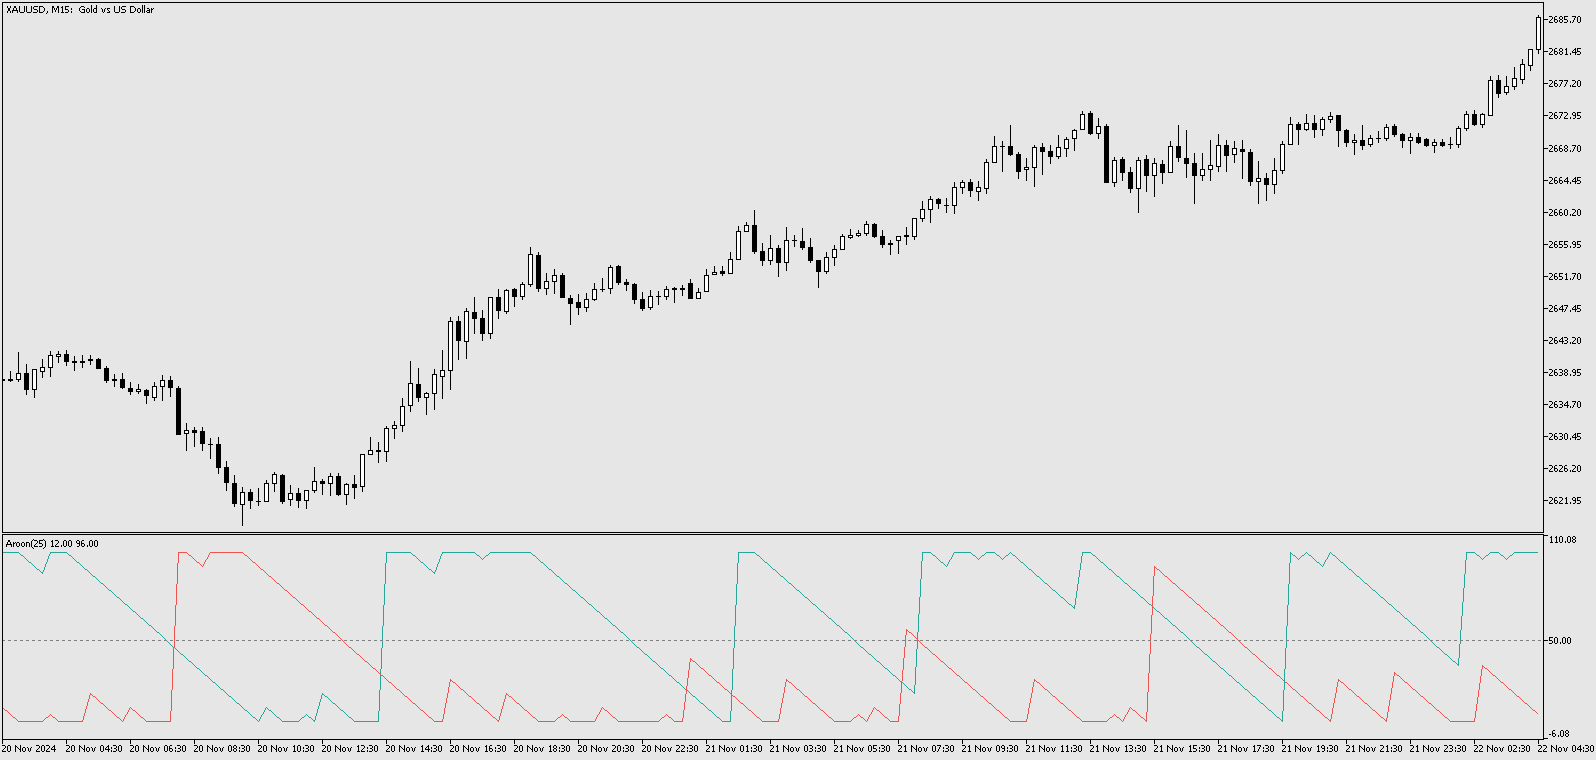
How to use Aroon Indicator?

  • The AroonUp and the AroonDown measure the strength of the uptrend and the strength of the downtrend, respectively. These lines fluctuate between zero and 100. Values close to 100 indicate a strong trend and values near zero indicate a weak trend where the lower the AroonUp, the weaker the uptrend and the stronger the downtrend, and vice versa.
  • Crossovers can signal entry or exit points. Aroon Up crossing above  Aroon  Down can be a signal to buy.  Aroon Down crossing above Aroon Up may be a signal to sell. When both indicators are below 50, it can signal that there is no clear trend.

The Aroon indicator is a technical tool that can help traders identify trends in price changes as well as the strength of those trends. As with any trading tool, traders should understand how they work before applying them in their trading strategies. Rather than using it alone, it's advisable to use the Aroon indicator with other tools, such as the MACD.


Productos recomendados
El   Indicador Kijun-Sen Envelope   es una herramienta de seguimiento de tendencias basada en la línea   Kijun-Sen   del sistema Ichimoku Kinko Hyo. Este indicador crea bandas dinámicas alrededor de Kijun-Sen, formando un canal que ayuda a los traders a identificar tendencias del mercado, posibles reversiones y condiciones de sobrecompra o sobreventa. Características principales: •   Confirmación de tendencias   – ayuda a determinar si el mercado está en tendencia o en fase de consolidación. •
FREE
Enhance your price action strategy: inside bar breakouts at your fingertips This indicator detects inside bars of several ranges, making it very easy for price action traders to spot and act on inside bar breakouts. [ Installation Guide | Update Guide | Troubleshooting | FAQ | All Products ] Easy to use and understand Customizable color selections The indicator implements visual/mail/push/sound alerts The indicator does not repaint or backpaint An inside bar is a bar or series of bars which is/a
LT Rainbow Trend
Thiago Duarte
5 (1)
Do you, like me, like to trade with the trend? Then this indicator will help you! Rainbow Trend is a trend indicator, which uses several Moving Averages on the chart. It measures different trend strenght zones for different periods: very long term, long term, mid term, short term and very short term. Each zone has its color, and it is possible to have sound alert when the prices leaves a zone and enters another. Its configuration is very simple. If you find any bug or have any suggestions, conta
Features All Ichimoku Signals (Selectable) : Display all reliable signals generated by the Ichimoku indicator. You can choose which signals to view based on your preferences. Filter by Signal Strength : Sort signals by their strength—whether they are weak, neutral, or strong. Live Notifications : Receive real-time notifications for Ichimoku signals. Transparent Cloud : Visualize the Ichimoku cloud in a transparent manner. Available Signals Tenkensen-Kijunsen Cross Price-Kijunsen Cross Price-C
MrGoldTrend is a sophisticated trend-following indicator designed exclusively for XAUUSD (Gold) traders on the MQL5 platform. With clear, easy-to-interpret visual signals, this indicator helps you quickly identify the prevailing trend and make informed trading decisions on the H1 timeframe. MrGoldTrend’s gold lines indicate an uptrend, while blue lines signify a downtrend, providing immediate visual clarity for trend direction. Key Features: Clear Trend Visualization : Gold lines for uptrends, b
FREE
Ichimoku Aiko MTF
Michael Jonah Randriamampionontsoa
Ichimoku Aiko MTF is a collection of technical indicators that show support and resistance levels, as well as momentum and trend direction. It is a multi-timeframe indicator so you don't need to change the chart timeframe when you want to see the ichimoku clouds on a higher timeframe.  eg. The chart timeframe is M15 and you want to see on the M15 timeframe chart the H1 ichimoku indicators (the ichimoku in Metatrader can't do that) that's why you need to use Ichimoku Aiko MTF.
Slopes are an increasingly key concept in Technical Analysis. The most basic type is to calculate them on the prices, but also on technical indicators such as moving averages and the RSI. In technical analysis, you generally use the RSI to detect imminent reversal moves within a range. In the case of the Blue indicator, we are calculating the slope of the market price and then calculating the RSI of that slope in order to detect instances of reversal. The Blue indicator is therefore used as
Tough Cookie Multi Asset
Florian Leonhard Schaal
Overview The ToughCookie Indicator is a powerful and versatile tool designed specifically for traders employing Dollar-Cost Averaging (DCA) strategies. This indicator enhances your trading experience by providing detailed position information, visualizing the average entry price as a horizontal line, and integrating a customizable Simple Moving Average (SMA) for trend and entry identification. Ideal for both novice and experienced traders, ToughCookie streamlines decision-making and offers real
Multi-timeframe trend indicator based on the ADX / ADXWilder indicator with Fibonacci levels The indicator shows trend areas using ADX or ADXWilder indicator data from multiple timeframes. The impulse mode of the indicator allows you to catch the beginning of a trend, and several "Screens" with different timeframes allow you to filter out market noise. Fibonacci levels are added to the price chart, which have flexible settings. How the indicator works: if PDI is greater than NDI, then   it`s
FREE
Order Book, known also as Market Book, market depth, Level 2, - is a dynamically updated table with current volumes of orders to buy and to sell specific financial instument at price levels near Bid and Ask. MetaTrader 5 provides the means for receiving market book from your broker, but in real time only, without access to its history. The indicator OrderBook Cumulative Indicator accumulates market book data online and visualizes them on the chart. In addition, the indicator can show the market
Point Black
Ignacio Agustin Mene Franco
Pack Black Card indicador 5/1  Point black  cuenta con la estrategia de bollingers profesionales donde cada flecha te da una señal distinta de entrada .  sirve asta para operar en m1 y en d1  sirve para hacer scalping y intraday ,  modificado para los mercados de forex !  apto para todo los pares  modificado para los mercados de indices sinteticos apto para todo los pares !  Ideal para los volatilitys y jumps ! 
All about time and price by ICT. This indicator provides a comprehensive view of ICT killzones, Silver Bullet times, and ICT Macros, enhancing your trading experience.  In those time windows price either seeks liquidity or imbalances and you often find the most energetic price moves and turning points. Features: Automatic Adaptation: The ICT killzones intelligently adapt to the specific chart you are using. For Forex charts, it follows the ICT Forex times: In EST timezone: Session: Asia: 20h00-0
Important Lines
Terence Gronowski
4.86 (21)
Indicador de líneas importantes (M1 - M15) Este indicador muestra Líneas pivote, Día anterior alta y baja, Cierre día anterior y el mínimo y máximo de la hora anterior. Simplemente tiene que arrastrar ese único indicador al diagrama para tener todas esas líneas importantes. Puede evitar cargar muchos indicadores individuales. ¿Por qué ciertas líneas son tan importantes cuando se comercia? El día a día, alto y bajo: estos son observados por los comerciantes que comercian en un gráfico diario.
FREE
Reversal Candles MT5
Nguyen Thanh Cong
5 (4)
Introduction Reversal Candles is a cutting-edge non-repainting   forex indicator designed to predict price reversals with remarkable accuracy through a sophisticated combination of signals. Signal Buy when the last closed candle has a darker color (customizable) and an up arrow is painted below it Sell when the last closed candle has a darker color (customizable) and a down arrow is painted above it
FREE
El indicador Ichimoku Kinko Hyo sirve para el trading tendencial y se utiliza prácticamente en todos los mercados. Este indicador es único en muchos sentidos. Sin embargo, su ventaja principal consiste en ofrecer a los traders muchos puntos de referencia que permiten formar un concepto más comprensivo y completo sobre el movimiento del precio. Esta profundidad del análisis y una exclusiva claridad del indicador permite a los traders distinguir rápidamente las posibilidades comerciales y seleccio
JAC Trend Color Candle
Eduardo Da Costa Custodio Santos
El indicador "JAC Trend Color Candle" para Meta Trader 5, fue creado para facilitar visualmente la tendencia al comerciante. Se basa en tres parámetros, que identifican el mercado con tendencia alcista, bajista y sin tendencia. Los colores son configurables por el comerciante, y el comerciante promedio también lo es. Los parámetros de tendencia no se pueden configurar ya que son el diferencial del indicador.
Owl Smart Levels MT5
Sergey Ermolov
4 (29)
Versión MT4  |  FAQ El Indicador Owl Smart Levels es un sistema comercial completo dentro de un indicador que incluye herramientas de análisis de mercado tan populares como los fractales avanzados de Bill Williams , Valable ZigZag que construye la estructura de onda correcta del mercado y los niveles de Fibonacci que marcan los niveles exactos de entrada. en el mercado y lugares para tomar ganancias. Descripción detallada de la estrategia Instrucciones para trabajar con el indicador Asesor de c
TrendDetect
Pavel Gotkevitch
The Trend Detect indicator combines the features of both trend indicators and oscillators. This indicator is a convenient tool for detecting short-term market cycles and identifying overbought and oversold levels. A long position can be opened when the indicator starts leaving the oversold area and breaks the zero level from below. A short position can be opened when the indicator starts leaving the overbought area and breaks the zero level from above. An opposite signal of the indicator can b
El Capturador de Tendencias: La Estrategia del Capturador de Tendencias con Indicador de Alerta es una herramienta versátil de análisis técnico que ayuda a los traders a identificar las tendencias del mercado y los posibles puntos de entrada y salida. Presenta una Estrategia dinámica del Capturador de Tendencias, adaptándose a las condiciones del mercado para una clara representación visual de la dirección de la tendencia. Los traders pueden personalizar los parámetros para que se ajusten a su
FREE
Combined
Ahmed Alaaeldin Abdulrahman Ahmed Elherzawi
5 (1)
Welcome to Investment Castle products This product is exclusively available in the MQL5 market and is not available and will not be available anywehere else. The Combined indicator is a multi-time frame indicator and it is built using 3 indicators: Bands indicator which draws the support and resistance key levels using up to 5 different time frames Patterns indicator which draws the chart patterns using up to 6 different time frames Spots indicator which shows the common candlestick patterns Yo
Size Bars
Viktor Loginov
Size Bars – индикатор отображает на графике максимальный, минимальный, текущий и средний размер баров (свечей) за выбранный период. Отображаемые параметры индикатора Size Bars: 1)       Текущий размер бара в писах (по максимум/минимум, тело бара). 2)       Максимальный, минимальный и средний размер свечей BUY . 3)       Максимальный, минимальный, средний размер свечей SELL . 4)       Количество свечей BUY и количество свечей SELL . 5)       Среднее количество свечей подряд BUY и SELL . 6)     
The Magic SMA indicator is of great help in determining trend direction. It can be an excellent addition to your existing strategy or the basis of a new one. We humans can make better decisions when we see better visually. So we designed it to show a different color for rising and falling trends. Everyone can customize this in the way that suits them best. By setting the Trend Period, we can optimize it for longer or shorter trends for our strategy. It is great for all time frames. IF YOU NEED
FREE
Entry IQ MT5
Michael Prescott Burney
3 (2)
The Entry IQ Indicator is a technical analysis tool designed to assist traders in identifying potential entry points for long and short positions. It utilizes dynamic price boxes, equilibrium zones, and trend detection algorithms to analyze market trends and price movements. The indicator adapts to different broker price digit formats, provides customizable arrow signals, and plots real-time trendlines to refine signal accuracy. By assessing price action over a specific lookback period, Entry I
FREE
Indicator and Expert Adviser  EA Available in the comments section of this product. Download with Indicator must have indicator installed for EA to work. Mt5 indicator alerts for bollinger band and envelope extremes occurring at the same time. Buy signal alerts occur when A bullish candle has formed below both the lower bollinger band and the lower envelope  Bar must open and close below both these indicators. Sell signal occur when A bear bar is formed above the upper bollinger band and upper
FREE
The indicator detects and displays М. Gartley's Butterfly pattern. The pattern is plotted by the extreme values of the ZigZag indicator (included in the resources, no need to install). After detecting the pattern, the indicator notifies of that by the pop-up window, a mobile notification and an email. The pattern and wave parameters are displayed on the screenshots. The default parameters are used for demonstration purposes only in order to increase the amount of detected patterns. Parameters z
HMA Color with Alerts MT5
Pavel Zamoshnikov
4.73 (52)
Hull Moving Average (HMA) is well-deservedly popular among traders because of the effective averaging of market noise and a relatively small delay. The current MetaTrader 5 version changes its color when the movement direction changes. Sound and text signals are available. It also supports sending email and push messages. It is possible to trigger a signal on the current incomplete bar, although such a signal may be canceled before completion if conditions are no longer appropriate. One of the p
FREE
Donchian Channel DC is the indicator of Donchian Channels, that plots maximum and minimum values of a specific period, besides mean value line. It´s possible to configure simple period for analysis and the indicator will plot all three values. You can trade with this indicator as trend or reversal, according to each strategy. Do not let to test others indicators as soon as others expert advisors.
Indicador de tendencia trillionario . La tendencia Trilliant es un indicador forex avanzado que combina los indicadores respetados ocultos para detectar la tendencia temprano. Como su nombre sugiere, es un indicador de tendencia pero incorporado para el comercio de casi todas las estrategias de divisas (todas en una), manipulando los ajustes, bandas y líneas en el indicador. Cualquier estrategia de divisas se puede negociar utilizando la tendencia trillionaria. Las condiciones se cumplen cuan
HiperCube VIX
Adrian Lara Carrasco
Bienvenido a HiperCube VIX Código del -25% de descuento en Darwinex Zero: DWZ2328770MGM Este indicador le proporciona información real del mercado de volumen de sp500 / us500 Definición HiperCube VIX, conocido como el índice de volatilidad CBOE, es una medida ampliamente reconocida del miedo o estrés del mercado. Señala el nivel de incertidumbre y volatilidad en el mercado de valores, utilizando el índice S&P 500 como un indicador del mercado en general. El índice VIX se calcula en función de
FREE
Description:  For a comprehensive understanding of our indicators, we invite you to explore the entire Q&A section within this MQL5 blog post   here . The "Currency Strength Meter Strategy" Indicator is a cutting-edge technical analysis tool that offers traders a unique perspective on the forex market. By analyzing the relative strength of different currencies, this indicator provides valuable insights into the market's dynamics, allowing traders to make informed decisions. Understanding Curren
Los compradores de este producto también adquieren
Trend Screener Pro MT5
STE S.S.COMPANY
4.85 (79)
Desbloquee el poder del comercio de tendencias con el indicador Trend Screener: ¡su solución definitiva para el comercio de tendencias impulsada por lógica difusa y un sistema multidivisa!Mejore su comercio de tendencias con Trend Screener, el revolucionario indicador de tendencias impulsado por lógica difusa. Es un poderoso indicador de seguimiento de tendencias que combina más de 13 herramientas y funciones premium y 3 estrategias comerciales, lo que lo convierte en una opción versátil para co
Moneytron — профессиональный сигнальный индикатор тренда Индикатор Moneytron предназначен для тех, кто хочет зарабатывать стабильно и системно, торгуя по тренду. Он автоматически определяет: • Точки входа (Buy/Sell сигналы) • 3 уровня тейк-профита (TP1, TP2, TP3) • 3 уровня стоп-лосса (SL1, SL2, SL3) • Показывает реальную статистику успешности сделок прямо на графике Особенности: • Работает на всех валютных парах и металлах • Идеален для таймфреймов M30, H1 и выше • Подходит как для начинающи
Algo Pumping
Ihor Otkydach
5 (7)
PUMPING STATION – Tu estrategia personal "todo incluido" Te presentamos PUMPING STATION, un indicador revolucionario para Forex que transformará tu forma de operar en una experiencia emocionante y eficaz. No es solo un asistente, sino un sistema de trading completo con potentes algoritmos que te ayudarán a operar de forma más estable. Al comprar este producto, recibes GRATIS: Archivos de configuración exclusivos: para una configuración automática y un rendimiento óptimo. Manual en video paso a
Golden Trend Indicator MT5
Noha Mohamed Fathy Younes Badr
4.89 (18)
Golden Trend indicator  is The best indicator for predicting trend movement this indicator never lags and never repaints and never back paints    and give  arrow buy and sell    before the candle appear  and it will help you and  will make your trading decisions clearer its work on all currencies and  gold and crypto and all time frame This unique  indicator uses very secret algorithms to catch the  trends, so you can trade using this indicator and see the trend clear on charts  manual guide and
Support And Resistance Screener está en un indicador de nivel para MetaTrader que proporciona múltiples herramientas dentro de un indicador. Las herramientas disponibles son: 1. Cribador de estructura de mercado. 2. Zona de retroceso alcista. 3. Zona de retroceso bajista. 4. Puntos pivotes diarios 5. Puntos de pivote semanales 6. Puntos Pivotes mensuales 7. Fuerte soporte y resistencia basado en patrón armónico y volumen. 8. Zonas de nivel de banco. OFERTA POR TIEMPO LIMITADO: El indicador de so
FX Power MT5 NG
Daniel Stein
5 (13)
FX Power: Analiza la Fuerza de las Divisas para Decisiones de Trading Más Inteligentes Descripción General FX Power es tu herramienta esencial para comprender la fuerza real de las principales divisas y el oro en cualquier condición de mercado. Al identificar divisas fuertes para comprar y débiles para vender, FX Power simplifica las decisiones de trading y descubre oportunidades de alta probabilidad. Ya sea que quieras seguir las tendencias o anticipar reversiones utilizando valores extremos
FX Volume MT5
Daniel Stein
4.82 (17)
FX Volume: Experimente el Verdadero Sentimiento del Mercado desde la Perspectiva de un Bróker Resumen Rápido ¿Desea llevar su estrategia de trading a otro nivel? FX Volume ofrece información en tiempo real sobre cómo los traders minoristas y los brókers están posicionados, mucho antes de que aparezcan informes retrasados como el COT. Ya sea que busque beneficios consistentes o simplemente quiera una ventaja más profunda en los mercados, FX Volume le ayuda a identificar desequilibrios important
TPSproTREND PrO MT5
Roman Podpora
4.72 (18)
VERSION MT4        —        ИНСТРУКЦИЯ RUS           —        INSTRUCTIONS  ENG Funciones principales: Señales de entrada precisas ¡SIN RENDERIZACIÓN! Si aparece una señal, ¡sigue siendo relevante! Esta es una diferencia importante con respecto a los indicadores de redibujo, que pueden proporcionar una señal y luego cambiarla, lo que puede provocar una pérdida de fondos depositados. Ahora puedes ingresar al mercado con mayor probabilidad y precisión. También existe la función de colorear las v
FX Levels MT5
Daniel Stein
5 (4)
FX Levels: Zonas de Soporte y Resistencia con Precisión Excepcional para Todos los Mercados Resumen Rápido ¿Busca una manera confiable de identificar niveles de soporte y resistencia en cualquier mercado — ya sean divisas, índices, acciones o materias primas? FX Levels combina el método tradicional “Lighthouse” con un enfoque dinámico vanguardista, ofreciendo una precisión casi universal. Gracias a nuestra experiencia real con brokers y a las actualizaciones automáticas diarias más las de tiem
FourAverageMT5
Mikhail Sergeev
5 (2)
FourAverage es una nueva palabra en la detección de tendencias. Con el desarrollo de las tecnologías de la información y un gran número de participantes, los mercados financieros son cada vez menos susceptibles de ser analizados por indicadores obsoletos. Los medios técnicos convencionales de análisis, como la media Móvil o el Estocástico, en su forma pura no son capaces de determinar la dirección de la tendencia o su reversión. ¿Puede un indicador indicar la dirección correcta del precio futuro
Gold Stuff mt5
Vasiliy Strukov
4.93 (178)
Gold Stuff mt5: un indicador de tendencia diseñado específicamente para el oro, también se puede usar en cualquier instrumento financiero. El indicador no se vuelve a dibujar ni se retrasa. El marco de tiempo recomendado es H1. IMPORTANTE! Póngase en contacto conmigo inmediatamente después de la compra para obtener instrucciones y bonificación!   Puede obtener una copia gratuita de nuestro indicador Strong Support y Trend Scanner, por favor envíe un mensaje privado. ¡a mí! PARÁMETROS Draw Ar
IX Power MT5
Daniel Stein
4.86 (7)
IX Power: Descubre perspectivas de mercado para índices, materias primas, criptomonedas y forex Descripción general IX Power es una herramienta versátil diseñada para analizar la fortaleza de índices, materias primas, criptomonedas y símbolos de forex. Mientras que FX Power ofrece la máxima precisión para pares de divisas mediante el uso de datos de todos los pares disponibles, IX Power se centra exclusivamente en los datos del mercado del símbolo subyacente. Esto convierte a IX Power en una e
Grabber System MT5
Ihor Otkydach
5 (5)
Te presento un excelente indicador técnico: Grabber, que funciona como una estrategia de trading "todo incluido" lista para usar. En un solo código se integran potentes herramientas de análisis técnico del mercado, señales de trading (flechas), funciones de alertas y notificaciones push. Cada comprador de este indicador recibe además de forma gratuita: Grabber Utility: una herramienta para la gestión automática de órdenes abiertas Video manual paso a paso: cómo instalar, configurar y operar con
Matrix Arrow Indicator MT5
Juvenille Emperor Limited
5 (13)
Matrix Arrow Indicator MT5   es una tendencia única 10 en 1 que sigue un indicador   100% sin repintado   de marcos temporales múltiples que se puede usar en todos los símbolos/instrumentos:   divisas ,   materias primas ,   criptomonedas ,   índices ,   acciones .  Matrix Arrow Indicator MT5  determinará la tendencia actual en sus primeras etapas, recopilando información y datos de hasta 10 indicadores estándar, que son: Índice de movimiento direccional promedio (ADX) Índice de canales de prod
Este es posiblemente el indicador de reconocimiento automático de formación de precios más completo que puede encontrar para la plataforma MetaTrader. Detecta 19 patrones diferentes, toma las proyecciones de Fibonacci tan en serio como usted, muestra la zona de reversión potencial (PRZ) y encuentra niveles adecuados de stop-loss y take-profit. [ Guía de instalación | Guía de actualización | Solución de problemas | FAQ | Todos los productos ] Detecta 19 formaciones de precios armónicos diferen
Quantum TrendPulse
Bogdan Ion Puscasu
5 (13)
Presentamos   Quantum TrendPulse   , la herramienta de trading definitiva que combina el poder de   SuperTrend   ,   RSI   y   Stochastic   en un indicador integral para maximizar su potencial de trading. Diseñado para traders que buscan precisión y eficiencia, este indicador le ayuda a identificar tendencias del mercado, cambios de impulso y puntos de entrada y salida óptimos con confianza. Características principales: Integración con SuperTrend:   siga fácilmente la tendencia predominante del
MTF Supply Demand Zones MT5
Georgios Kalomoiropoulos
5 (1)
Próxima generación de zonas de oferta y demanda automatizadas. Algoritmo nuevo e innovador que funciona en cualquier gráfico. Todas las zonas se crean dinámicamente de acuerdo con la acción del precio del mercado. DOS TIPOS DE ALERTAS --> 1)CUANDO EL PRECIO LLEGA A UNA ZONA 2)CUANDO SE FORMA UNA NUEVA ZONA No obtienes un indicador inútil más. Obtiene una estrategia comercial completa con resultados probados.     Nuevas características:     Alertas cuando el precio llega a la zona de ofert
The   Time_Price_SQ9_Degree   indicator is based on the 9 Gann square. Using this indicator, you can identify strong time and price zones. The indicator displays the levels as a degree value. The degrees can be set in the settings. After launching, the MENU button appears. If it is highlighted, it can be moved to any point on the graph, and after double-clicking on it, it stops being highlighted and menu buttons appear. To hide the menu, just double-click on the button, it will become highlight
Este tablero muestra los últimos   patrones armónicos   disponibles para los símbolos seleccionados, por lo que ahorrará tiempo y será más eficiente /   versión MT4 . Indicador gratuito:   Basic Harmonic Pattern Columnas del indicador Symbol:   aparecerán los símbolos seleccionados Trend :   alcista o bajista Pattern :   tipo de patrón (gartley, mariposa, murciélago, cangrejo, tiburón, cifrado o ABCD) Entry :   precio de entrada SL:   precio de stop loss TP1:   1er precio de toma de beneficios
FX Dynamic: Rastrea la volatilidad y las tendencias con un análisis ATR personalizable Descripción general FX Dynamic es una herramienta potente que emplea los cálculos de Average True Range (ATR) para brindar a los traders información incomparable sobre la volatilidad diaria e intradía. Al establecer umbrales de volatilidad claros —por ejemplo, 80%, 100% y 130%— puedes identificar rápidamente oportunidades de beneficio o recibir alertas cuando el mercado excede sus rangos habituales. FX Dynam
El Oscilador de Índice de Precisión (Pi-Osc) de Roger Medcalf de Precision Trading Systems La versión 2 ha sido cuidadosamente recodificada para cargar rápidamente en su gráfico y se han incorporado algunas otras mejoras técnicas para mejorar la experiencia. El Pi-Osc fue creado para proporcionar señales precisas de temporización de operaciones diseñadas para encontrar puntos de agotamiento extremos, los puntos a los que los mercados se ven obligados a llegar solo para eliminar las órdenes de
Indicador único que implementa un enfoque profesional y cuantitativo para el comercio de reversión a la media. Aprovecha el hecho de que el precio se desvía y vuelve a la media de manera predecible y medible, lo que permite reglas claras de entrada y salida que superan ampliamente las estrategias comerciales no cuantitativas. [ Installation Guide | Update Guide | Troubleshooting | FAQ | All Products ] Señales comerciales claras Sorprendentemente fácil de operar Colores y tamaños personalizables
Ante todo, vale la pena enfatizar que esta Herramienta de Trading es un Indicador No Repintado, No Redibujado y No Retrasado, lo que la hace ideal para el trading profesional. Curso en línea, manual del usuario y demostración. El Indicador de Conceptos de Acción del Precio Inteligente es una herramienta muy potente tanto para traders nuevos como experimentados. Combina más de 20 indicadores útiles en uno solo, combinando ideas avanzadas de trading como el Análisis del Trader del Círculo Interi
¿Cansado de trazar líneas de soporte y resistencia? La resistencia de soporte es un indicador de marco de tiempo múltiple que detecta y traza automáticamente los soportes y las líneas de resistencia en el gráfico con un giro muy interesante: a medida que los niveles de precios se prueban con el tiempo y aumenta su importancia, las líneas se vuelven más gruesas y oscuras. [ Guía de instalación | Guía de actualización | Solución de problemas | FAQ | Todos los productos ] Mejora tu análisis técnic
Legend mt5
Vladyslava Shaviernieva
This is an indicator that includes the best basic forex indicators , without redrawing. Based on this data, a sell or buy signal is generated. It does not disappear anywhere after the signal, which gives us the opportunity to see the results on the history. It can be used on any currency pair, crypto, metals, stocks It is best used on an hourly chart, but other periods are also acceptable. The best results for the period H1,H4,daily If customers have any questions, I will answer them and af
Easy Buy Sell is a market indicator for opening and closing positions. It becomes easy to track market entries with alerts. It indicates trend reversal points when a price reaches extreme values ​​and the most favorable time to enter the market. it is as effective as a Fibonacci to find a level but it uses different tools such as an algorithm based on ATR indicators and Stochastic Oscillator. You can modify these two parameters as you wish to adapt the settings to the desired period. It cannot
Trend Hunter MT5
Andrey Tatarinov
5 (2)
Trend Hunter es un indicador de tendencias para trabajar en los mercados Forex, criptomonedas y CFD. Una característica especial del indicador es que sigue con confianza la tendencia, sin cambiar la señal cuando el precio perfora ligeramente la línea de tendencia. El indicador no se vuelve a dibujar; aparece una señal para ingresar al mercado después del cierre de la barra. Al avanzar a lo largo de una tendencia, el indicador muestra puntos de entrada adicionales en la dirección de la tendenci
Trend Line Map Pro MT5
STE S.S.COMPANY
4.09 (11)
El indicador Trend Line Map es un complemento para Trend Screener Indicator. Funciona como un escáner para todas las señales generadas por el evaluador de tendencias (Trend Line Signals). Es un escáner de líneas de tendencia basado en el indicador de evaluación de tendencias. Si no tiene el indicador Trend Screener Pro, Trend Line Map Pro no funcionará. It's a Trend Line Scanner based on Trend Screener Indicator. If you don't have Trend Screener Pro Indicator,     the Trend Line Map Pro will n
TPSpro RFI Levels MT5
Roman Podpora
4.55 (20)
El indicador que redefinió el trading, se convirtió en el punto de referencia para el análisis de gráficos y estableció nuevos estándares en el trading. Zonas de reversión /   Zonas de volumen máximo   /   Zonas activas de un jugador grande     INSTRUCCIONES RUS         INSTRUCCIONES   ENG   /   Recomendamos utilizar con el indicador -   TPSpro TREND PRO Cada comprador de este indicador recibe adicionalmente GRATIS: 6 meses de acceso a señales comerciales del servicio RFI SIGNALS: puntos
Auto Order Block with break of structure based on ICT and Smart Money Concepts (SMC) Futures Break of Structure ( BoS )             Order block ( OB )            Higher time frame Order block / Point of Interest ( POI )    shown on current chart           Fair value Gap ( FVG ) / Imbalance   -  MTF      ( Multi Time Frame )    HH/LL/HL/LH  -  MTF      ( Multi Time Frame )  Choch  MTF      ( Multi Time Frame )  Volume Imbalance     ,  MTF          vIMB Gap’s Power of 3 Equal High / Low’s  
Otros productos de este autor
If you love this indicator, please leave a positive rating and comment, it will be a source of motivation to help me create more products <3 Key Takeaways The Zig Zag  Advanced   indicator plot points on a chart whenever prices reverse by the percentage the trader sets in the input section. The Zig Zag Advanced indicator lowers the impact of random price fluctuations and is used to identify trends and changes in trends. The indicator lowers noise levels, highlighting trends higher and lower. Th
FREE
SuperTrend Original MT5
Do Kim Dang Khoi
5 (1)
If you love this indicator, please leave a positive rating and comment, it will be a source of motivation to help me create more products <3 How to use SuperTrend? When the price crosses above the supertrend line it signals a buy signal and when the price crosses below the supertrend line it signals a sell signal. The supertrend indicator which acts as a dynamic level of support or resistance and helps traders make informed decisions about entry and exit points.  When prices are above s upertre
FREE
VWAP Original MT5
Do Kim Dang Khoi
5 (1)
If you love this indicator, please leave a positive rating and comment, it will be a source of motivation to help me create more products <3 Key Takeaways VWAP is a trading benchmark that typically is most useful to short-term traders. VWAP is used in different ways by traders  . Traders may use it as   a trend confirmation tool   and build trading rules around it. Also, If prices below VWAP and move above it, c an be used by traders as a sell signal. If prices above VWAP and move below it,  ca
FREE
If you love this indicator, please leave a positive rating and comment, it will be a source of motivation to help me create more products <3 How to use QQE? Determine trend when RSI MA ​​above 50 indicate a bullish market, while RSI MA ​​below 50 indicate a bearish market and   can server as a trend filter. Identify short-term up/down momentum, when the RSI MA crosses up Smoothed signals bullish momentum, and when the RSI MA crosses down Smoothed signals bearish momentum. It is also possible to
FREE
Laguerre RSI MT5
Do Kim Dang Khoi
5 (1)
If you love this indicator, please leave a positive rating and comment, it will be a source of motivation to help me create more products <3 Key Takeaways The Laguerre RSI is an enhanced version of the traditional Relative Strength Index (RSI) that incorporates Laguerre filters to smooth the price data. This helps reduce the noise and volatility that are often seen in the standard RSI, providing a cleaner and more reliable indicator for spotting trends, reversals, and overbought or oversold con
FREE
If you love this indicator, please leave a positive rating and comment, it will be a source of motivation to help me create more products <3 How to use Gann High-Low Activator? The Gann HiLo Activator helps the trader identify the current trend of the market. When the indicator is below the closing price, it can indicate that an uptrend is taking place. Conversely, when the indicator is above the closing price, it can indicate a downtrend. The Gann HiLo Activator also generates buy and sell sig
FREE
If you love this indicator, please leave a positive rating and comment, it will be a source of motivation to help me create more products <3 What is  Schaff Trend Cycle indicator? The Schaff Trend Cycle (STC) is a technical analysis indicator used in trading and investing to identify trends and generate trading signals. The STC is designed to identify trends and trend reversals by measuring the strength of the trend and the speed of price changes. The STC indicator helps to identify trends in a
FREE
If you love this indicator, please leave a positive rating and comment, it will be a source of motivation to help me create more products <3 How to use  Slope Direction Line Uptrend: When the SDL line slopes up and turns from red to green, it shows that the price is trending up. This is also considered a buy signal. Downtrend: When the SDL line slopes down and turns from green to red, it shows that the price is trending down. This is also considered a sell signal. Sideways: When the SDL line mo
FREE
Key Takeaways This timer does not lag like other timer indicators Show the time end of candlesticks and spread Hide or Show Spread depending on user needs Works on all timeframes Adjust Text Size Adjust Text Color Adjust Text Font  If you love this indicator, please leave a positive rating and comment, it will be a source of motivation to help me create more products <3
FREE
Introducing the Sniper EURJPY Sniper EURJPY is a strategy specifically designed for the EURJPY pair.  It utilizes advanced technical analysis to find entry points. Sniper EURJPY is using a ratio of 1:2 with this ratio you only need to have a win rate of over 33% to make a profit. Sniper EURJPY is very suitable for traders who like safety and sustainability. Key Features: NO   Grid and   NO   martingale Risk and Reward: 1:2  gives you a long-term advantage in the market. Trailingstops:  Helps you
FREE
Introducing the Sniper AUDUSD Trading Strategy Sniper AUDUSD is a highly accurate forex trading strategy specifically designed for the AUD/USD currency pair. It leverages advanced technical analysis to identify high-probability entry points, aiming to maximize profits while minimizing risk.  The Sniper AUDUSD strategy uses complex algorithms to analyze and identify trends to generate highly accurate buy and sell signals. Once the signal is activated, the system will automatically execute trades
FREE
If you love this indicator, please leave a positive rating and comment, it will be a source of motivation to help me create more products <3 Key Takeaways Fisher is a repaint indicator. It recalculates previous bars when new bars become available. Modified to avoid repainting to accommodate some merchants. Fisher indicator is quite a simple histogram indicator that detects the trend's direction and strength and signals about trend changes. Traders look for extreme readings to signal potential p
FREE
If you love this indicator, please leave a positive rating and comment, it will be a source of motivation to help me create more products <3 Key Takeaways Bulls Bears Eyes is another version of Laguerre RSI. Use Bull/Bear Power to calculate. One use of the  Bulls Bears Eyes is to identify trends. This is done by looking for sustained periods when the indicator is above or below the 0.5 line. Also, a buy signal is generated when the   Bulls Bears Eyes line crosses above the 0.15 level, while a s
FREE
Filtro:
No hay comentarios
Respuesta al comentario
Versión 1.2 2024.12.02
Fix bugs
Versión 1.1 2024.12.02
Fix a few small errors