Abiroid FVG Blocks
- Indicadores
- Abir Pathak
- Versión: 1.3
- Actualizado: 27 diciembre 2024
- Activaciones: 20
What are Fair Value Gaps (FVG)?
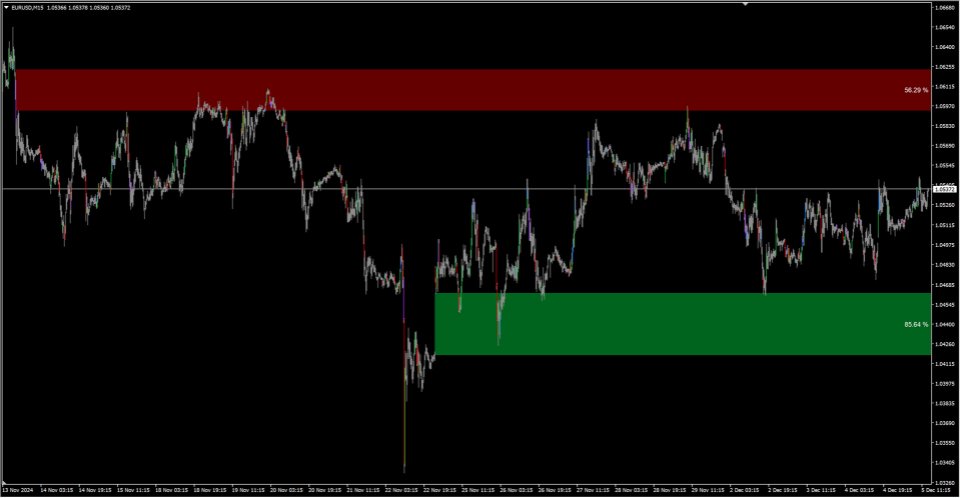
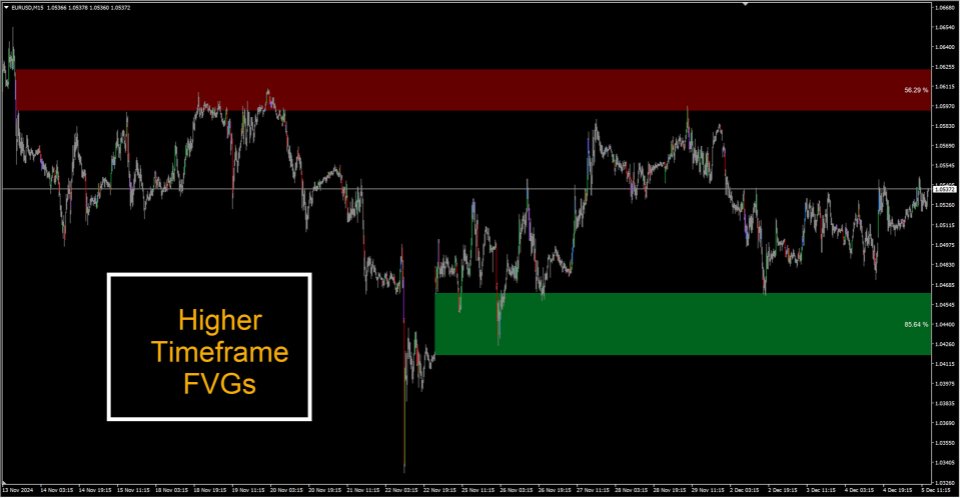
Fair Value Gaps occur when price moves so quickly that it creates an imbalance between buyers and sellers. These gaps represent areas where price "skipped" levels, creating potential zones for price to return and "fill the gap". Think of it as unfinished business in the market that often gets revisited.
They are also considered a support or resistance area because it represents a zone on a chart where there is a significant imbalance between supply and demand, causing price to move easily through that area, which then often acts as a point where price will pause or reverse when revisited, creating a potential support or resistance level depending on the direction of the gap; essentially, when the imbalance corrects itself, the price tends to slow down at the FVG zone.
Best Timeframe: H4
Note: All settings are configured for EURUSD H4 timeframe. If you need other symbols, be sure to change the strength multiplier for each. And also the Threshold %.
Use the FVG Block values to calculate the best multipliers. Don't trade if zone looks too weak and price is easily breaking through it. Use zones where price bounces off multiple times. To indicate a strong level.
I'm afraid I can't help send you settings for individual pairs/symbols. As that would be too many to maintain (forex/crypto/stocks/commodities and so on...). Please fine tune the multipliers and post your best settings in comments in .set files.
That will help everyone :)
Key Indicator Features
- Bullish and bearish FVG zones, and also highlighting the gaps- Dynamic strength percentage calculation based on gap size
- Color-coded blocks (Green for bullish, Red for bearish)
- Alerts when current price enters ongoing FVG zones
- Adjustable sensitivity and filters
Settings Explained
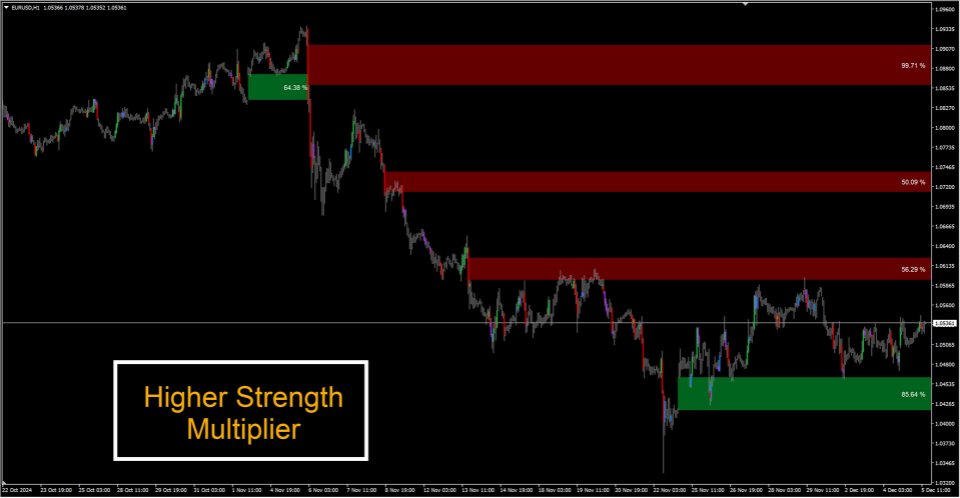
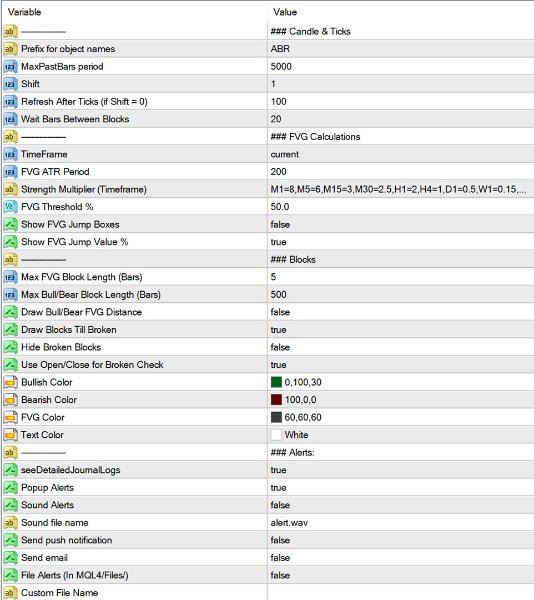
FVG Threshold %: Minimum gap size to highlight a zone (default: 50%). Lower values show more blocks, higher values show only stronger imbalances
Strength Multiplier: Amplifies the gap detection sensitivity. Higher values create more signals. This is useful as lower timeframes have lower point values. So need a higher Multiplier. Higher timeframes need a lower multiplier.
Wait Bars: Minimum bars between blocks to prevent too many blocks
- Show FVG Jump: Display the actual gap zones
- Show FVG Label: Display strength percentage on blocks
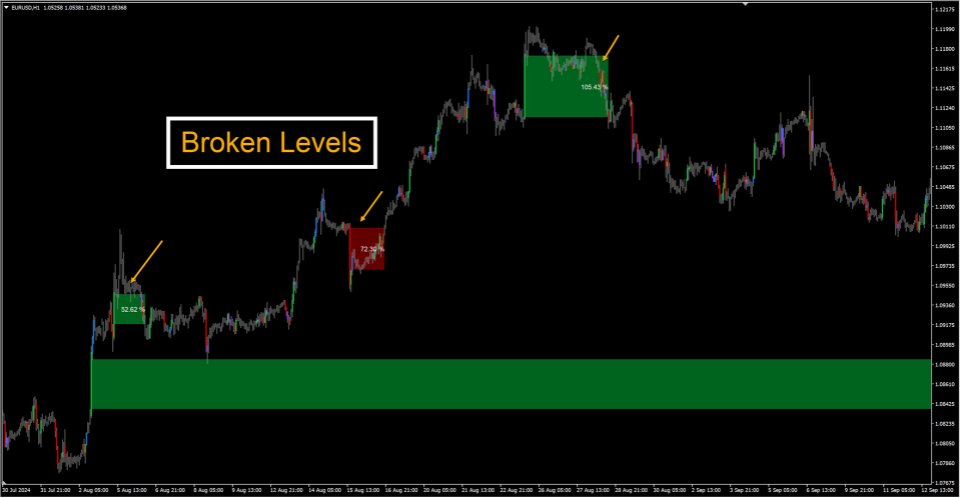
- Hide Broken: Remove blocks once price breaks through them
- Draw Till Broken: Extend blocks until price breaks them
Technical Settings
- ATR Period: For calculating block heights (default: 200)- Max Past Bars: How far back to scan (default: 5000)
- Refresh Ticks: Update frequency (default: 100)
Best Trading Timeframe
H4 (4-hour) timeframe is recommended because:
- Provides cleaner signals- Filters out market noise
- Aligns with major trading sessions
- Shows institutional order blocks more clearly
Technical Details
The indicator calculates imbalances using:
Bullish Gap = ((Current Low - Past High) / Current Low) * 100 * (your strength multiplier)
Bearish Gap = ((Past Low - Current High) / Past Low) * 100 * (your strength multiplier)
These gaps are then filtered and displayed based on your threshold settings.
Your strength multiplier needs to be different for different pairs/symbols/timeframes etc. Default values are for EURUSD H4 timeframe with multiplier x1.
Conclusion
FVG Order Blocks provide a systematic way to identify institutional trading zones.
Remember: This indicator works best as part of a complete trading strategy - use it alongside other confirmation tools for best results.

